


Reports predicting an imminent US ground invasion of Iran intensified over the weekend, triggering an apocalyptic response from the Iranians. The Houthis in Yemen joined the ever-expanding conflict, likely at the behest of Iran, complicating the increasingly chaotic picture further.
Trump ramped up his attempts to gaslight markets with a flurry of detail-free promises of an imminent deal one minute then wild threats of hellfire the next but, given a complete lack of anything credible to digest, Wall Street just isn’t listening any more.
For most of Monday US stocks did a whole lot of nothing with traders unsure as to what posture to take in a vacuum and no trustworthy information coming from any of the conflict participants. But the indexes swooned late in the session to finish in the red again with the S&P 500 creeping closer and closer to official correction territory.
A very rough month and quarter (see my Q1 Market Review here) came to an end at long last on Tuesday with the oil price at a four-year high following its biggest monthly jump in history and US gas prices at the pump averaging above $4/gallon for the first time since mid-2022 and rising, with some places in California seeing closer to $7.
However, the indexes roared higher for their best one-day session in close to a year which was put down to dip buyers and bargain hunters finally showing up on the back of Iran signaling possible co-operation in ceasefire talks and end-of-quarter window dressing which can often create some distortions on the final day.
Trump’s incoherent, jumbled flip-flopping continued after the close. He pledged to bomb Iran “back into the Stone Ages”, end the war in two weeks’ time and touted peace negotiations, all in literally the same sentence. He then promised to grace us all with even more of this kind of insight in a primetime address to the nation the following day.
Q2 kicked off on Wednesday and stocks followed through strongly on Tuesday’s monster rally following spectacular gains in Asia and Europe with a perception that it may be dawning on Trump that the current status of the war is untenable with his approval ratings in the toilet and the midterms coming up in a few months.
The president’s “very important” twenty-minute address was anything but. It was no more than a rambling, self-serving verbal summary of his recent social media posts and gave traders nothing new to work with.
Hard to believe, but Thursday was the one year anniversary of so-called “Liberation Day” and the subsequent market disruption caused by the tariff strategy, but attention is very much focused elsewhere at the moment. Asian and European markets fell back after the letdown of Trump’s disappointing update and Iran’s “bring it on, motherf*****” -style response offered no peace.
Wall Street initially followed the lead of overseas markets with the indexes giving back some of Wednesday’s gains as energy prices rocketed higher again on the prospect of at least two or three more weeks of escalating bombardment in the region and Trump’s bizarre reference to some kind of magical “natural” self-opening of the Strait of Hormuz. A late mini-surge dragged stock prices back to basically flat for the session and pushed interest rates lower ahead of the long weekend.
A Jobs Report released on a Friday when the stock market was closed meant that we aren’t going to get to see any equity market reaction until Monday and that reaction could easily be swamped by geopolitical developments over the weekend.
It was a very solid report with new job creation above even the highest estimates and a fall in the unemployment rate to 4.3%, although downward revisions to prior data took off some of the shine.
Some other things I’m thinking about ..
Going into a trading blackout with a high level of unknowable risk is an unsettling thought for Wall Street traders. This is leading to a relatively predictable pattern of end-of-week selling as relative optimism is typically replaced by risk aversion as the week goes on. Since the Iran war began, the S&P 500 has actually posted cumulative gains over the first three days of the week but has fallen 9% on Thursdays/Fridays. The rationale is simple; a lot can happen in the war during a two-day untradeable period, especially given Trump’s habit of deliberately announcing disruptive policies when US financial markets are closed.
After Trump’s nothing-burger address on Thursday provided no clues, traders have begun to scan the calendar for indications of when this war might end. The only event that really jumps out is the mid-May meeting between Trump and Chinese premier Xi. That’s still a long way off.
Nevertheless, after the best weekly gain of the year for stock markets, the bulls may be starting to chomp at the bit and the bears suddenly look a bit twitchy as Trump looks for an off-ramp to the unpopular war which has clearly not gone as breezily as he assumed it would. The sense is growing that this stock market may soon begin to look for excuses to head north instead of for reasons to sell.
If you are not yet a financial planning or investment management client of Anglia Advisors and would like to explore becoming one, please feel free to reach out to arrange a complimentary no-obligation discovery call with me.
ARTICLE OF THE WEEK ..
It’s a disgrace that this is being permitted. If this crap shows up in your 401k or 403b anytime soon, do NOT go anywhere near it!
.. AND I QUOTE ..
”You need nearly twice as much income today to afford the typical US home compared to before COVID.”
Nick Maggiulli, Ritholtz Wealth Management
LAST WEEK BY THE NUMBERS:
Last week’s S&P 500 market color courtesy of finviz.com
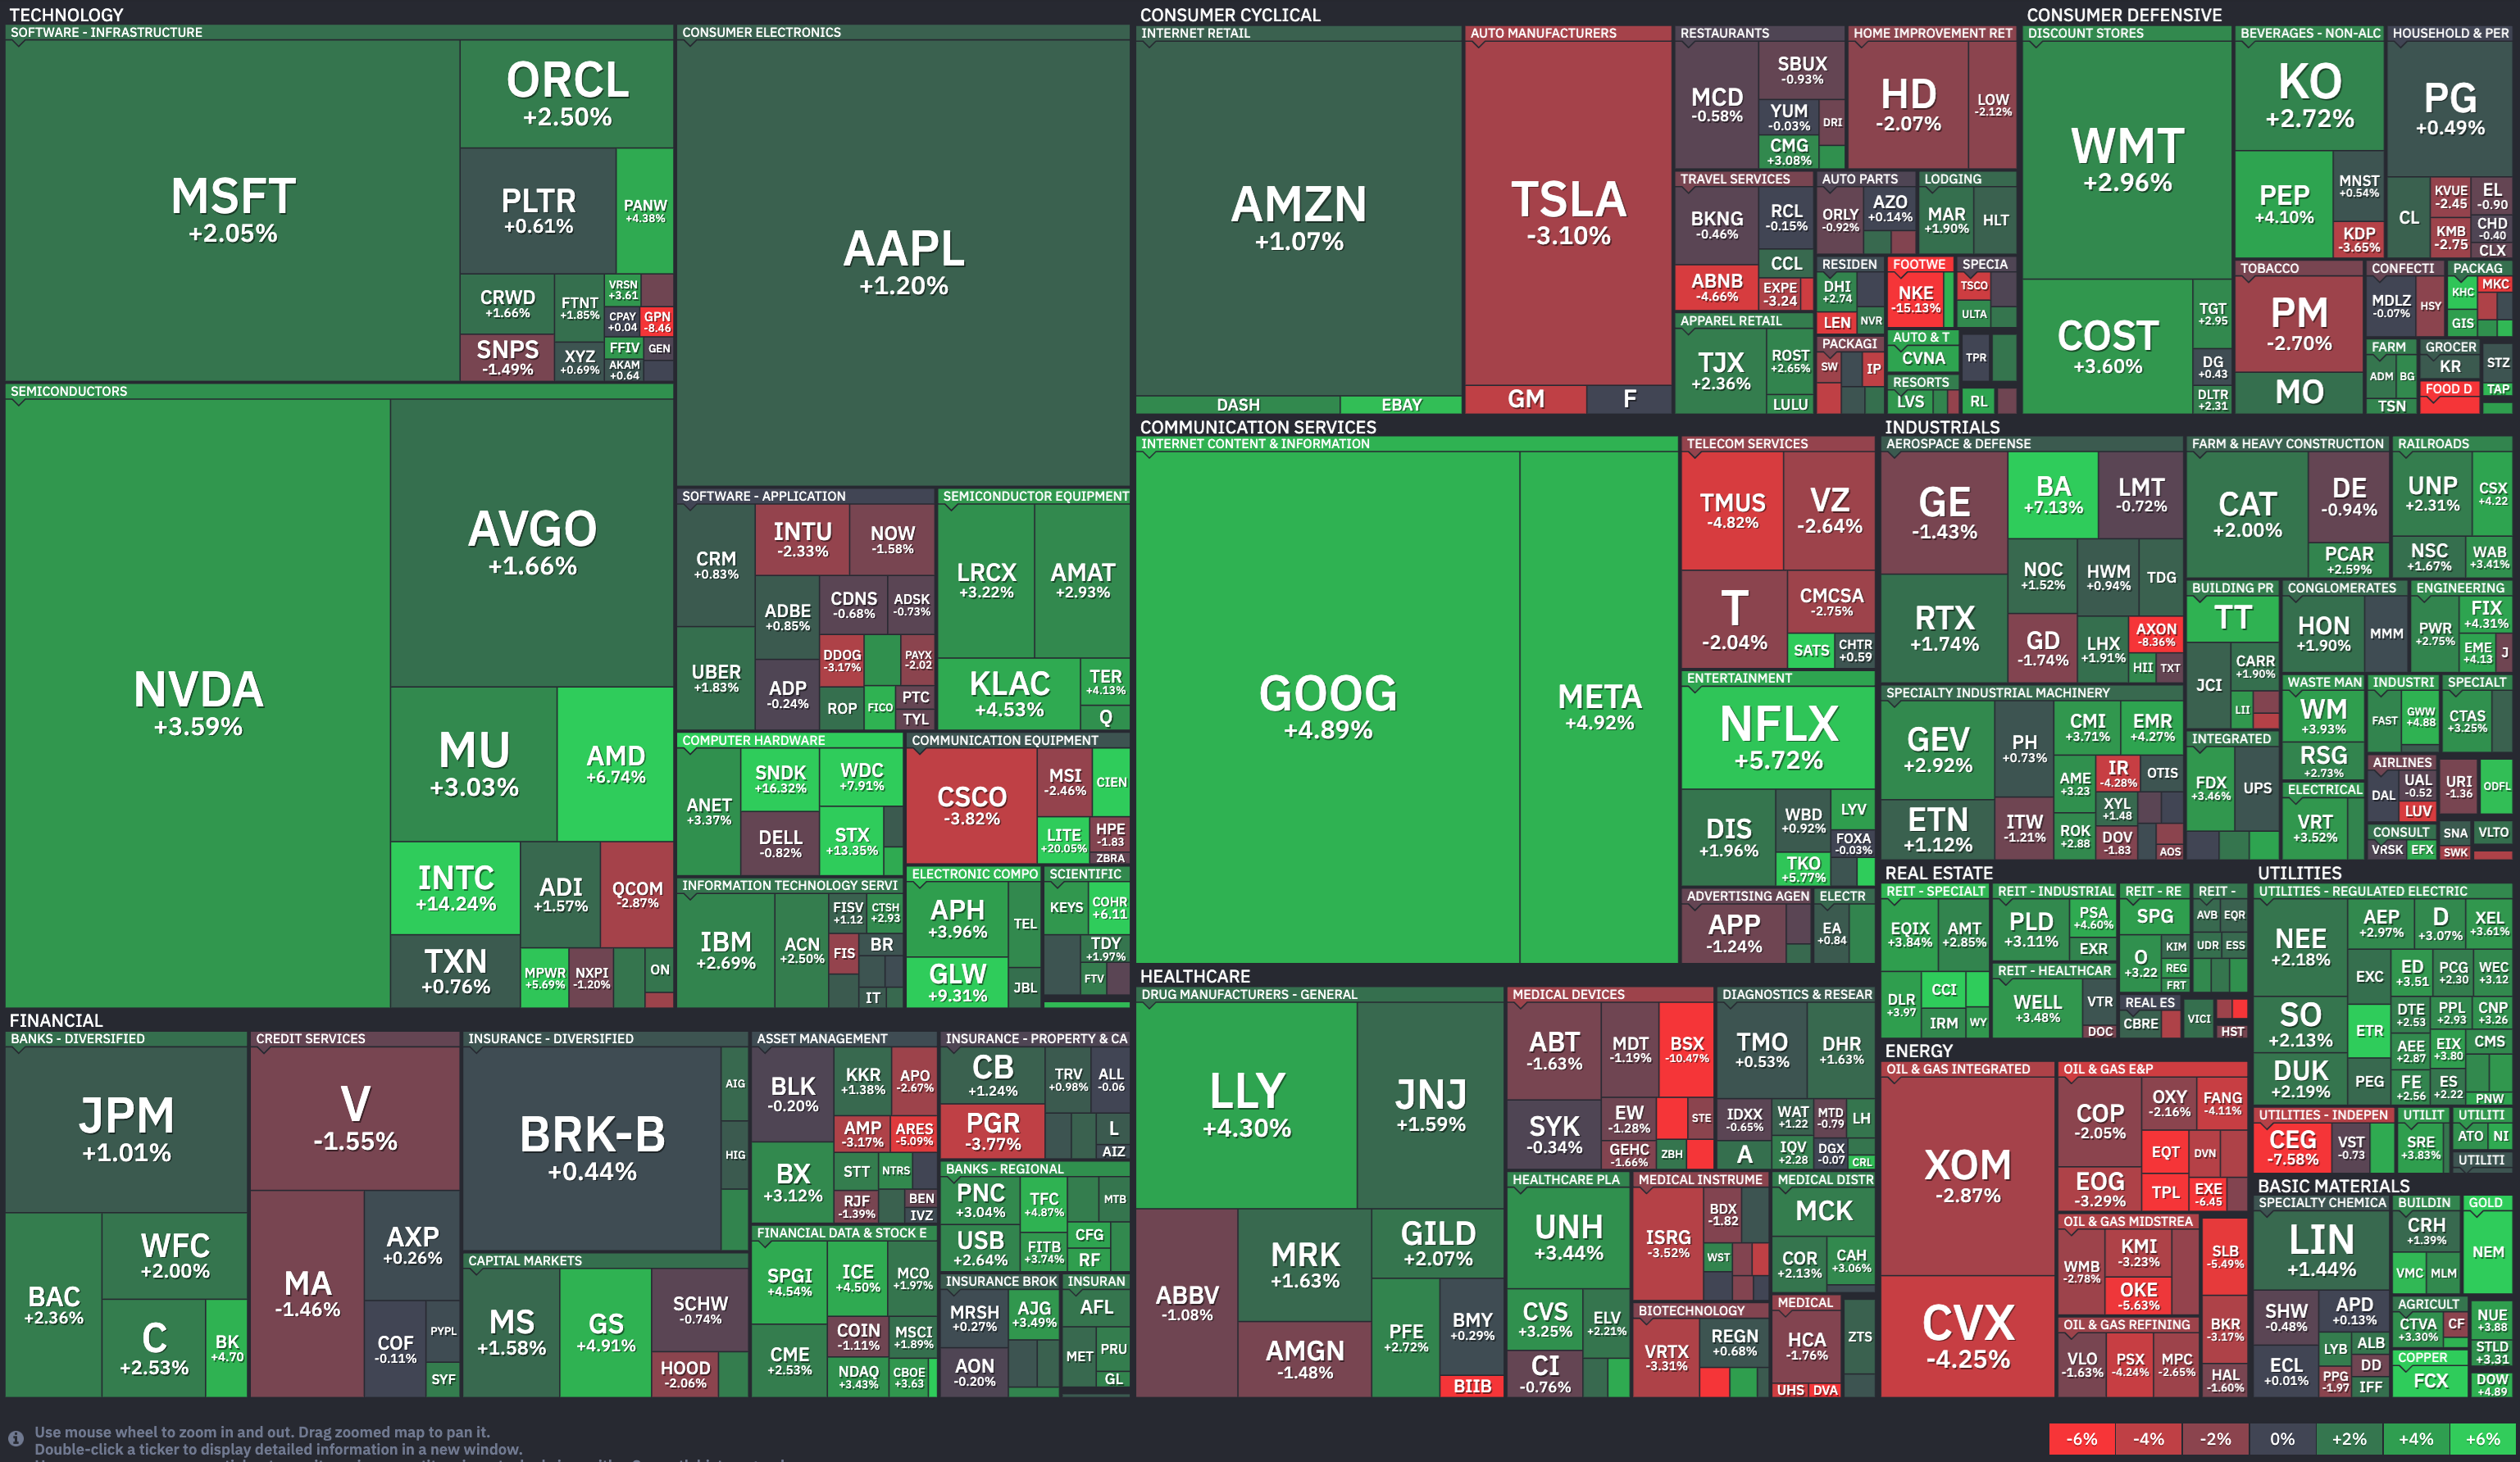
Last week’s best performing US sector: Real Estate (two biggest holdings: Welltower, Prologis) ⬆︎ 3.3% for the week
Last week’s worst performing US sector: Energy (two biggest holdings: Exxon-Mobil, Chevron) ⬇︎ 3.7% for the week
SPY, a US Large Cap ETF, tracks the S&P 500 index, made up of 500 stocks from a universe of the largest US companies. Its price rose 1.7% last week, is down 3.8% so far this year and ended the week 6.0% below its all-time record closing high (01/27/2026).
IWM, a US Small Cap ETF, tracks the Russell 2000 index, made up of the bottom two-thirds in terms of company size of a universe of 3,000 of the largest US stocks. Its price rose 1.6% last week, is up 2.1% so far this year and ended the week 7.5% below its all-time record closing high (01/22/2026).
VXUS, a Global Non-US ETF, tracks the MSCI ACWI Ex-US index, made up of over 8,500 of the largest names from a universe of stocks issued by companies from around the world excluding the United States, in both developed and emerging markets. Its price rose 3.0% last week, is up 2.7% so far this year and ended the week 8.1% below its all-time record closing high (02/25/2026).
INTEREST RATES:
FED FUNDS RATE * ⬌ 3.625% (unchanged from a week ago)
PRIME RATE ** ⬌ 6.75% (unchanged from a week ago)
3 MONTH TREASURY ⬇︎ 3.70% (3.73% a week ago)
2 YEAR TREASURY ⬇︎ 3.79% (3.88% a week ago)
5 YEAR TREASURY ⬇︎ 3.94% (4.06% a week ago)
10 YEAR TREASURY *** ⬇︎ 4.31% (4.44% a week ago)
20 YEAR TREASURY ⬇︎ 4.88% (4.99% a week ago)
30 YEAR TREASURY ⬇︎ 4.88% (4.98% a week ago)
Data courtesy of the Federal Reserve and the Department of the Treasury as of the market close on Friday
* Decided upon by the Federal Reserve Open Market Committee at periodic meetings 8x a year. Used as a basis for overnight interbank loans and for determining high yield savings interest rates.
** Wall Street Journal Prime Rate as of Friday’s close. Tending to move in lockstep with the Fed Funds Rate, this measure is used as a basis for determining certain consumer loan interest rates such as credit cards, auto loans, personal loans, home equity loans/lines of credit and securities-based lending.
*** Used as a basis for determining mortgage interest rates.
AVERAGE 30-YEAR FIXED MORTGAGE RATE:
⬆︎ 6.46%
One week ago: 6.38%, one month ago: 5.99%, one year ago: 6.64%
Data courtesy of the Freddie Mac Primary Mortgage Market Survey
INTEREST RATE EXPECTATIONS:
Where will the Fed Funds interest rate be after the next rate-setting meeting on April 29th?
Unchanged from now .. ⬆︎ 99% probability (96% a week ago)
0.25% lower than now .. ⬇︎ 1% probability (4% a week ago)
With six more rate-setting meetings in 2026, what is the most commonly-expected number of remaining 0.25% Fed Funds interest rate cuts this year?
⬌ Zero (unchanged from a week ago)
Data courtesy of CME FedWatch Tool as of the market close on Friday.
All data based on the Fed Funds interest rate (currently 3.625%).
PERCENT OF S&P 500 STOCKS ABOVE THEIR OWN 200-DAY MOVING AVERAGE:
⬆︎ 48%
One week ago: 43%, one month ago: 61%, one year ago: 46%
Data courtesy of MacroMicro as of Friday’s market close
This widely-used technical measure of market breadth is considered to be a very robust indicator of the overall health of the S&P 500 index.
A high percentage (above 70%) generally suggests broad market strength and a bullish trend, while a low percentage (below 30%) may indicate market weakness and a bearish trend.
FEAR & GREED INDEX:
“Be fearful when others are greedy and be greedy when others are fearful.” Warren Buffett.
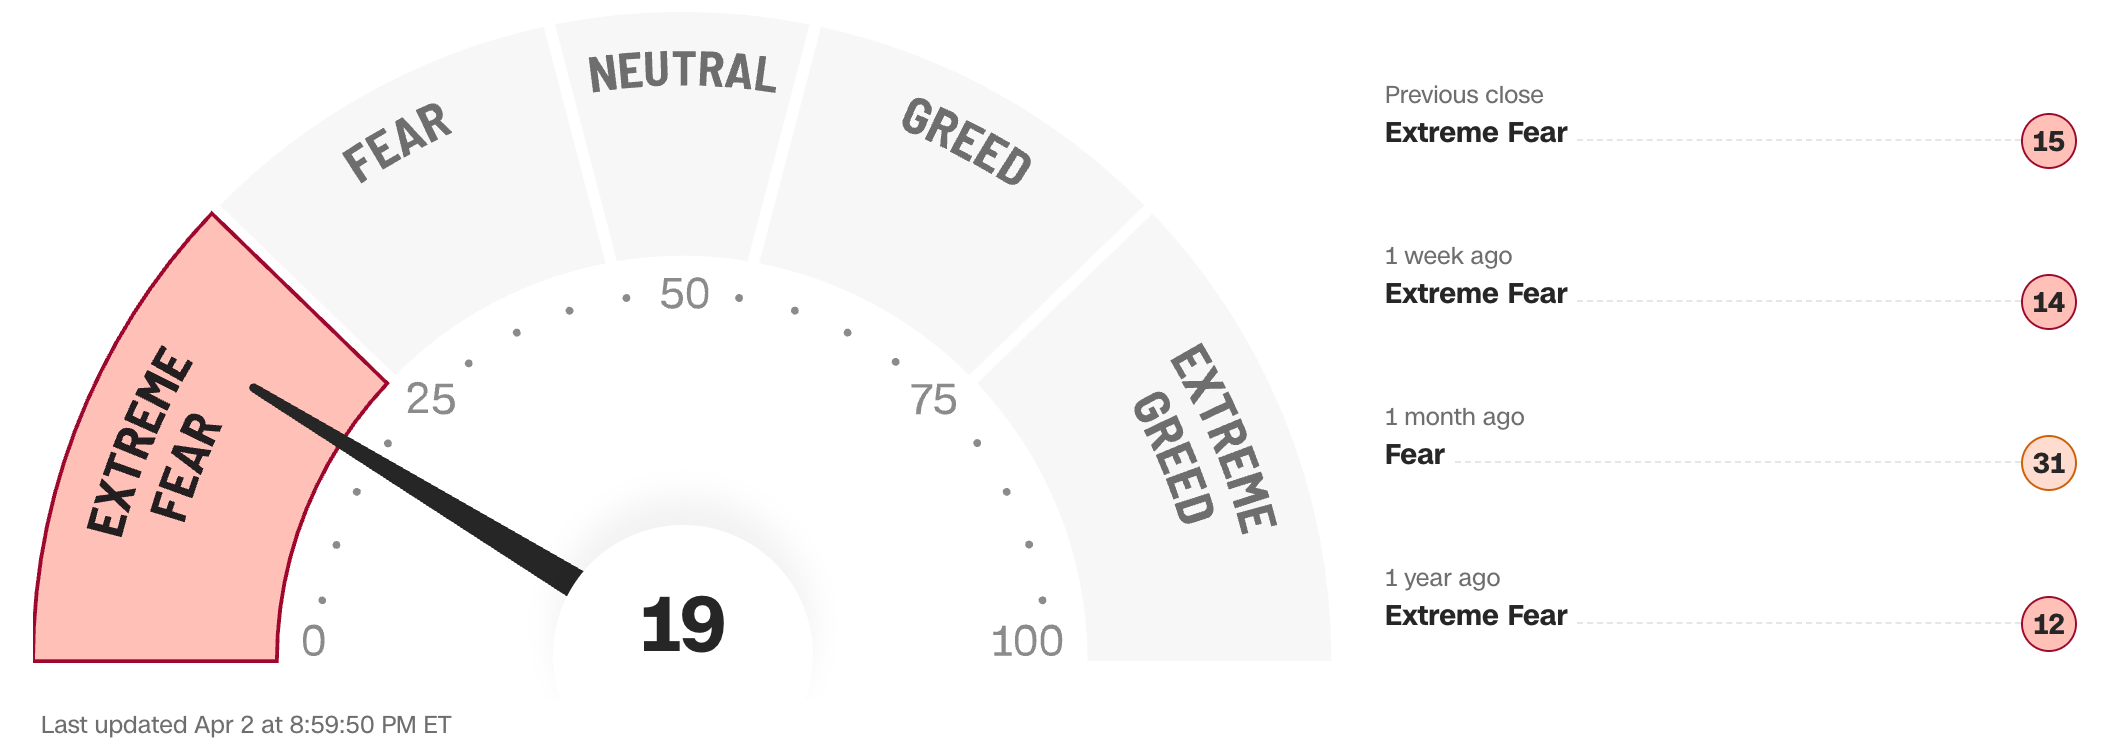
Data courtesy of CNN Business as of Friday’s market close
The Fear & Greed Index from CNN Business can be used as an attempt to gauge whether or not stocks are fairly priced and to determine the mood of the market. It is a compilation of seven of the most important indicators that measure different aspects of stock market behavior. They are: market momentum, stock price strength, stock price breadth, put and call option ratio, junk bond demand, market volatility and safe haven demand.
Extreme Fear readings can lead to potential opportunities as investors may have driven prices “too low” from a possibly excessive risk-off negative sentiment.
Extreme Greed readings can be associated with possibly too-frothy prices and a sense of “FOMO” with investors chasing rallies in an excessively risk-on environment . This overcrowded positioning leaves the market potentially vulnerable to a sharp downward reversal at some point.
A “sweet spot” is considered to be in the lower-to-mid “Greed” zone.
Anglia Advisors recently updated its Privacy Policy. You can view the latest version here.
WWW.ANGLIAADVISORS.COM | SIMON@ANGLIAADVISORS.COM | CALL OR TEXT: (646) 286 0290 | FOLLOW ANGLIA ADVISORS ON INSTAGRAM
This material represents a highly opinionated, speculative assessment of the financial market environment based on assumptions and prevailing information and data at a specific point in time and is always subject to change at any time. Although the content is believed to be correct at the time of publication, no warranty of its accuracy or completeness is ever given. It is never to be interpreted as an attempt to forecast any future events, nor does it offer any kind of guarantee whatsoever of future results, circumstances or outcomes.
The material contained herein is not necessarily complete and is also wholly insufficient to be relied upon as research or investment advice or as a sole basis for any financial determinations, including investment decisions or making any kind of consumer choices, without further consultation with Anglia Advisors or other fully-qualified Registered Investment Advisor. The user assumes the entire risk of any decisions made or actions taken based in whole or in part on any of the information provided in this or any other Anglia Advisors published content.
Under no circumstances is any Anglia Advisors’ content ever intended to constitute tax, legal or medical advice and should never be taken as such. Neither the information contained nor any opinion expressed herein constitutes a solicitation for the purchase of any security or asset class. No formal client advice may be rendered by Anglia Advisors unless and until a properly-executed client engagement agreement is in place.
Posts may contain links or references to third party websites or may post data or graphics from them for the convenience and interest of readers. While Anglia Advisors might have reason to believe in the quality of the content provided on these sites, the firm has no control over, and is not in any way responsible for, the accuracy of such content nor for the security or privacy protocols that external sites may or may not employ. By making use of such links, the user assumes, in its entirety, any kind of risk associated with accessing them or making use of any information provided therein.
Those associated with Anglia Advisors, including clients with managed or advised investments, may maintain positions in securities and/or asset classes mentioned in this post.
If you enjoyed this post, why not share it with someone?


