


Trump and Rubio spent last Saturday teasing that a US/Iran agreement including a re-opening of the Strait of Hormuz was “95% done” and was hours away from being finally announced. Iran quickly denied that anything was imminent and indeed there was nothing substantial to report by the time Asian and European markets opened on Monday, which was a holiday in the US and a number of other countries. Nevertheless, oil prices tumbled and overseas stocks moved higher on the prospect of an end to the conflict.
There was still nothing to report by the time US traders returned to their posts on Tuesday morning. Indeed, Trump had actually ordered renewed air strikes overnight and Israel resumed its assault on civilian targets in both Gaza and Lebanon, all of which stalled gains in Asian and European stock markets.
US stocks initially surged with Big Tech and small caps once again leading the charge and interest rates dived as Wall Street got its first chance to react to the possible progress, taking its cues from still-falling energy prices. Enthusiasm waned as the session wore on, however, with more non-stop war blather but precious little evidence of any deal. The indexes still managed to finish in the green, though.
There were yet more claims and counter-claims of an accord as well as a fountain of confusing rhetoric on Wednesday (including a head-scratching threat from Trump to “blow up” US ally Oman), but jaded traders were tuning it out, viewing the US administration as a bit like the teacher in a Charlie Brown cartoon and finally appear to be stubbornly refusing to engage with all the nonsense in the absence of anything tangible or even vaguely accurate to digest. Stocks inched just a little higher but by enough (you guessed it) to set new all-time records for the major indexes.
The US launched more air strikes overnight into Thursday sending energy prices spinning higher again. Premarket data drops included the latest GDP estimate showing a slightly disappointing 1.6% growth rate and PCE annualized inflation holding steady as expected at 3.8%.
Solid earnings from Best Buy and Dollar Tree indicated that, while Americans are extremely pissed off right now according to record low consumer sentiment data, they just can’t stop spending money. Mostly due to simply following the path of least resistance, stocks drifted higher without too much conviction to complete a sixth straight day of gains and move deeper into record high territory.
The party continued into the last trading day of the month on Friday, fueled in part by Dell whose stock price exploded higher by 33% at the open after blowout earnings and outlook. Despite some late profit-taking, the winning streak for the major indexes remained intact to get to seven straight days with three sessions in a row each resulting in new all-time record highs.
The S&P 500 closed up 6.2% for the month of May and scored its ninth straight week of gains while the NASDAQ completed its best-performing two-month spell since the original Tobey Maguire Spiderman movie was in cinemas back in 2002.
Some other things I’m thinking about ..
The Strait of Hormuz has been closed for three months now. Over that time the S&P 500 is up ~10% and the NASDAQ by ~20%. Stocks are being driven by a tug-of-war between geopolitics, oil prices, interest rates and a powerful earnings and AI narrative, but all with a highly asymmetric “glass is half full” bias, leading to a current market environment where good news is great news, no news is good news and even bad news is kind of okay.
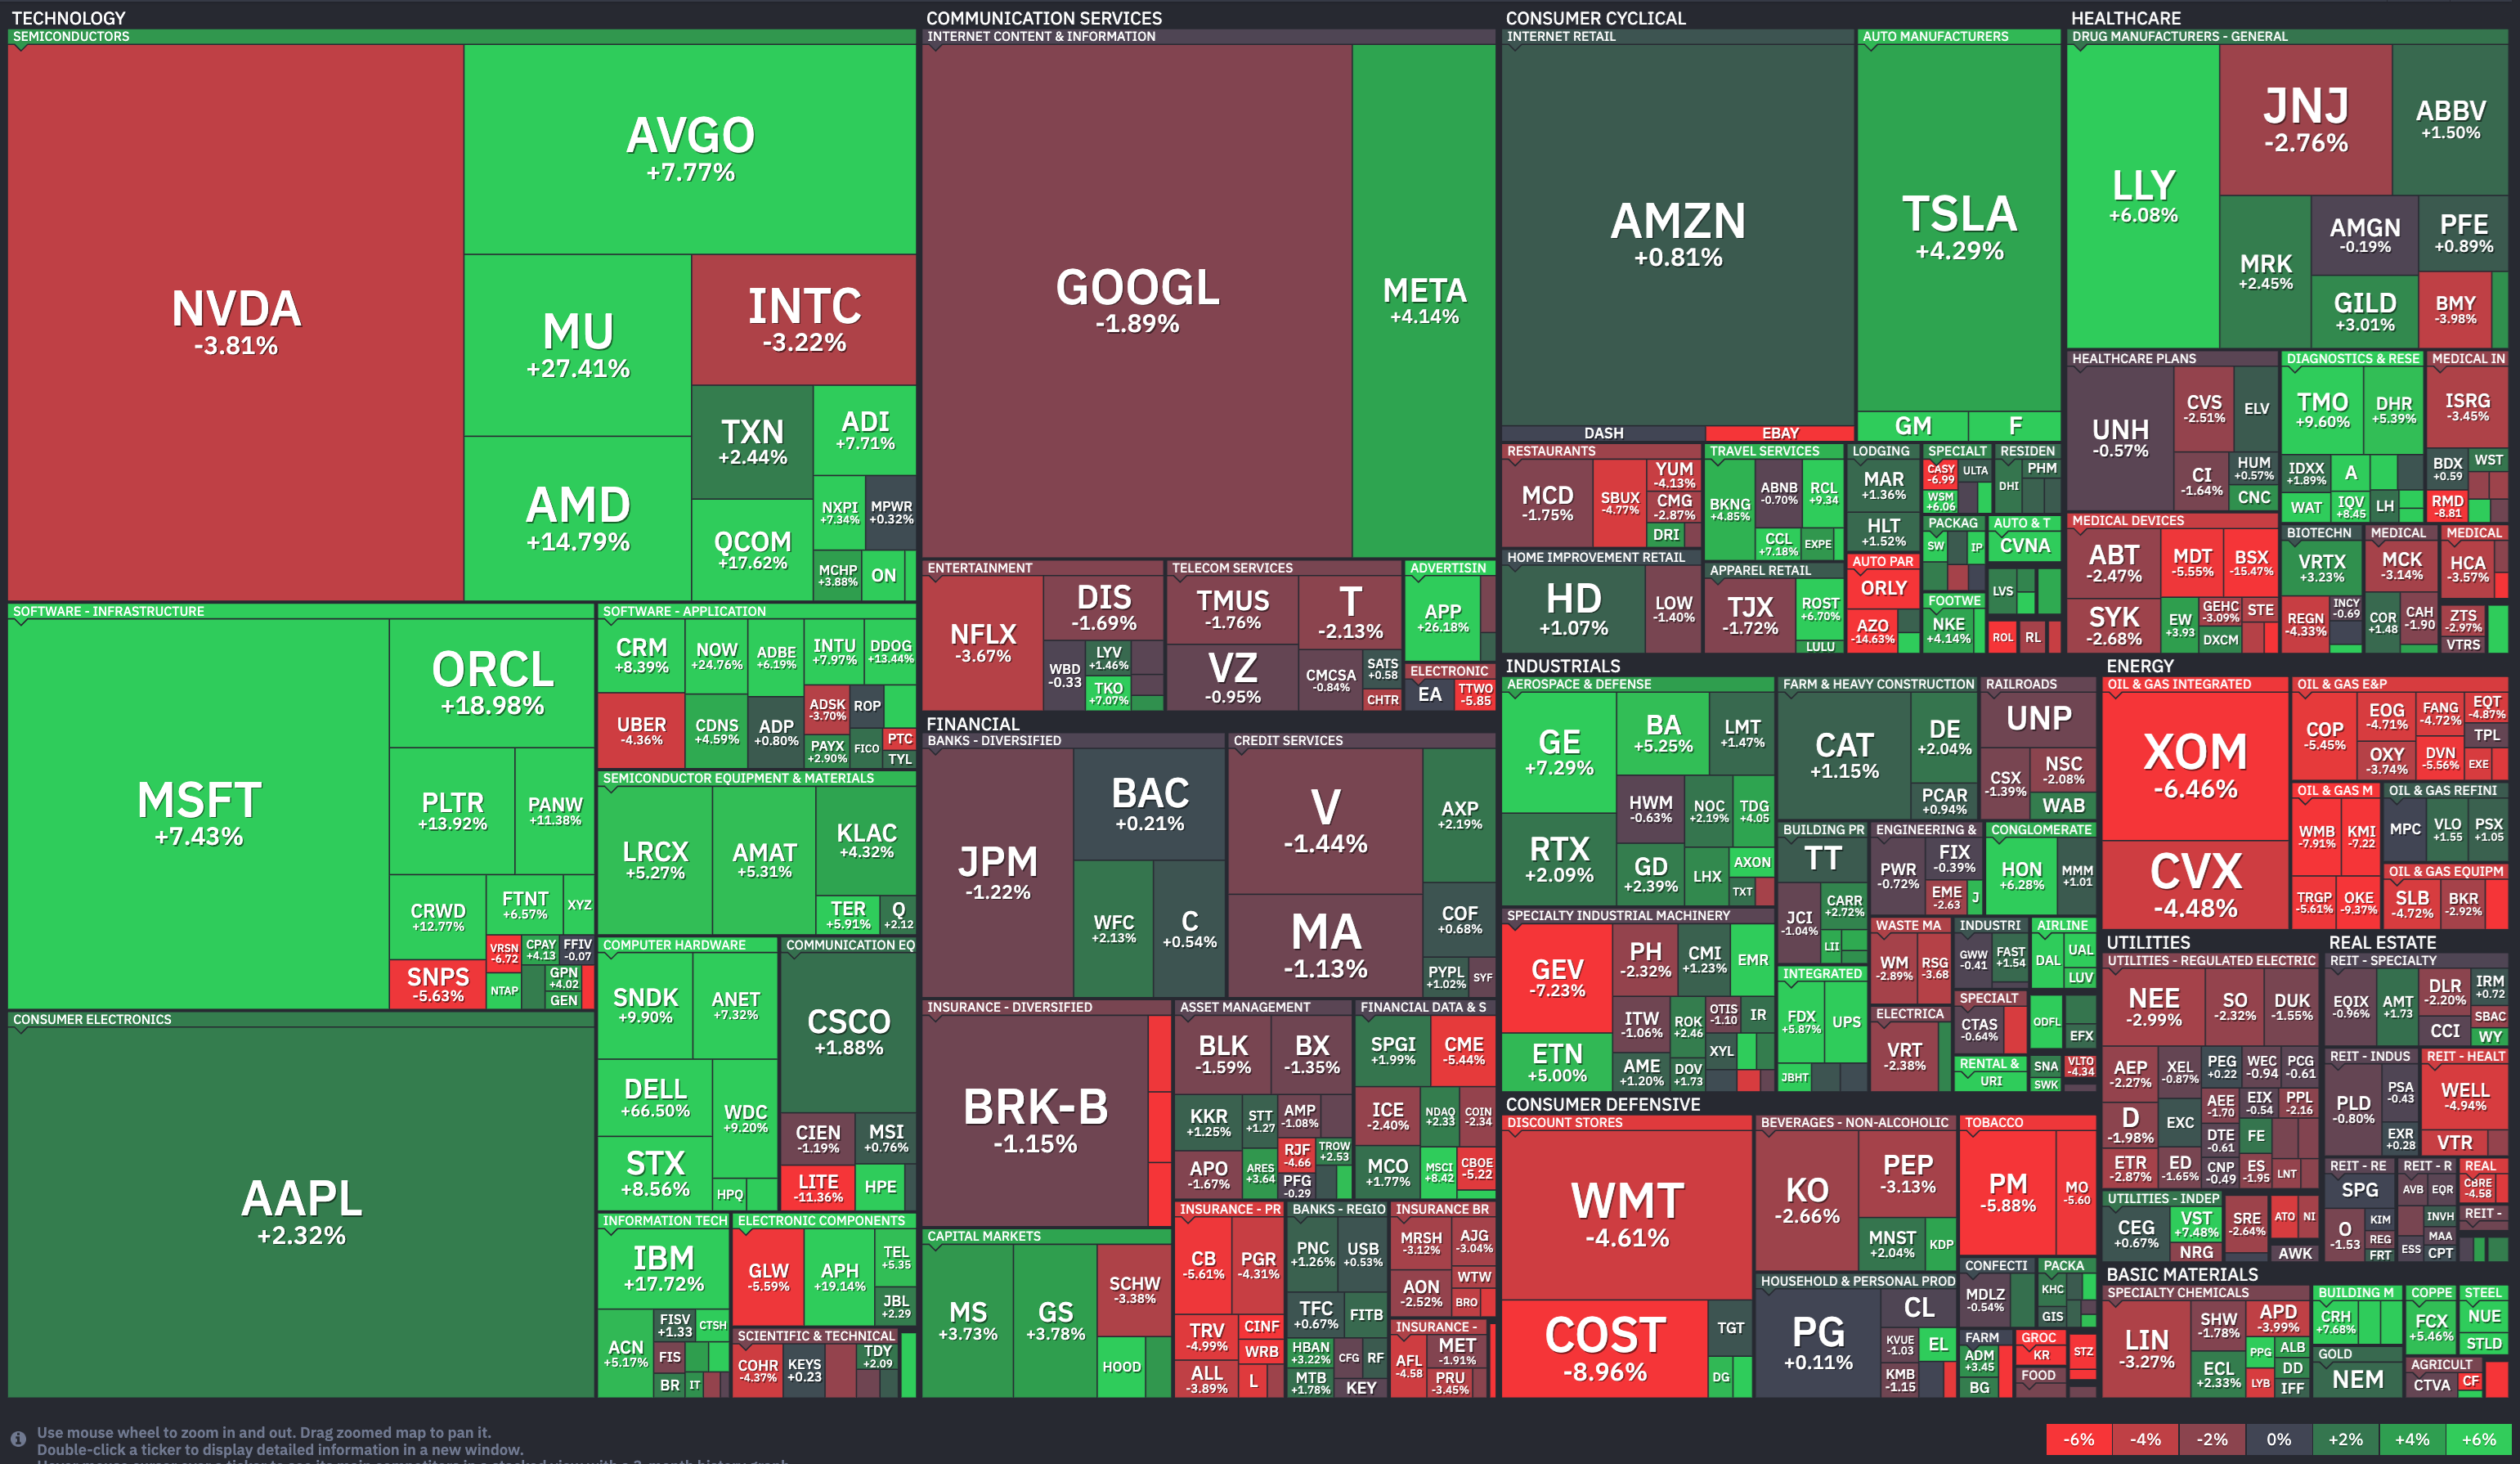
The face-ripping run of Micron, with the stock price up over 850% in the last year and doubling in value in just 48 days to above a trillion dollar valuation, is helping to pull the tech sector back to a position of dominance. Of the eleven sectors in the S&P 500, Technology is the only one outperforming the index since the recovery from the lows of early April. This lack of breadth to the most recent rally can be looked at in two ways:
With concern - as the gains are highly concentrated and a nasty turn in the sector or even in just a few names would badly impact the indexes
With relish - at the prospect of the rest of the sectors catching up with the index’s spectacular tech leadership.
If you are not yet a financial planning or investment management client of Anglia Advisors and would like to explore becoming one, please feel free to reach out to arrange a complimentary no-obligation discovery call with me.
ARTICLE OF THE WEEK ..
Homeowners’ insurance premiums and deductibles are soaring all over the country. The insurance companies tell us that their policies provide financial peace of mind, but almost half the time they will refuse to pay out on your claim.
.. AND I QUOTE ..
“Stocks are priced for perfection in an imperfect world.”
Emily Roland, JH Investment Management co-chief investment strategist
LAST WEEK BY THE NUMBERS:
Last week’s S&P 500 market color courtesy of finviz.com
SPY, a US Large Cap ETF, tracks the S&P 500 index, made up of 500 stocks from a universe of the largest US companies. Its price rose 0.7% last week, is higher by 10.6% over the last three months and is up 11.2% so far this year.
IWM, a US Small Cap ETF, tracks the Russell 2000 index, made up of the bottom two-thirds in terms of company size of a universe of 3,000 of the largest US stocks. Its price rose 0.6% last week, is higher by 11.3% over the last three months and is up 18.2% so far this year.
VXUS, an International Non-US ETF, tracks the MSCI ACWI Ex-US index, made up of over 8,500 of the largest names from a universe of stocks issued by companies from around the world excluding the United States, in both developed and emerging markets. Its price rose 0.5% last week, is higher by 2.8% over the last three months and is up 14.2% so far this year.
Data shown is total return (including dividends)
INTEREST RATES:
FED FUNDS RATE * 3.625% (unchanged from a week ago)
PRIME RATE ** 6.75% (unchanged from a week ago)
3 MONTH TREASURY 3.69% (3.68% a week ago)
2 YEAR TREASURY 3.98% (4.13% a week ago)
5 YEAR TREASURY 4.13% (4.27% a week ago)
10 YEAR TREASURY *** 4.45% (4.56% a week ago)
20 YEAR TREASURY 4.98% (5.06% a week ago)
30 YEAR TREASURY 4.99% (5.07% a week ago)
Data courtesy of the Federal Reserve and the Department of the Treasury as of Friday’s market close.
* Decided upon by the Federal Reserve Open Market Committee at periodic meetings 8x a year. Used as a basis for overnight interbank loans and for determining high yield savings interest rates.
** Wall Street Journal Prime Rate as of Friday’s close. Tending to move in lockstep with the Fed Funds Rate, this measure is used as a basis for determining certain consumer loan interest rates such as credit cards, auto loans, personal loans, home equity loans/lines of credit and securities-based lending.
*** Used as a basis for determining mortgage interest rates.
AVERAGE 30-YEAR FIXED MORTGAGE RATE:
6.53%
One week ago: 6.51%, one month ago: 6.29%, one year ago: 6.89%
Data courtesy of the Federal Reserve Bank of St. Louis.
INTEREST RATE EXPECTATIONS:
Where will the Fed Funds interest rate be after the next rate-setting meeting on June 17th?
0.25% higher than now .. 0% probability (0% a week ago)
Unchanged from now .. 99% probability (99% a week ago)
0.25% lower than now .. 1% probability (1% a week ago)
With five more rate-setting meetings this year, what is the most commonly-expected number of remaining Fed Funds interest rate changes in 2026?
No change (a week ago: one raise)
Data courtesy of the CME FedWatch Tool and is derived from futures market pricing as of Friday’s market close based on the current Fed Funds interest rate of 3.625%.
PERCENT OF S&P 500 STOCKS ABOVE THEIR OWN 200-DAY MOVING AVERAGE:
55%
One week ago: 57%, one month ago: 50%, one year ago: 42%
Data courtesy of barchart.com as of Friday’s market close.
This widely-used technical measure of market breadth is considered to be a very robust indicator of the overall health of the S&P 500 index.
A high percentage (above 70%) generally suggests broad market strength and a bullish trend, while a low percentage (below 30%) may indicate market weakness and a bearish trend.
FEAR & GREED INDEX:
“Be fearful when others are greedy and be greedy when others are fearful.” Warren Buffett.
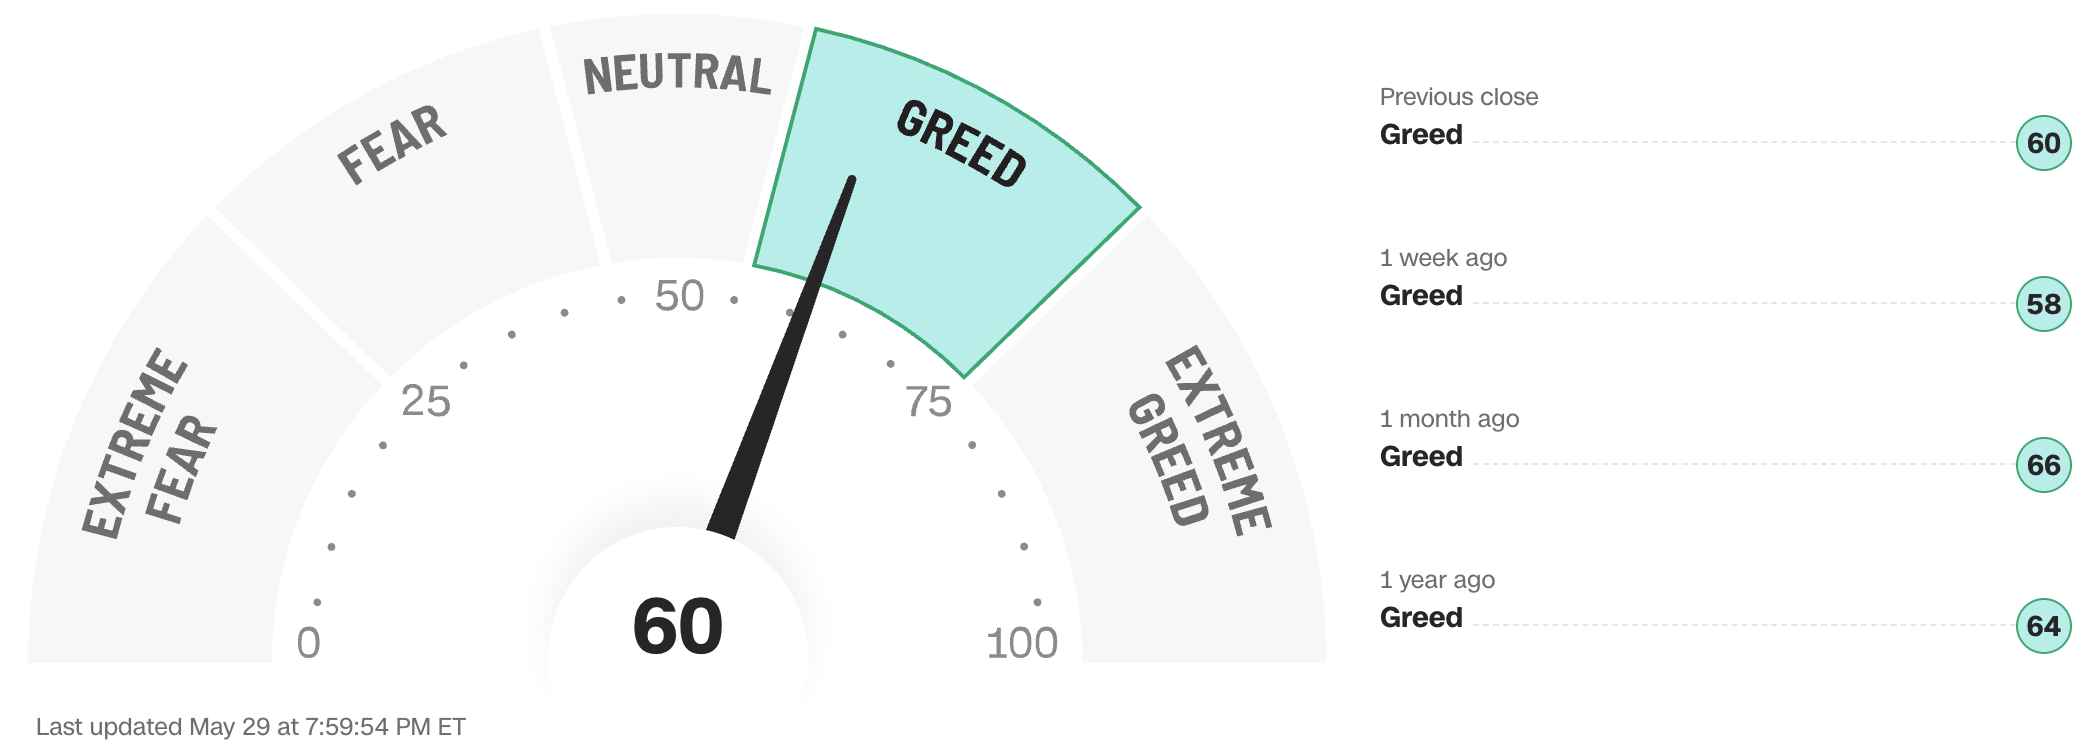
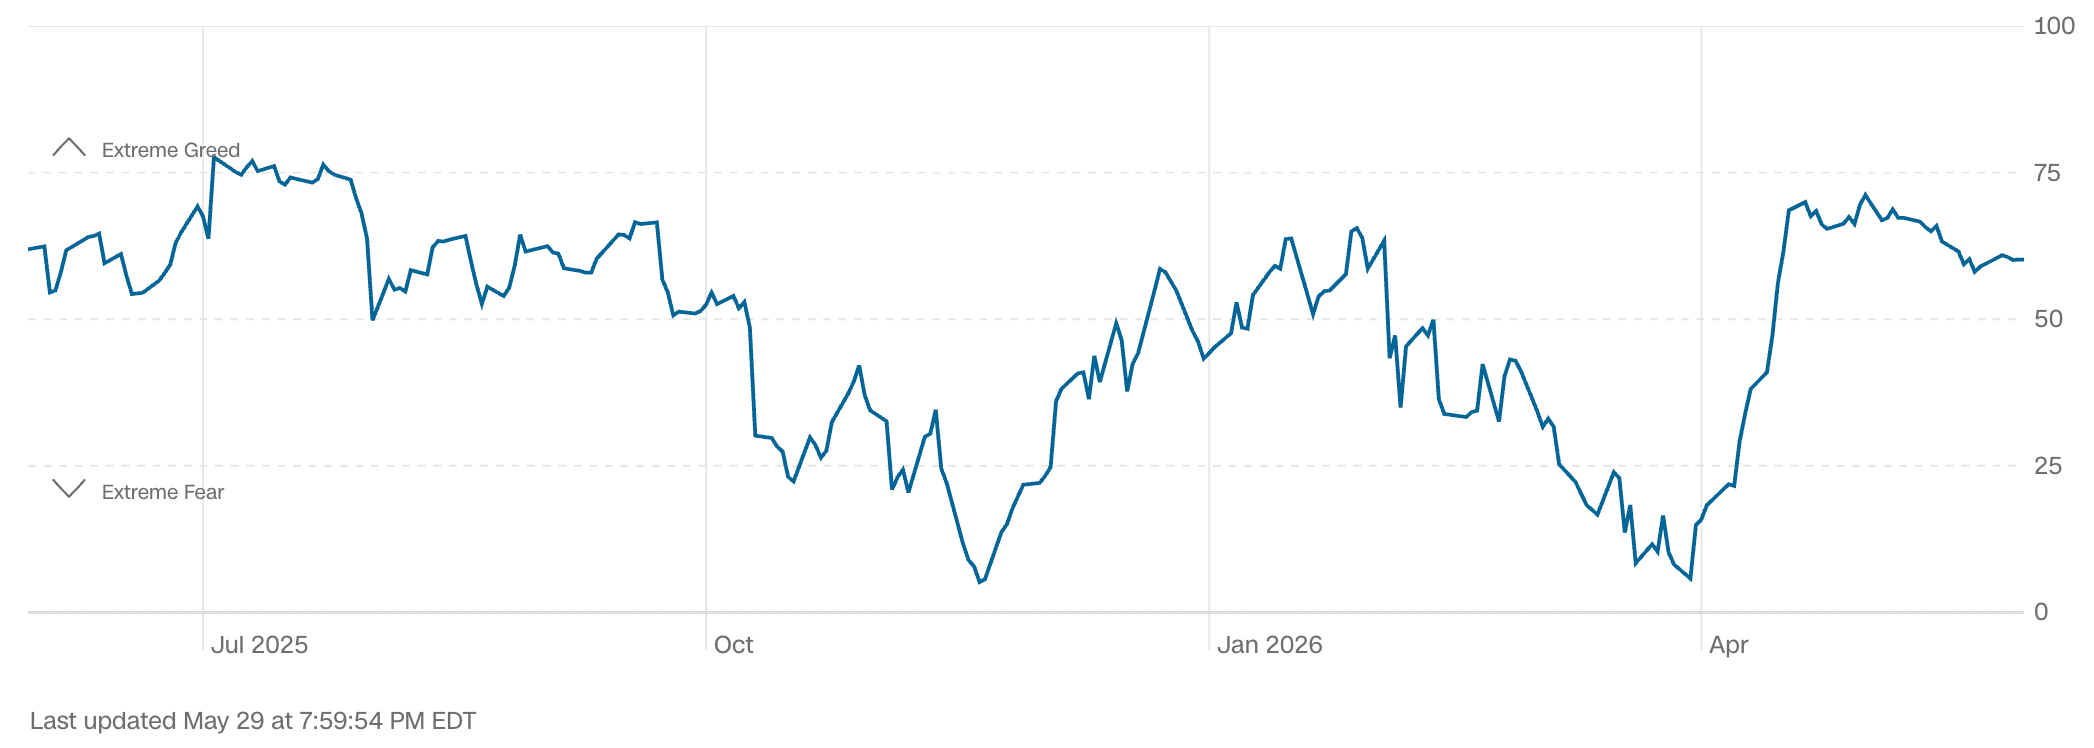
Data courtesy of CNN Business as of Friday’s market close.
The Fear & Greed Index from CNN Business can be used as an attempt to gauge whether or not stocks are fairly priced and to determine the mood of the market. It is a compilation of seven of the most important indicators that measure different aspects of stock market behavior. They are: market momentum, stock price strength, stock price breadth, put and call option ratio, junk bond demand, market volatility and safe haven demand.
Extreme Fear readings can lead to potential opportunities as investors may have driven prices “too low” from a possibly excessive risk-off negative sentiment.
Extreme Greed readings can be associated with possibly too-frothy prices and a sense of “FOMO” with investors chasing rallies in an excessively risk-on environment . This overcrowded positioning leaves the market potentially vulnerable to a sharp downward reversal at some point.
WWW.ANGLIAADVISORS.COM | SIMON@ANGLIAADVISORS.COM | CALL OR TEXT: (646) 286 0290 | FOLLOW ANGLIA ADVISORS ON INSTAGRAM


