


A clearly exasperated Trump put out a series of unhinged expletive-ridden social media posts over the weekend threatening the destruction of civilian infrastructure in Iran starting on Tuesday evening which pushed oil prices deeper into triple digits, but there was very little in terms of credible clarity for traders to chew on at the weekend.
A week including some key economic data and the start of Q1 2026 earnings season kicked off quietly on a low-volume Monday session with a temporary pause in the headline roulette and stocks tentatively built on the previous week’s gains in a state of confused optimism ahead of potentially violent two-way volatility from either a brutal US/Israel onslaught or another TACO Tuesday.
In fact, Israel seemingly couldn’t wait to start hitting civilian targets in Iran and jumped the gun on Tuesday morning which pushed up energy prices. Trump, who appears to be treating this whole situation like some tawdry New York real estate transaction characterized by shameless brinkmanship and nasty threats, posted that “a whole civilization will die tonight”.
A sense of unease settled on Wall Street. Stock prices sank and interest rates drifted higher as the deadline grew closer. However, there was a late-session recovery on the back of rumors of some kind of diplomatic breakthrough brokered by Pakistan and the indexes closed unchanged on the day.
After the close, Trump capitulated, announcing a two-week suspension of all strikes on Iran, improbably claiming that the US had “already met and exceeded all military objectives”. In return, Iran agreed to conditionally re-open the Strait of Hormuz for the two-week period (but still charging crypto tolls to any traffic) and bilateral talks were set for the weekend in Pakistan.
As both sides desperately tried to spin the narrative as a win including undisguised victory laps with “mission accomplished” rhetoric from both Trump and Hegseth, traders scrambled frantically to re-price risk assets in the wake of the announcement. Oil prices crashed by the most since early COVID, interest rates tumbled and stock markets around the world absolutely skyrocketed in Asia and Europe for their biggest one-day gains in years.
When Wall Street opened on Wednesday, its comeback was a little less spectacular, but it was still a very strong day for the stock indexes. While it was unclear how long it would last, traders treated themselves to at least a day of euphoric relief. Some Q1 earnings began to trickle in and were mostly positive ahead of the banks kicking off the season in earnest this week.
After Wednesday’s massive dopamine hit, the jubilation subsided across global markets on Thursday with accusations already flying that terms were being violated and the Strait of Hormuz still basically closed.
Oil prices and interest rates bounced back higher overnight and international stocks fell. The latest PCE numbers and the most recent Q1 GDP estimate were published ahead of the US opening bell, showing sticky inflation, consumer spending stalling and a declining rate of economic growth. However, reports that Israel and Lebanon were planning direct ceasefire talks helped to reverse early losses on Wall Street and the indexes closed with light gains.
The late rebound followed through into Asian and European markets on Friday. Wall Street got to see the latest CPI data which saw inflation shoot up to an annualized rate of 3.3%. The month-to-month jump was the biggest since 2022, but over three-quarters of it was down to war-related energy price increases.
Wall Street chose to look through the hopefully-transitory oil price effect and stocks made further incremental gains when markets opened as traders marginally added to bets that the Fed may still cut the Fed Funds Rate at least once this year. This was despite the fact that Americans are feeling miserable right now with the monthly measure of Consumer Sentiment collapsing to the lowest level in history.
Trader reluctance to go into yet another highly unpredictable high stakes weekend with meaningful long positions caused prices to ease back to unchanged by the close and the indexes’ best week for months came to a relatively quiet end.
Markets are quite heavily banking on the war being in the rear view mirror relatively soon with a noticeable improvement in Strait of Hormuz traffic, even if not back to pre-conflict levels for a while. Whether tolls are going to be charged and exactly to whom they will be paid doesn’t matter much to traders who feel they can probably live with $80-$90 oil for a while.
Confirmation of this scenario will likely see a continuation of last week’s solid rally but in the case that everything goes to shit (possibly as early as this weekend), this rather asymmetric view of things means that renewed significant falls in stock prices are far from off the table if oil prices get back into the $110-$150 range or higher.
If you are not yet a financial planning or investment management client of Anglia Advisors and would like to explore becoming one, please feel free to reach out to arrange a complimentary no-obligation discovery call with me.
ARTICLE OF THE WEEK ..
Your brain is buggy software, badly infected with recency bias when it comes investing. Learn to zoom out.
.. AND I QUOTE ..
“We won’t applaud those who set the world on fire just because they turn up with a bucket.”
Spanish Prime Minister Pedro Sanchez refuses to fully endorse the ceasefire.
LAST WEEK BY THE NUMBERS:
Last week’s S&P 500 market color courtesy of finviz.com
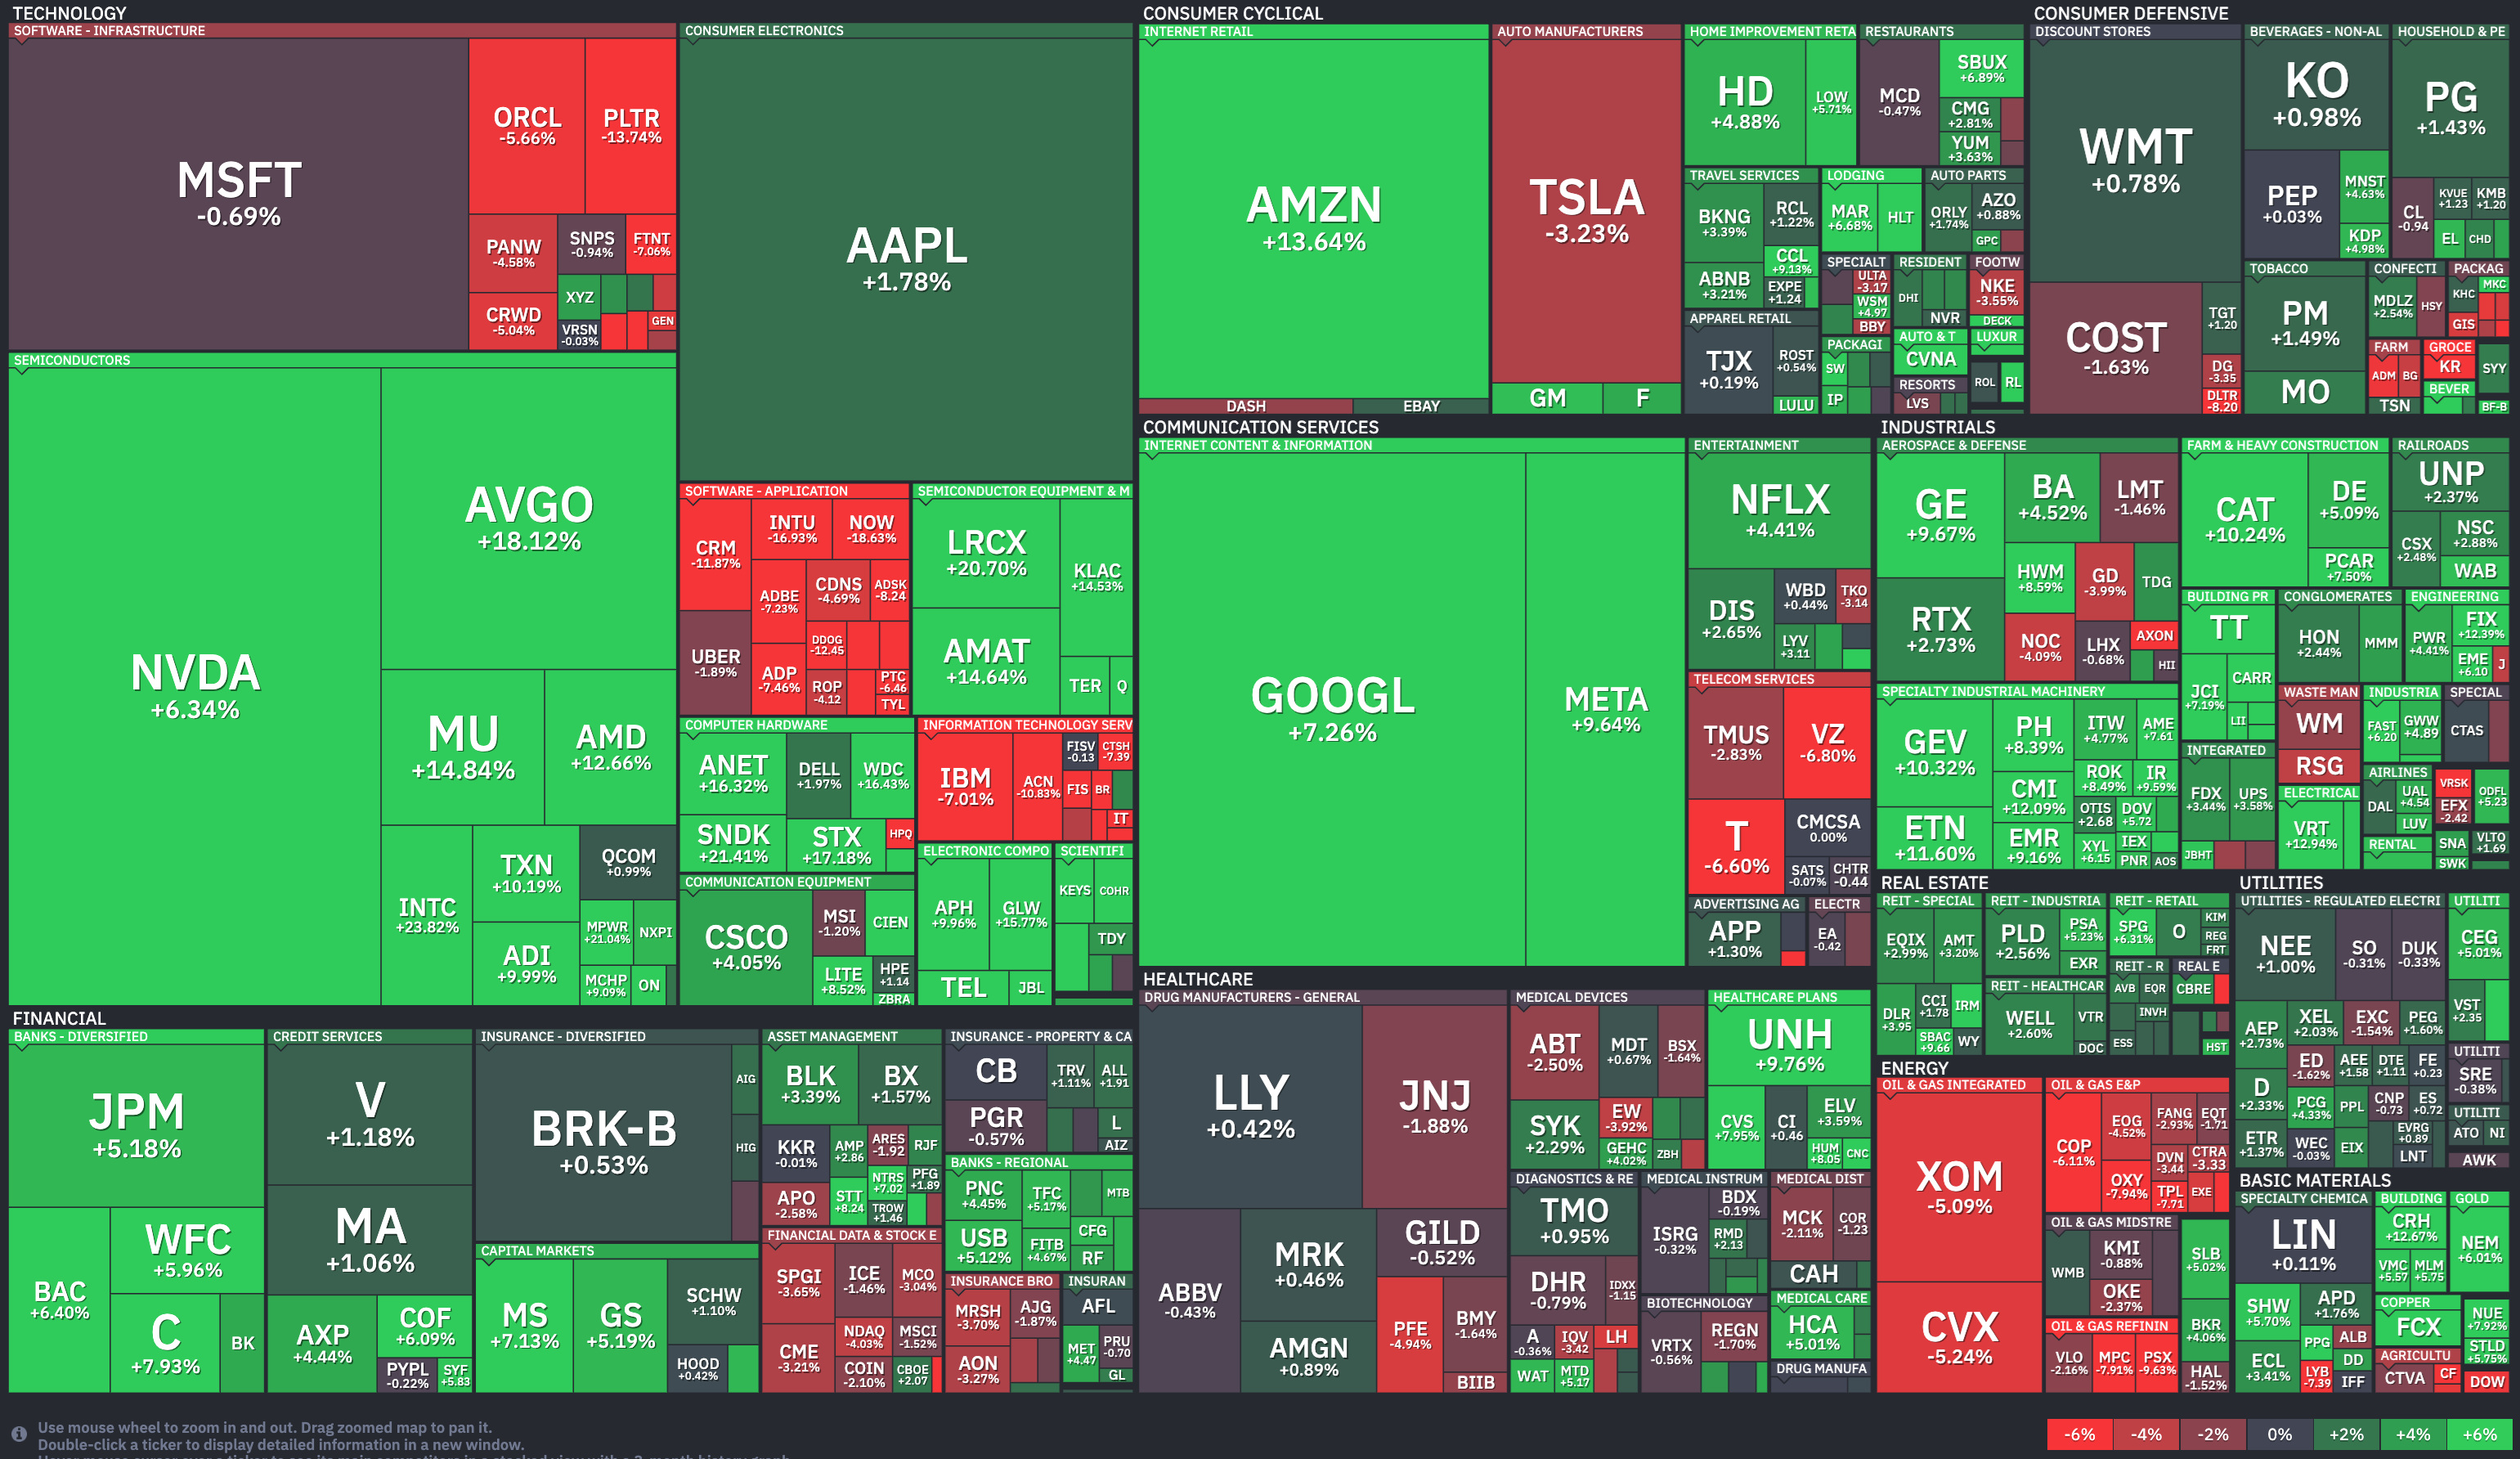
Last week’s best performing US sector: Technology (two biggest holdings: Welltower, Prologis) ⬆︎ 4.9% for the week
Last week’s worst performing US sector: Energy (two biggest holdings: Exxon-Mobil, Chevron) for the second week in a row ⬇︎ 3.9% for the week
SPY, a US Large Cap ETF, tracks the S&P 500 index, made up of 500 stocks from a universe of the largest US companies. Its price rose 3.6% last week, is down 0.4% so far this year and ended the week 2.6% below its all-time record closing high (01/27/2026).
IWM, a US Small Cap ETF, tracks the Russell 2000 index, made up of the bottom two-thirds in terms of company size of a universe of 3,000 of the largest US stocks. Its price rose 4.0% last week, is up 6.2% so far this year and ended the week 3.8% below its all-time record closing high (01/22/2026).
VXUS, a Global Non-US ETF, tracks the MSCI ACWI Ex-US index, made up of over 8,500 of the largest names from a universe of stocks issued by companies from around the world excluding the United States, in both developed and emerging markets. Its price rose 4.9% last week, is up 5.7% so far this year and ended the week 3.6% below its all-time record closing high (02/25/2026).
INTEREST RATES:
FED FUNDS RATE * ⬌ 3.625% (unchanged from a week ago)
PRIME RATE ** ⬌ 6.75% (unchanged from a week ago)
3 MONTH TREASURY ⬇︎ 3.69% (3.70% a week ago)
2 YEAR TREASURY ⬆︎ 3.81% (3.79% a week ago)
5 YEAR TREASURY ⬌ 3.94% (3.94% a week ago)
10 YEAR TREASURY *** ⬌ 4.31% (4.31% a week ago)
20 YEAR TREASURY ⬆︎ 4.89% (4.88% a week ago)
30 YEAR TREASURY ⬆︎ 4.91% (4.88% a week ago)
Data courtesy of the Federal Reserve and the Department of the Treasury as of the market close on Friday
* Decided upon by the Federal Reserve Open Market Committee at periodic meetings 8x a year. Used as a basis for overnight interbank loans and for determining high yield savings interest rates.
** Wall Street Journal Prime Rate as of Friday’s close. Tending to move in lockstep with the Fed Funds Rate, this measure is used as a basis for determining certain consumer loan interest rates such as credit cards, auto loans, personal loans, home equity loans/lines of credit and securities-based lending.
*** Used as a basis for determining mortgage interest rates.
AVERAGE 30-YEAR FIXED MORTGAGE RATE:
⬇︎ 6.37%
One week ago: 6.46%, one month ago: 6.07%, one year ago: 6.62%
Data courtesy of the Freddie Mac Primary Mortgage Market Survey
INTEREST RATE EXPECTATIONS:
Where will the Fed Funds interest rate be after the next rate-setting meeting on April 29th?
0.25% higher than now .. ⬆︎ 2% probability (0% a week ago)
Unchanged from now .. ⬇︎ 98% probability (99% a week ago)
0.25% lower than now .. ⬇︎ 0% probability (1% a week ago)
With six more rate-setting meetings in 2026, what is the most commonly-expected number of remaining 0.25% Fed Funds interest rate cuts this year?
⬌ Zero (unchanged from a week ago)
Data courtesy of CME FedWatch Tool as of the market close on Friday.
All data based on the Fed Funds interest rate (currently 3.625%).
PERCENT OF S&P 500 STOCKS ABOVE THEIR OWN 200-DAY MOVING AVERAGE:
⬆︎ 53%
One week ago: 48%, one month ago: 53%, one year ago: 39%
Data courtesy of MacroMicro as of Friday’s market close
This widely-used technical measure of market breadth is considered to be a very robust indicator of the overall health of the S&P 500 index.
A high percentage (above 70%) generally suggests broad market strength and a bullish trend, while a low percentage (below 30%) may indicate market weakness and a bearish trend.
FEAR & GREED INDEX:
“Be fearful when others are greedy and be greedy when others are fearful.” Warren Buffett.
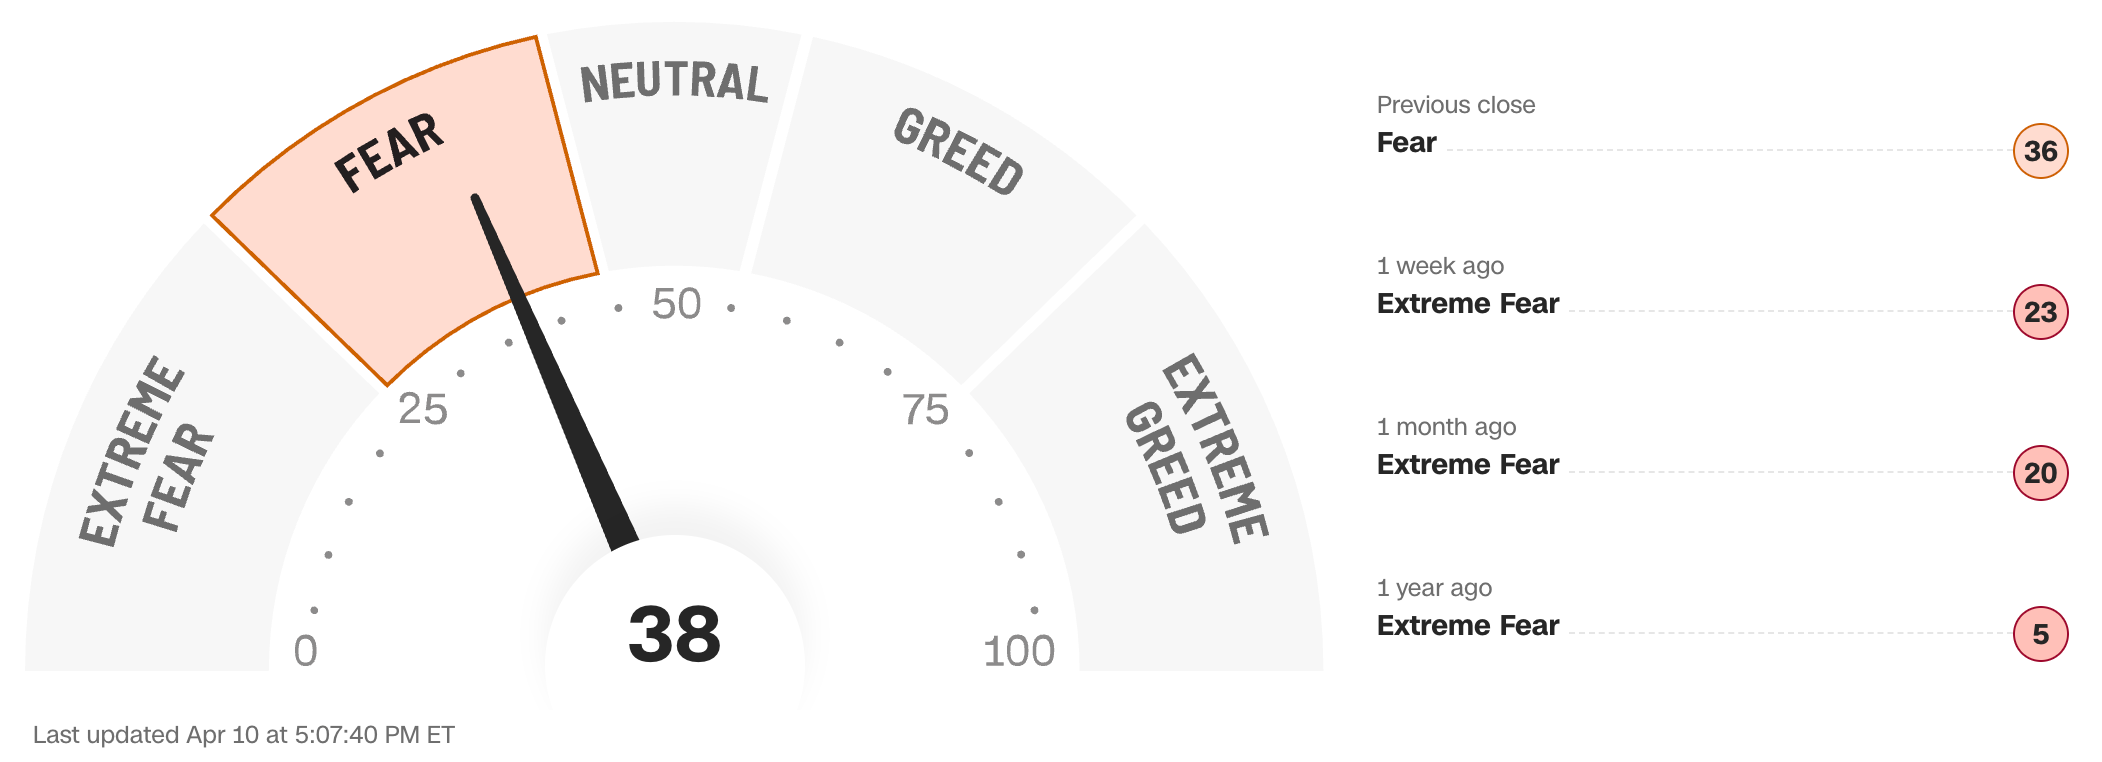
Data courtesy of CNN Business as of Friday’s market close
The Fear & Greed Index from CNN Business can be used as an attempt to gauge whether or not stocks are fairly priced and to determine the mood of the market. It is a compilation of seven of the most important indicators that measure different aspects of stock market behavior. They are: market momentum, stock price strength, stock price breadth, put and call option ratio, junk bond demand, market volatility and safe haven demand.
Extreme Fear readings can lead to potential opportunities as investors may have driven prices “too low” from a possibly excessive risk-off negative sentiment.
Extreme Greed readings can be associated with possibly too-frothy prices and a sense of “FOMO” with investors chasing rallies in an excessively risk-on environment . This overcrowded positioning leaves the market potentially vulnerable to a sharp downward reversal at some point.
A “sweet spot” is considered to be in the lower-to-mid “Greed” zone.
Anglia Advisors recently updated its Privacy Policy. You can view the latest version here.
WWW.ANGLIAADVISORS.COM | SIMON@ANGLIAADVISORS.COM | CALL OR TEXT: (646) 286 0290 | FOLLOW ANGLIA ADVISORS ON INSTAGRAM
This material represents a highly opinionated, speculative assessment of the financial market environment based on assumptions and prevailing information and data at a specific point in time and is always subject to change at any time. Although the content is believed to be correct at the time of publication, no warranty of its accuracy or completeness is ever given. It is never to be interpreted as an attempt to forecast any future events, nor does it offer any kind of guarantee whatsoever of future results, circumstances or outcomes.
The material contained herein is not necessarily complete and is also wholly insufficient to be relied upon as research or investment advice or as a sole basis for any financial determinations, including investment decisions or making any kind of consumer choices, without further consultation with Anglia Advisors or other fully-qualified Registered Investment Advisor. The user assumes the entire risk of any decisions made or actions taken based in whole or in part on any of the information provided in this or any other Anglia Advisors published content.
Under no circumstances is any Anglia Advisors’ content ever intended to constitute tax, legal or medical advice and should never be taken as such. Neither the information contained nor any opinion expressed herein constitutes a solicitation for the purchase of any security or asset class. No formal client advice may be rendered by Anglia Advisors unless and until a properly-executed client engagement agreement is in place.
Posts may contain links or references to third party websites or may post data or graphics from them for the convenience and interest of readers. While Anglia Advisors might have reason to believe in the quality of the content provided on these sites, the firm has no control over, and is not in any way responsible for, the accuracy of such content nor for the security or privacy protocols that external sites may or may not employ. By making use of such links, the user assumes, in its entirety, any kind of risk associated with accessing them or making use of any information provided therein.
Those associated with Anglia Advisors, including clients with managed or advised investments, may maintain positions in securities and/or asset classes mentioned in this post.
If you enjoyed this post, why not share it with someone?


