



“Not a drop of oil will leave the Strait of Hormuz”, according to Iran on Sunday as the so-called “three-week skirmish” approached its five-month anniversary amid daily US airstrikes and zero signs of any resolution.
Stock markets around the world are still considerably higher than they were on the day the conflict formally began back on February 28th, but the oil price spiking back through $90 and the average price at the pump in the US over $4.00 again risked making for a miserable start to the week for global stocks, adding to the persistent jitters about AI overspending (funded in many cases by debt).
Asian and European indexes duly had a rough day on Monday but Wall Street was more upbeat with bargain-hunters gently nibbling early on following the previous week’s chip/semiconductor stock carnage, but they were soon beaten back by inflation doomsayers and the US indexes closed a touch lower.
After hours, Trump threatened a 50% tariff on many Canadian goods under obscure legislation dating back to the 1930s, vaguely citing “discriminatory treatment” of US exports, setting up either a completely unnecessary bust-up with a major trading partner or else yet another pointless TACO episode. The smart money is on the latter.
With a brief pause in the toxic Iran war rhetoric, chip stock dip-buying resumed on Tuesday morning and picked up steam as the day wore on and the indexes all closed nicely in the green.
After taking a day off, Trump issued a barrage of more angry social media threats of violence against Iranians on Wednesday and stocks stumbled out of the gate on the back of relentlessly rocketing energy prices and soaring interest rates. But they later recovered on more of the AI tunnel vision which continues to feed the bulls, with more bottom-fishing ahead of the start of tech earnings to record another solidly positive session.
The main event though was right after the close when Alphabet/Google announced respectable earnings but scary AI spending plans and Tesla badly missed profitability expectations despite a bump in EV sales. The reports spooked after-hours traders and both stocks sank.
When Wall Street opened on Thursday, the bond market sent a clear message of inflation concern, selling off hard again as interest rates jumped across the board, including the impactful 10-year Treasury rising to its highest rate in over eighteen months and the 30-year up to a level not seen in almost twenty years (see INTEREST RATES below).
With no help whatsoever from Alphabet/Google or Tesla, both of which got thoroughly brutalized as punishment for their disappointing reports the night before, stock markets completely broke down as oil prices roared back into triple-digits and the week’s index gains were more than wiped out in one horrible session which resulted in the Mag 7 stocks losing a combined $800 billion in value.
After hours, Intel shattered expectations with a blowout Q2 earnings report but Trump continued raising the temperature, announcing a sweeping new set of tariffs on 60 countries representing 99.4% of US imports. Many of its victims are already formulating their retaliation.
Financial markets seemed unsure how to react on Friday, eventually settling for not doing much. Interest rates paused their rocket ride and stocks drifted aimlessly throughout the session, closing unchanged but on edge ahead of geopolitical uncertainty over the weekend and a monster upcoming week with a kind of live Fed interest rate decision on Wednesday and a truckload of earnings reports including from Microsoft, Meta, Apple, Amazon, Qualcomm, Exxon-Mobil, Chevron and many more.
The downside risk for stocks feels greater now than it has been in some time with high valuations, intensifying war, a rebuild of Trump’s highly damaging tariff wall, spiraling interest rates and a worsening inflation outlook, but there is still a world where mega-cap earnings can possibly come to the rescue.
Some other things I’m thinking about ..
Until somewhat recently, the market’s view of AI spending was “the bigger, the better” as investors embraced the idea that the more the hyperscalers spent on AI, the more of a windfall they’d eventually receive. However, that’s changing, primarily due to two factors; i) the sheer amount of money being thrown at the limited supply of AI equipment has caused the prices of tech components such as semiconductors or memory to skyrocket and ii) these hyperscalers seem to be caught in an arms race, as spending increases by one elicit a “we’re behind” response from others who react by boosting their own expenditure. Investors don’t want to see spending being slashed (that would be bad for everyone), but nor do they want to see such an enormous acceleration either, because that can end up depressing free cash flow at these firms. “Restraint, please” seems to be the message from Wall Street.
Less than a month ago, oil prices seemed poised to fall into the $60’s. By last week they were back above $100, once again threatening to ignite even higher inflation around the world. The job of global central banks is getting harder and harder when it comes to interest rate-setting decisions and the next such test for the Federal Reserve is on deck for this coming Wednesday (see INTEREST RATE EXPECTATIONS below).
If you are not yet a financial planning or investment management client of Anglia Advisors and would like to explore becoming one, please feel free to reach out to arrange a complimentary no-obligation discovery call with me.
ARTICLE OF THE WEEK ..
.. AND I QUOTE ..
“What the market is pricing is a scenario where everything goes right and there are no risks. That is not a bullish picture.”
Sebastian Raedler, Head of European equity strategy, Bank of America
LAST WEEK BY THE NUMBERS:
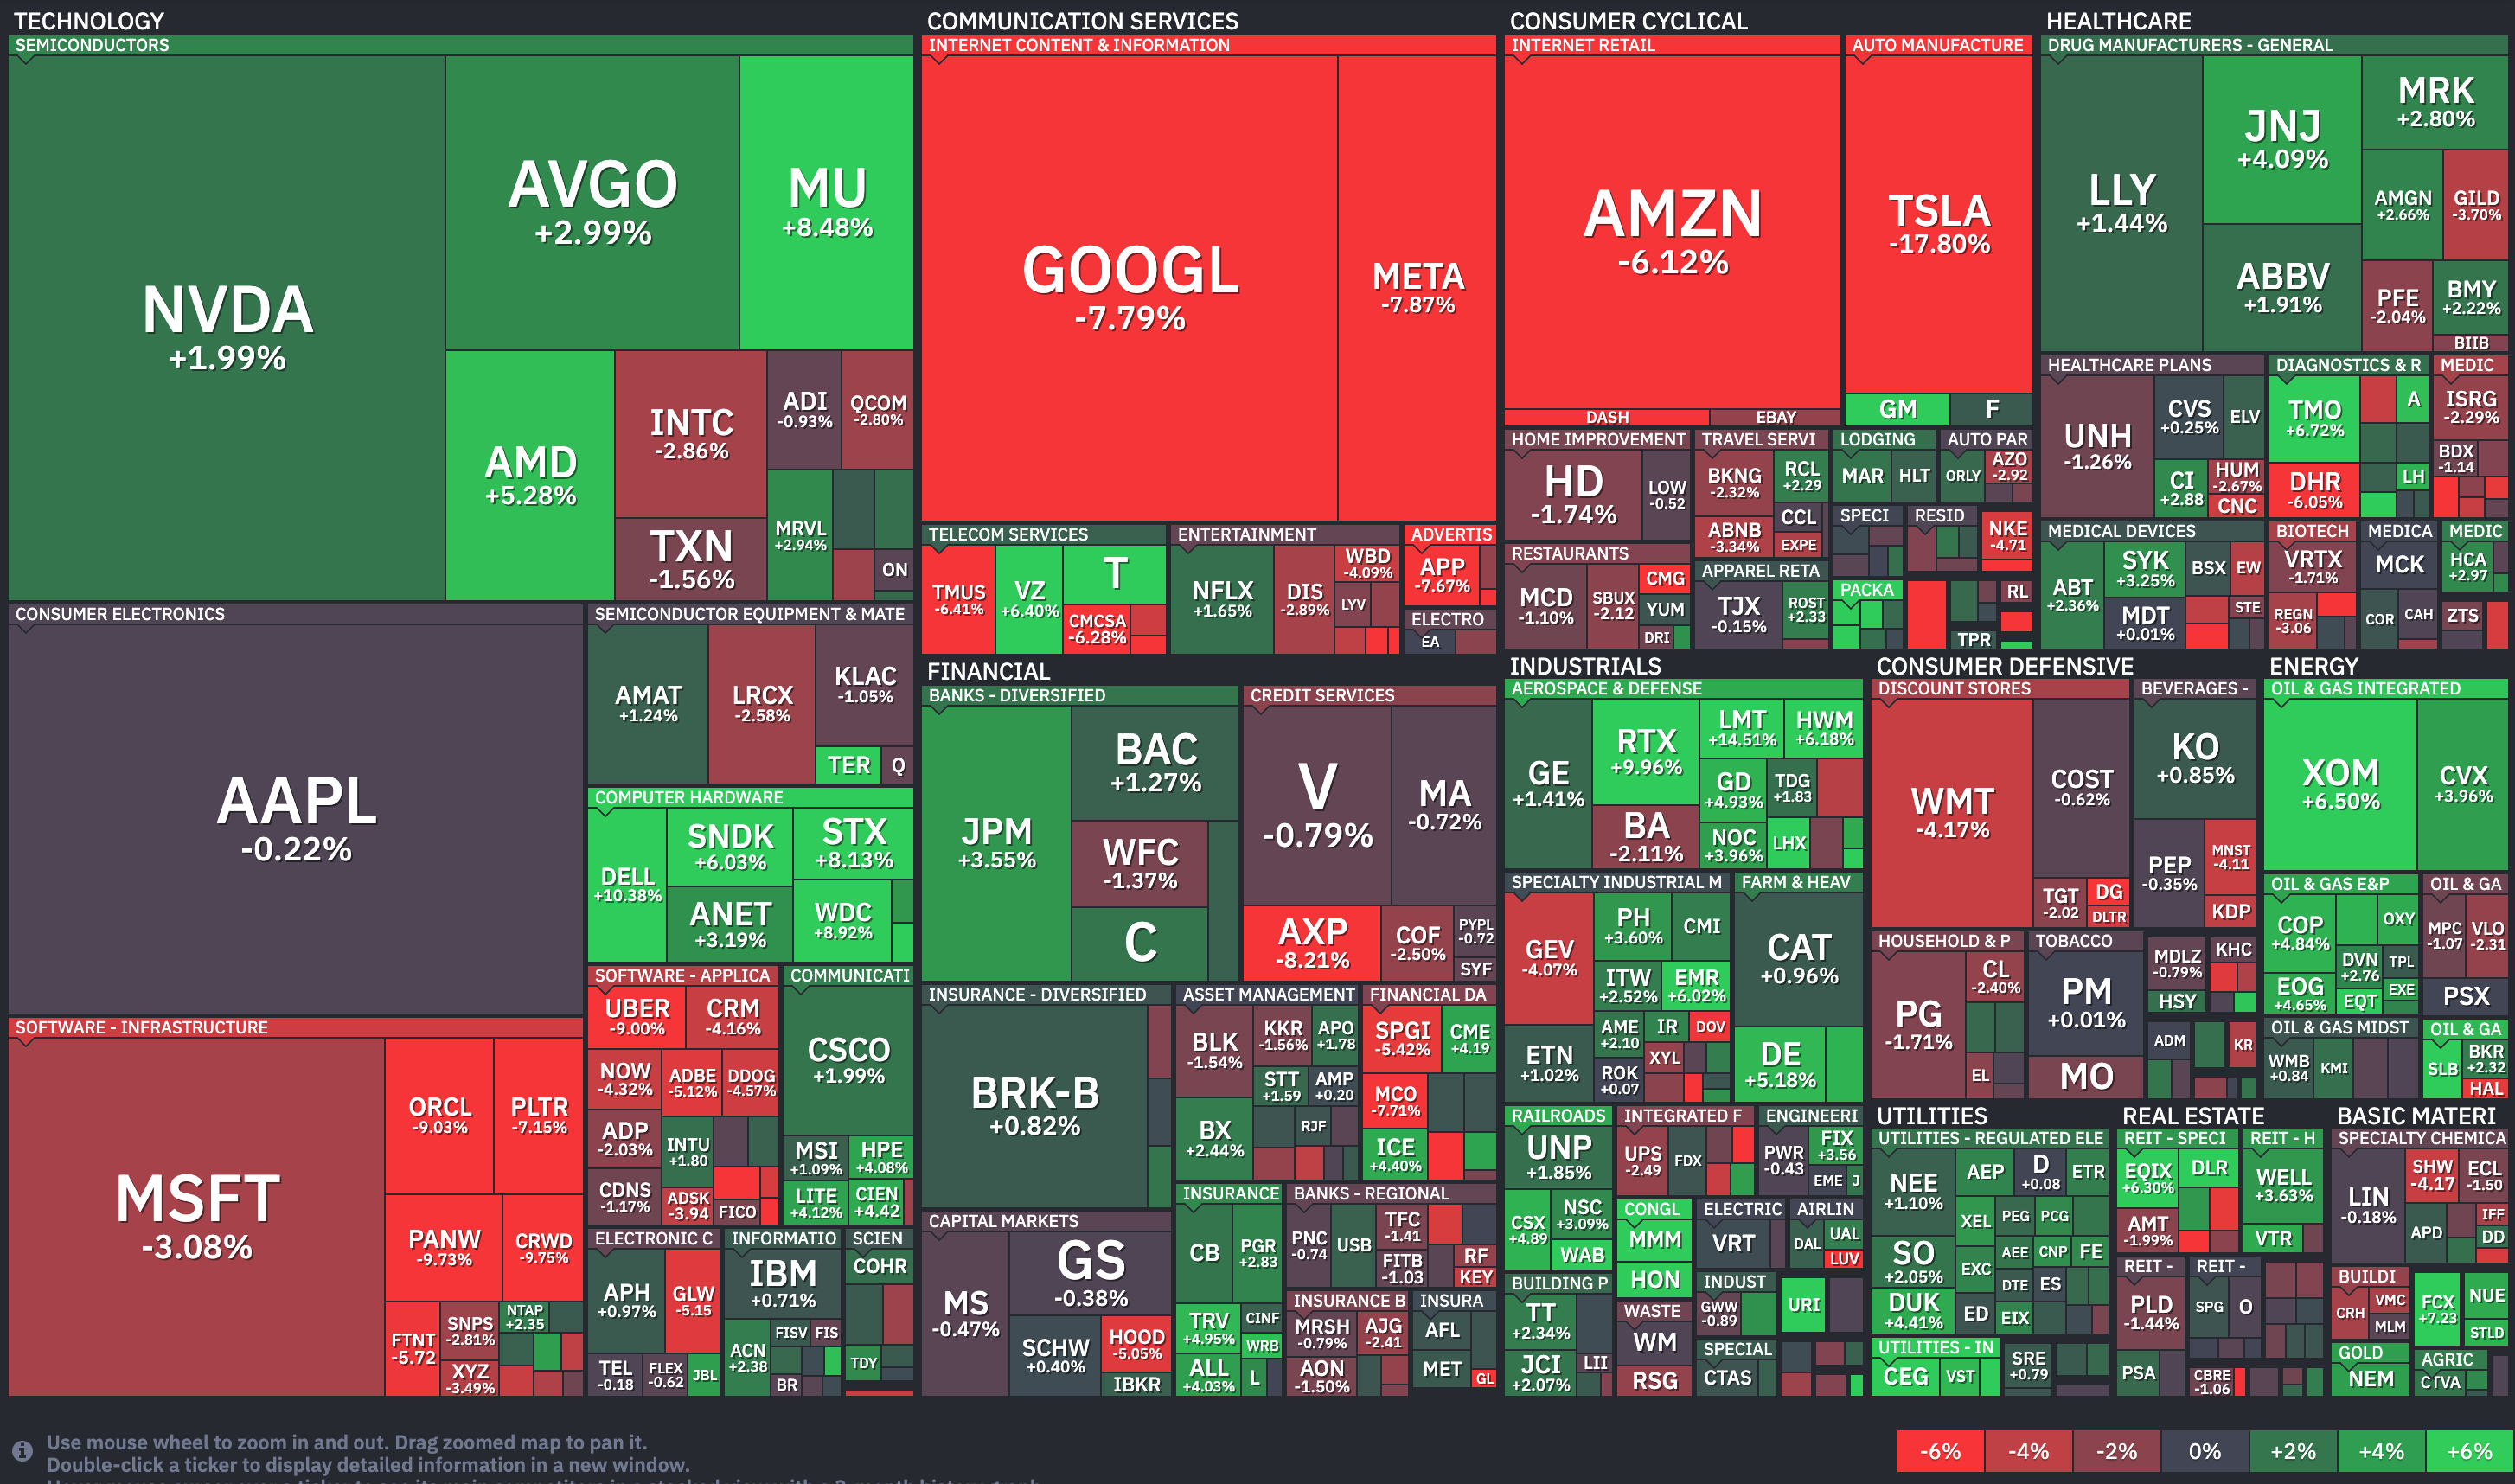
Last week’s S&P 500 market color courtesy of finviz.com
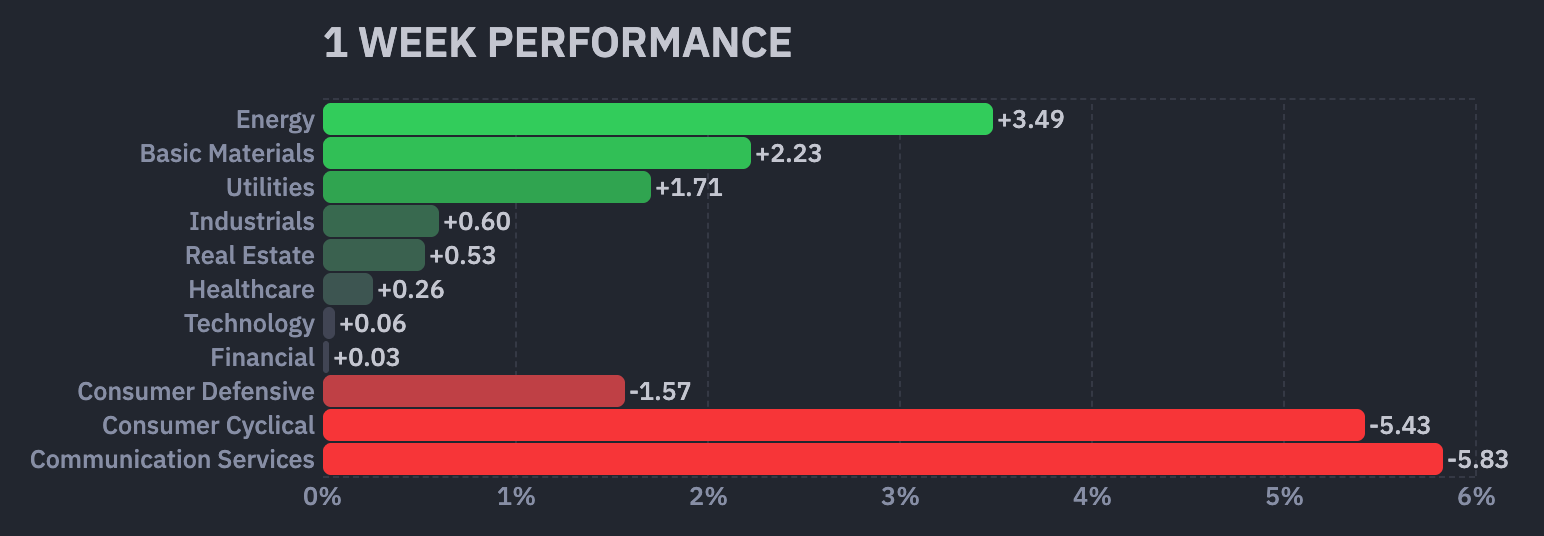
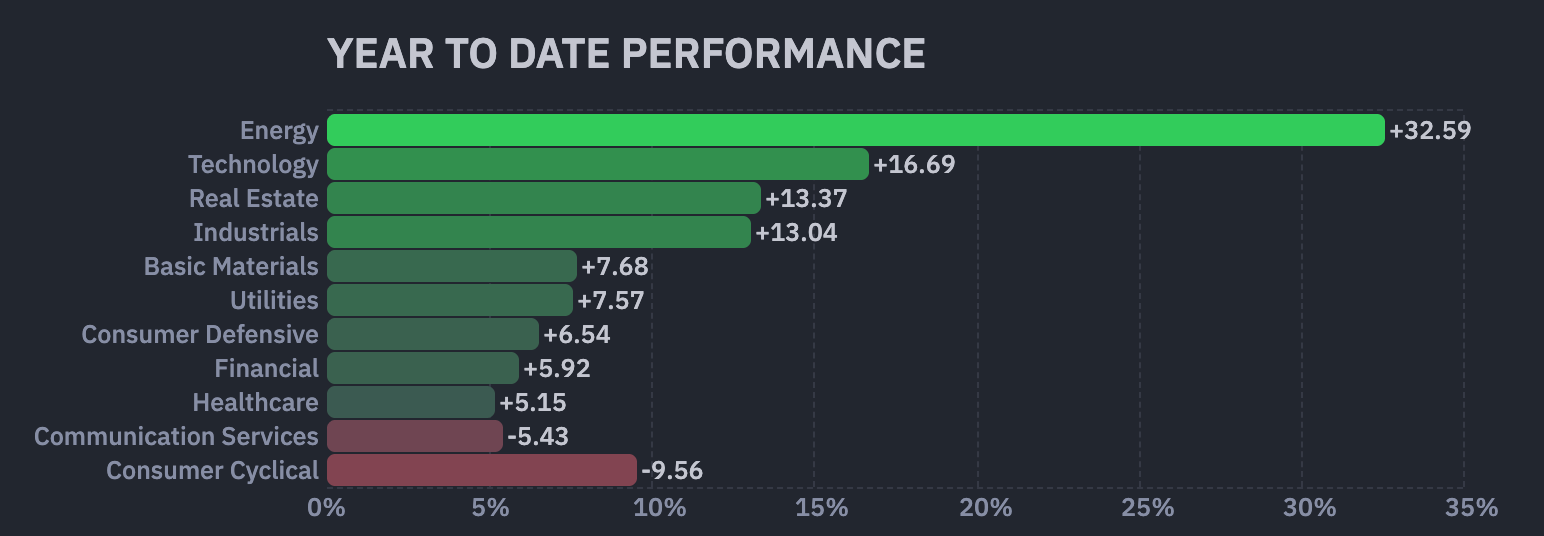
SPY, a US Large Cap ETF, tracks the S&P 500 index, made up of 500 stocks from a universe of the largest US companies. It fell 0.8% last week, is higher by 3.3% over the last three months and is up by 8.2% so far this year.
IWM, a US Small Cap ETF, tracks the Russell 2000 index, made up of the bottom two-thirds in terms of company size of a universe of 3,000 of the largest US stocks. It fell 0.8% last week, is higher by 5.3% over the last three months and is up by 18.4% so far this year.
VXUS, an International Non-US ETF, tracks the MSCI ACWI Ex-US index, made up of over 8,500 of the largest names from a universe of stocks issued by companies from around the world excluding the United States, in both developed and emerging markets. It fell 0.1% last week, is higher by 1.0% over the last three months and is up by 10.5% so far this year.
Data shown is total return (including dividends)
INTEREST RATES:
FED FUNDS RATE * 3.625% (unchanged from a week ago)
PRIME RATE ** 6.75% (unchanged from a week ago)
3 MONTH TREASURY 3.96% (3.85% a week ago)
2 YEAR TREASURY 4.33% (4.18% a week ago)
5 YEAR TREASURY 4.43% (4.28% a week ago)
10 YEAR TREASURY *** 4.69% (4.55% a week ago)
20 YEAR TREASURY 5.18% (5.07% a week ago)
30 YEAR TREASURY 5.16% (5.06% a week ago)
Data courtesy of the Federal Reserve and the Department of the Treasury as of Friday’s market close.
* Decided upon by the Federal Reserve Open Market Committee at periodic meetings 8x a year. Used as a basis for overnight interbank loans and for determining high yield savings interest rates.
** Wall Street Journal Prime Rate as of Friday’s close. Moving in lockstep with the Fed Funds interest rate, this measure is used as a basis for determining certain consumer loan interest rates such as credit cards, auto loans, personal loans, home equity loans/lines of credit and securities-based lending.
*** Used as a basis for determining mortgage interest rates.
AVERAGE 30-YEAR FIXED MORTGAGE RATE:
6.58%
One week ago: 6.55%, one month ago: 6.48%, one year ago: 6.74%
Data courtesy of the Federal Reserve Bank of St. Louis.
INTEREST RATE EXPECTATIONS:
Where will the Fed Funds interest rate be after the next rate-setting meeting on July 29th?
0.25% higher than now .. 38% probability (13% a week ago)
Unchanged from now .. 62% probability (87% a week ago)
0.25% lower than now .. 0% probability (0% a week ago)
With four more rate-setting meetings this year, what is the most commonly-expected number of remaining Fed Funds interest rate changes in 2026?
Two increases, 40% probability (a week ago: one increase, 43% probability)
Data courtesy of the CME FedWatch Tool and is derived from futures market pricing as of Friday’s market close based on the current Fed Funds interest rate of 3.625%.
PERCENT OF S&P 500 STOCKS ABOVE THEIR OWN 200-DAY MOVING AVERAGE:
66%
One week ago: 66%, one month ago: 61%, one year ago: 42%
Data courtesy of barchart.com as of Friday’s market close.
This widely-used technical measure of market breadth is considered to be a very robust indicator of the overall health of the S&P 500 index.
A high percentage (above 70%) generally suggests broad market strength and a bullish trend, while a low percentage (below 30%) may indicate market weakness and a bearish trend.
FEAR & GREED INDEX:
“Be fearful when others are greedy and be greedy when others are fearful.” Warren Buffett.
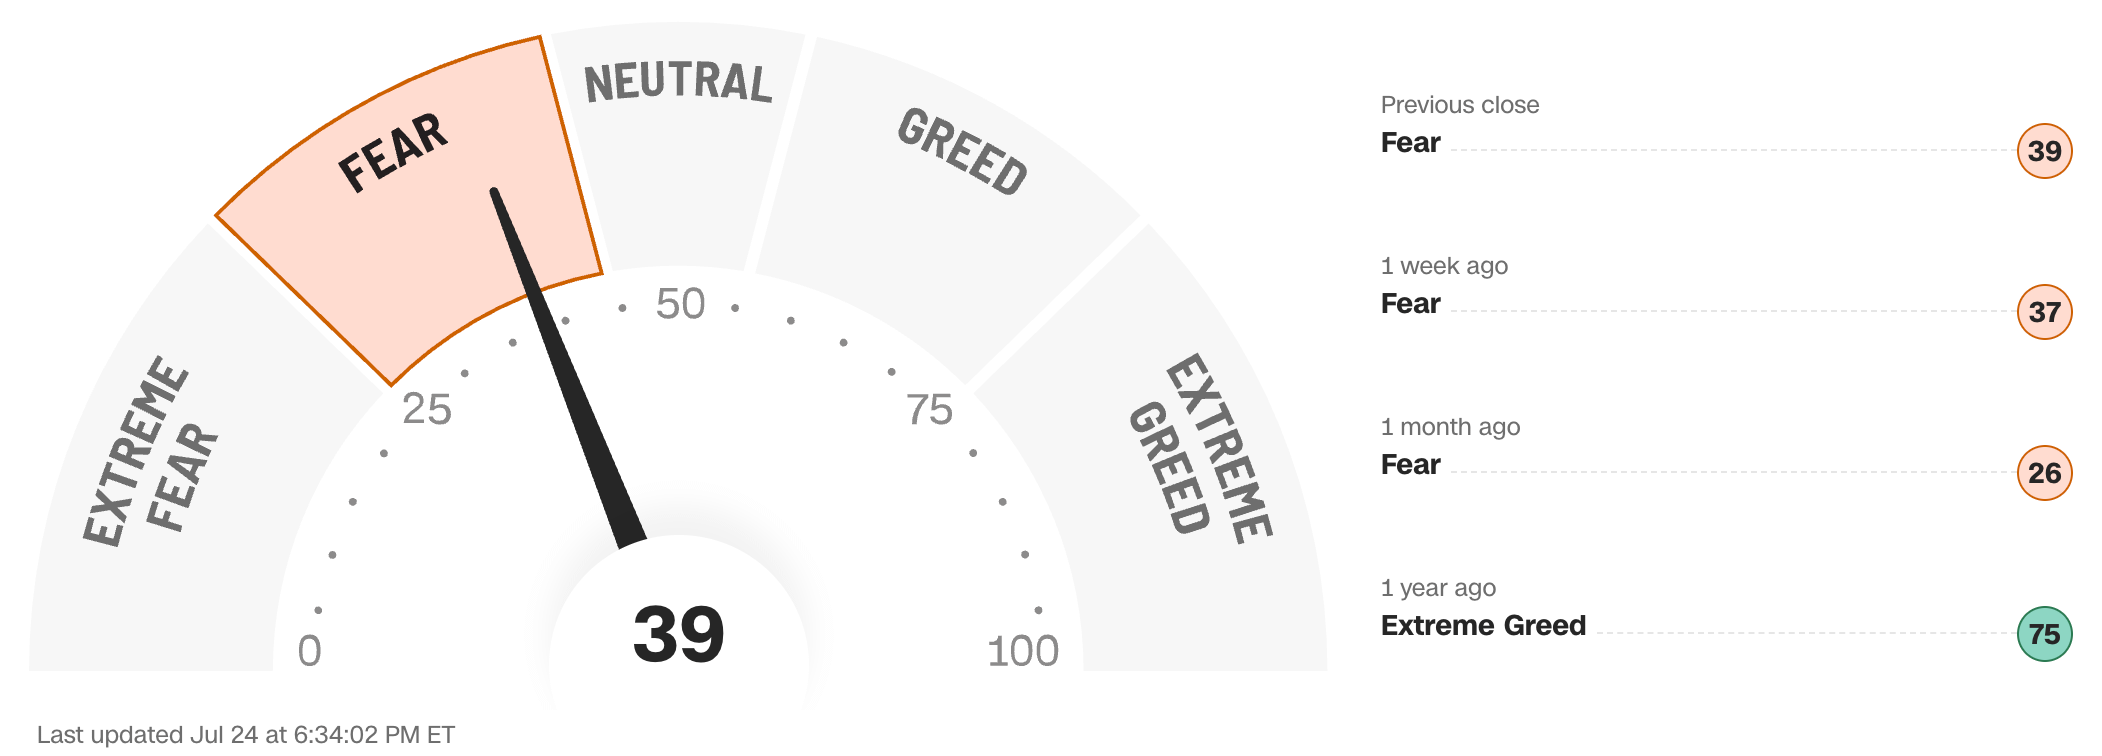
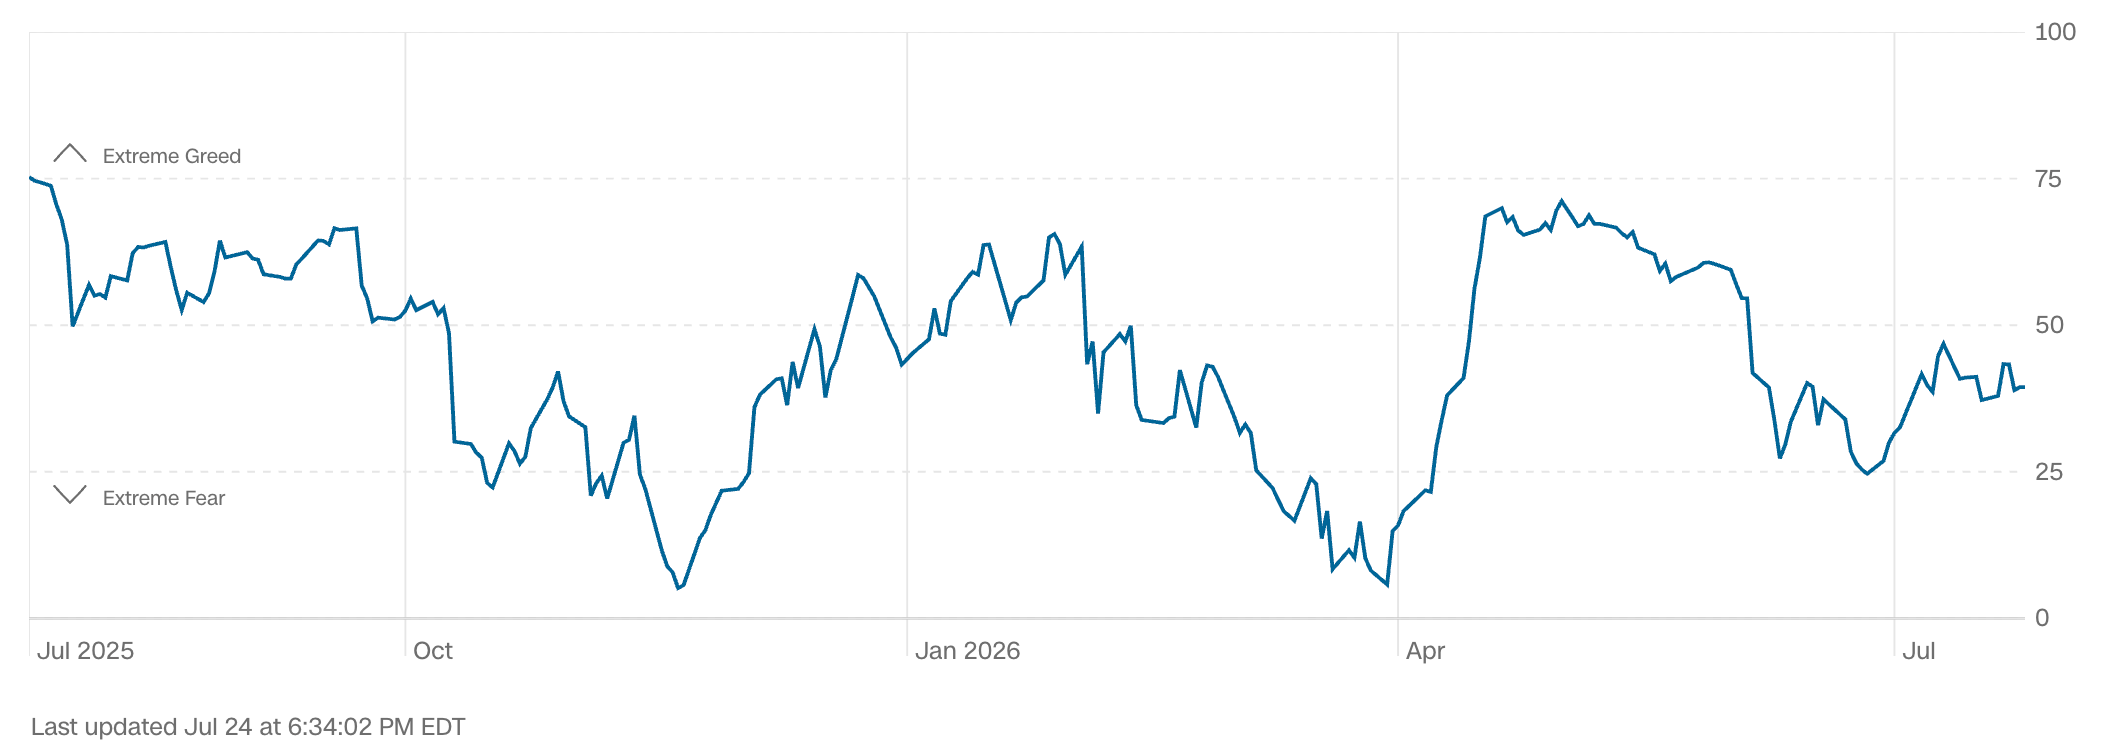
Data courtesy of CNN Business as of Friday’s market close.
The Fear & Greed Index from CNN Business can be used as an attempt to gauge whether or not stocks are fairly priced and to determine the mood of the market. It is a compilation of seven of the most important indicators that measure different aspects of stock market behavior. They are: market momentum, stock price strength, stock price breadth, put and call option ratio, junk bond demand, market volatility and safe haven demand.
Extreme Fear readings can lead to potential opportunities as investors may have driven prices “too low” from a possibly excessive risk-off negative sentiment.
Extreme Greed readings can be associated with possibly too-frothy prices and a sense of “FOMO” with investors chasing rallies in an excessively risk-on environment . This overcrowded positioning leaves the market potentially vulnerable to a sharp downward reversal.
WWW.ANGLIAADVISORS.COM | SIMON@ANGLIAADVISORS.COM | CALL OR TEXT: (646) 286 0290 | FOLLOW ANGLIA ADVISORS ON INSTAGRAM


