


As the end of the month and the quarter approached, Wall Street prepped over the weekend for a narrative likely to be dominated by tiresome government shutdown-related brinkmanship in Washington DC. Investors have generally been well-served by ignoring domestic politics. That was always going to be a difficult task last week.
The countdown to 12:01am ET on Wednesday began on Monday with stocks still hanging on to seemingly endless AI exuberance and the effects of mutual fund end-of-quarter window dressing, pushed tech and tech-adjacent prices higher to extend the previous Friday’s gains in the indexes.
Congressional leaders from both sides met with Trump and Vance on Monday in an attempt to find an off-ramp for the looming shutdown. Given the cast of characters involved, it was no surprise that the meeting was a complete fail and the nasty partisan blame game intensified (including an appalling social media deep-fake video). Betting markets immediately raised the odds of a shutdown from 75% to 89%.
Wall Street woke up to more new tariffs on Tuesday, the final day of the month and the quarter and Shutdown Eve. Timber, lumber and furniture were the latest victims and, by extension, the American homebuilding industry and Canada.
Stocks sank moderately to start the session with a shutdown assumption now firmly baked in. Some late dip-buying squeaked the indexes into the green by the close and complete a fifth straight month of gains and their best-performing September since 2010. Traders pulled up their lawn chairs to watch the pitiful, shabby events unfold in Congress.
The most powerful nation on earth had no fully-functioning government in place when financial markets opened on Wednesday. With the regular Jobs Report looking unlikely to be published as scheduled on Friday, the normally B-list ADP payrolls report took on greater importance and came in very soft, showing negative private sector job growth.
As institutional traders began to reconstitute their portfolios for what is historically a favorable final quarter, stocks finished higher and interest rates fell on the back of the Fed-rate-cut-friendly ADP data. Much to the relief of financial markets, Trump withdrew his nomination of unqualified Jan 6th rioter EJ Antoni, who once called social security “a Ponzi scheme”, for the role of head of the Bureau of Labor Statistics (BLS).
Wall Street continued to dance to the beat of its own music on Thursday while chaos reigned in the nation’s capital, with the S&P 500 and the NASDAQ breezing to more new all-time record highs based on the same old cheerfulness brought about by falling interest rate expectations and AI optimism, the gift that just keeps on giving. Healthcare stocks had a rare boost as Pfizer and Eli Lilly appeared to be coming to pricing agreements with the administration.
Jobs Report Day arrived on Friday with the stock indexes on a five-day winning streak but no Jobs Report. The data had already been collected, all that remained to be done was for someone at the BLS to hit the send button, but that didn’t happen and Trump refused to deem the agency as essential and thereby release the report as he had discretion to do. This led of course to conspiracy theories about whether he had had a sneak peek of the numbers and didn’t like what he saw.
Stocks shrugged it all off though and the indexes strolled pretty aimlessly along the flatline all day. The S&P 500 eked out the most miniscule of gains at the close but it was enough to technically record a sixth straight up-day and another all-time record high to cap a solid week.
The betting markets are confidently predicting the shutdown lasting until at least October 15th. One date to keep in mind is this coming Friday, October 10th, the next scheduled pay-day for federal workers. The heat could crank up considerably if that is missed and initial polling suggests that the country is already blaming Trump and his minions in Congress for this mess. The motivation to end the standoff might start to pick up at that point.
Bottom line, the shutdown isn’t going to alter the economic outlook or cause any sustainable market volatility unless we get into multi-month territory and it won’t, of itself, undermine the core bullish drivers of i) solid growth, ii) falling interest rates, iii) AI enthusiasm and iv) stable inflation.
It has already, however, started causing delays in the data and may impact further releases, such as the planned CPI inflation number on October 15th. Such an outcome would inject uncertainty into the Fed’s decision-making process, forcing it to fly blind in foggy skies at the rate-setting meeting on October 29th and that could potentially trigger unnecessary short-term market volatility.
If you are not yet a financial planning or investment management client of Anglia Advisors and would like to explore becoming one, please feel free to reach out to arrange a complimentary no-obligation discovery call with me.
ARTICLE OF THE WEEK ..
What actually happens in a government shutdown?
.. AND I QUOTE ..
With the shutdown in mind .. “Never put off until tomorrow what may be done the day after tomorrow” .
Mark Twain
LAST WEEK BY THE NUMBERS:
Last week’s market color courtesy of finviz.com
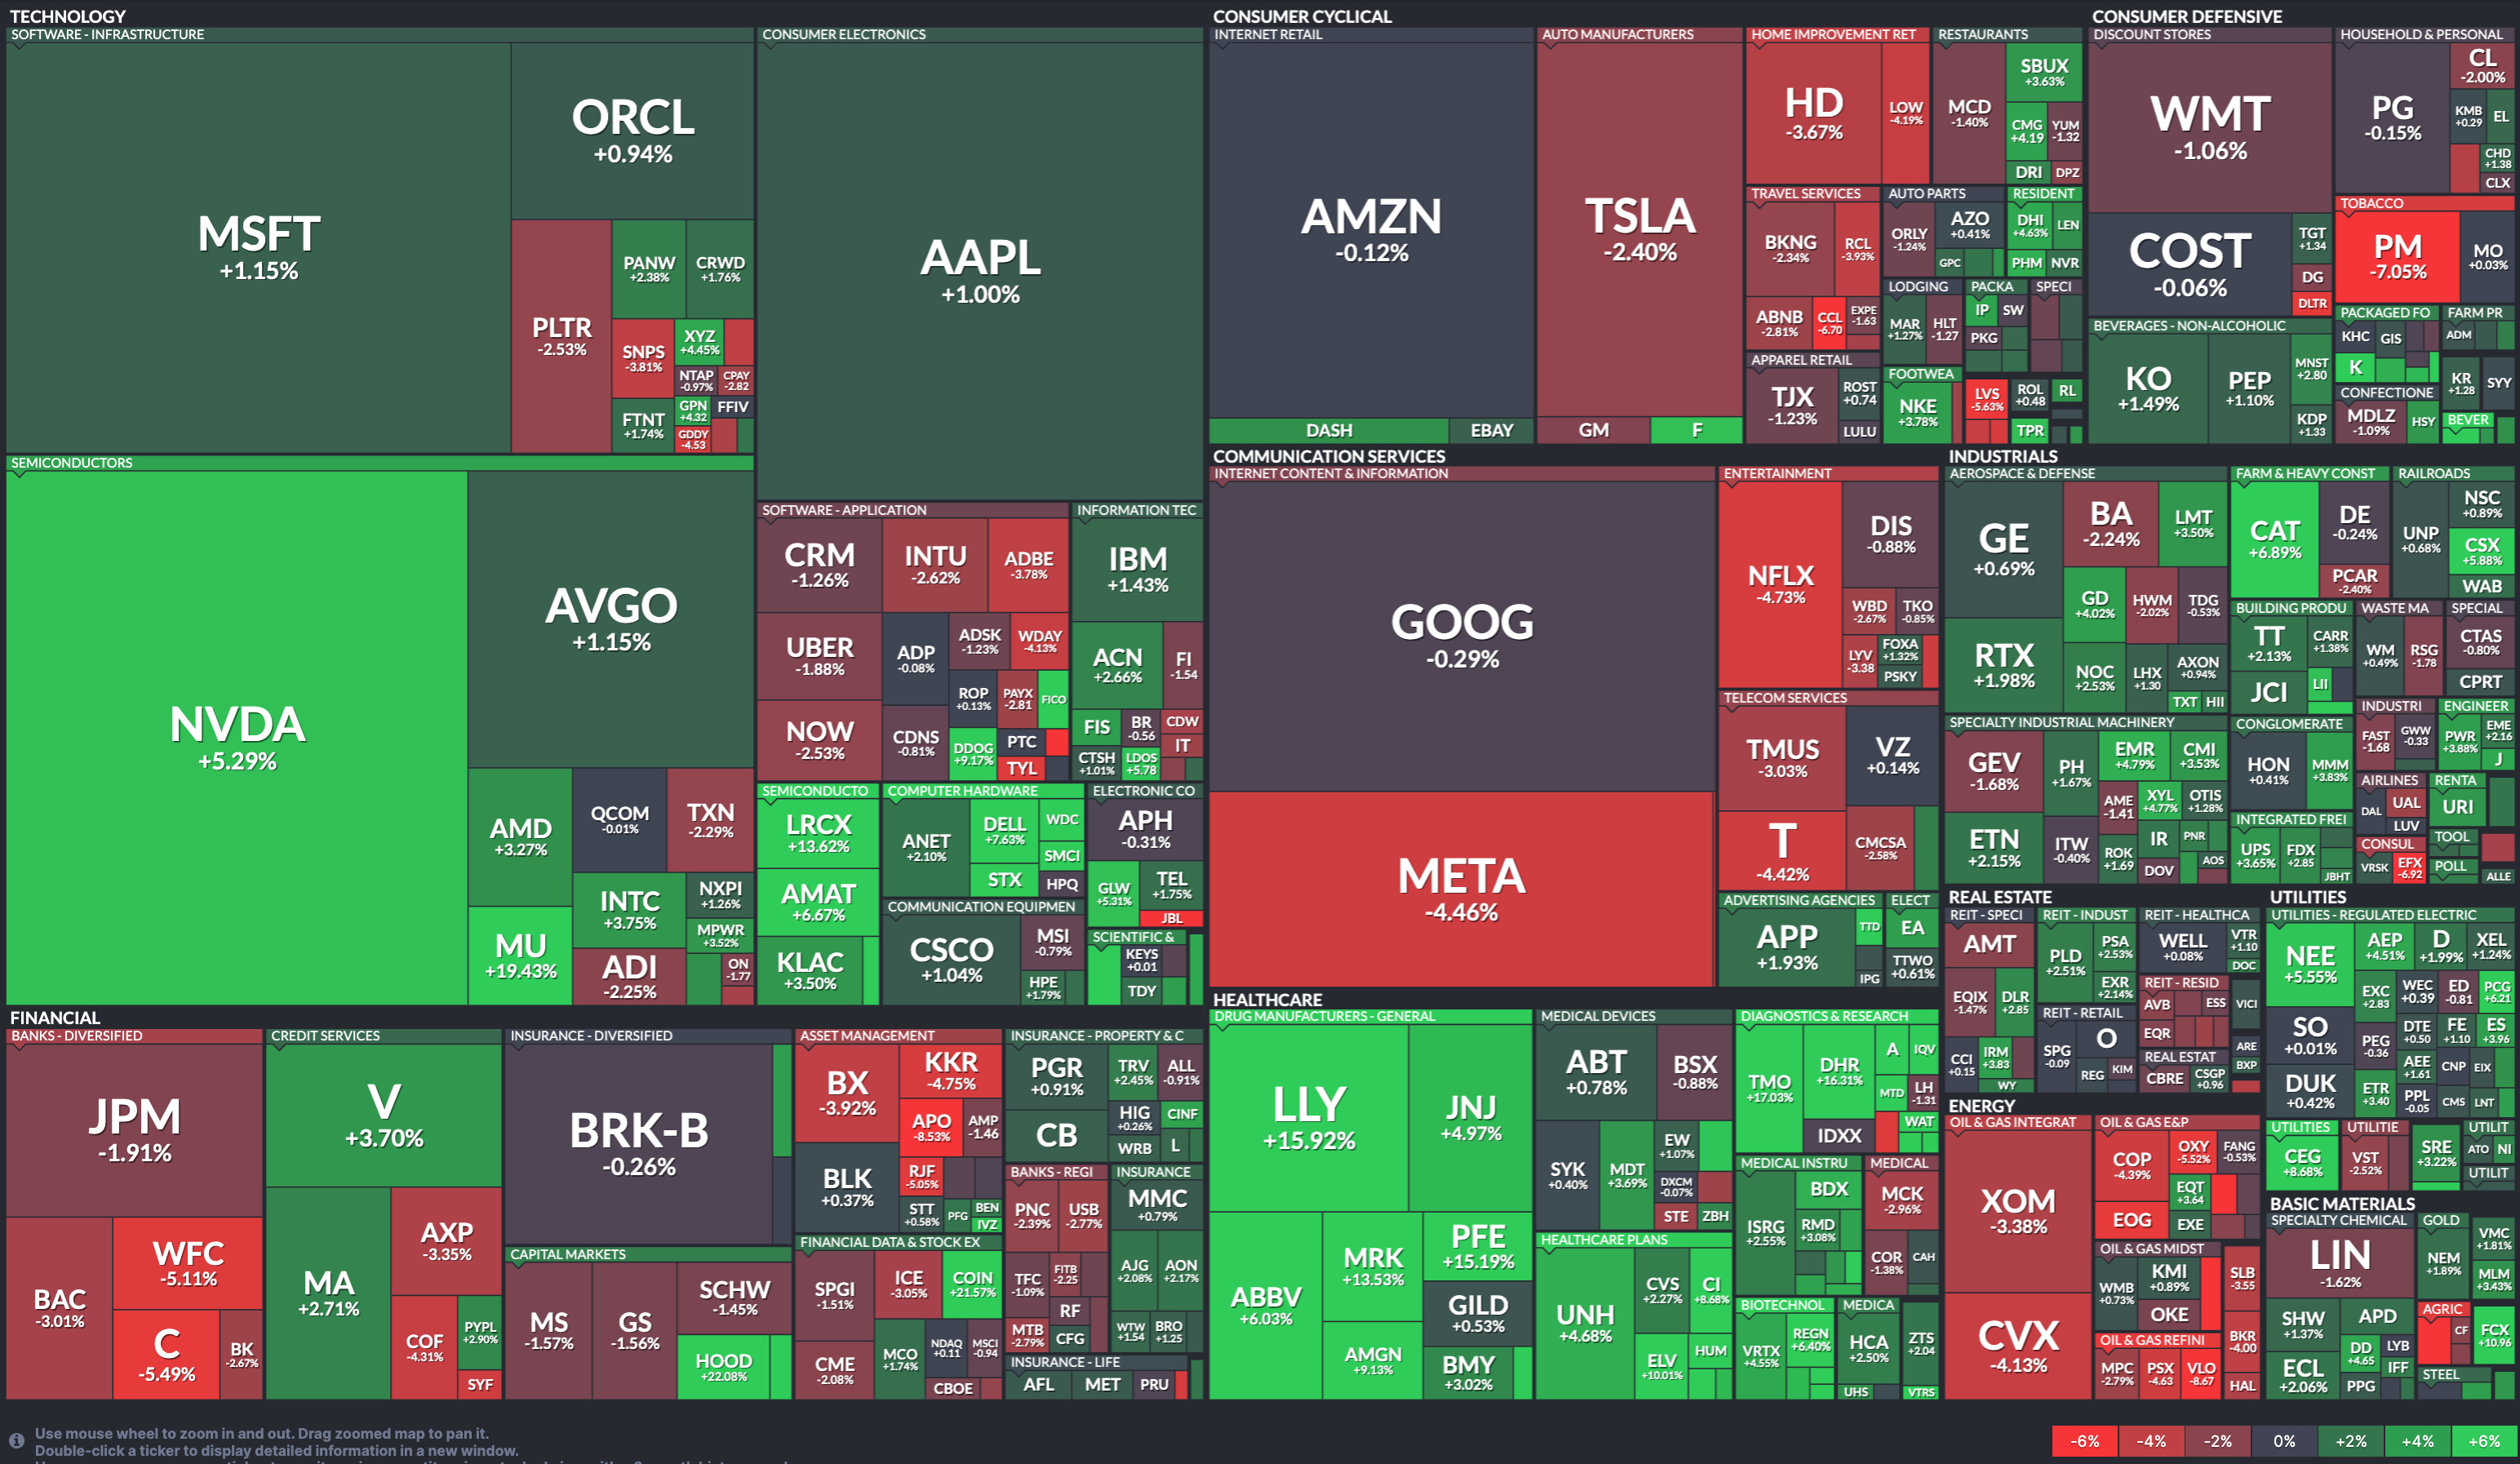
Last week’s best performing US sector: Healthcare (two biggest holdings: Eli Lilly, Johnson and Johnson) ⬆︎ 6.9% for the week
Last week’s worst performing US sector: Energy (two biggest holdings: Exxon-Mobil, Chevron) ⬇︎ 3.4% for the week
SPY, a US Large Cap ETF, tracks the S&P 500 index, made up of 500 stocks from a universe of the largest US companies. Its price rose 1.1% last week, is up 14.2% so far this year and ended the week at a new all-time record closing high.
IWM, a US Small Cap ETF, tracks the Russell 2000 index, made up of the bottom two-thirds in terms of company size of a universe of 3,000 of the largest US stocks. Its price rose 1.9% last week, is up 11.3% so far this year and ended the week at a new all-time record closing high.
VXUS, a Global Non-US ETF, tracks the MSCI ACWI Ex-US index, made up of over 8,500 of the largest names from a universe of stocks issued by companies from around the world excluding the United States, in both developed and emerging markets. Its price rose 2.6% last week, is up 26.7% so far this year and ended the week at a new all-time record closing high.
INTEREST RATES:
FED FUNDS * ⬌ 4.125% (unchanged)
PRIME RATE ** ⬌ 7.25% (unchanged)
3 MONTH TREASURY ⬆︎ 4.03% (4.02% a week ago)
2 YEAR TREASURY ⬇︎ 3.58% (3.63% a week ago)
5 YEAR TREASURY ⬇︎ 3.72% (3.76% a week ago)
10 YEAR TREASURY *** ⬇︎ 4.13% (4.20% a week ago)
20 YEAR TREASURY ⬇︎ 4.69% (4.74% a week ago)
30 YEAR TREASURY ⬇︎ 4.71% (4.77% a week ago)
Data courtesy of the Federal Reserve and the Department of the Treasury as of the market close on Friday
* Decided upon by the Federal Reserve Open Market Committee. Used as a basis for overnight interbank loans and for determining high yield savings interest rates.
** Wall Street Journal Prime Rate as of Friday’s close. Used as a basis for determining many consumer loan interest rates such as credit cards, personal loans, home equity loans/lines of credit, securities-based lending and auto loans.
*** Used as a basis for determining mortgage interest rates and some business loans
AVERAGE 30-YEAR FIXED MORTGAGE RATE:
⬆︎ 6.34%
One week ago: 6.30%, one month ago: 6.45%, one year ago: 6.12%
Data courtesy of Freddie Mac Primary Mortgage Market Survey
INTEREST RATE EXPECTATIONS:
Where will the Fed Funds interest rate be after the next rate-setting meeting on October 29th?
Unchanged from now .. ⬇︎ 4% probability (8% a week ago)
0.25% lower than now .. ⬆︎ 96% probability (92% a week ago)
With two more Fed rate-setting meetings left in 2025, what is the most commonly-expected number of remaining 0.25% Fed Funds interest rate cuts this year?
⬌ Two (unchanged from a week ago)
Data courtesy of CME FedWatch Tool
All data based on the Fed Funds interest rate (currently 4.125%). Calculated from Federal Funds futures prices as of the market close on Friday.
PERCENT OF S&P 500 STOCKS ABOVE THEIR OWN 200-DAY MOVING AVERAGE:
⬆︎ 65%
One week ago: 62%, one month ago: 56%, one year ago: 76%
Data courtesy of MacroMicro as of Friday’s market close
This widely-used technical measure of market breadth is considered to be a robust indicator of the overall health of the S&P 500 index. A high percentage (above 70%) generally suggests broad market strength and a bullish trend, while a low percentage (below 30%) may indicate market weakness and a bearish trend.
FEAR & GREED INDEX:
“Be fearful when others are greedy and be greedy when others are fearful.” Warren Buffet.
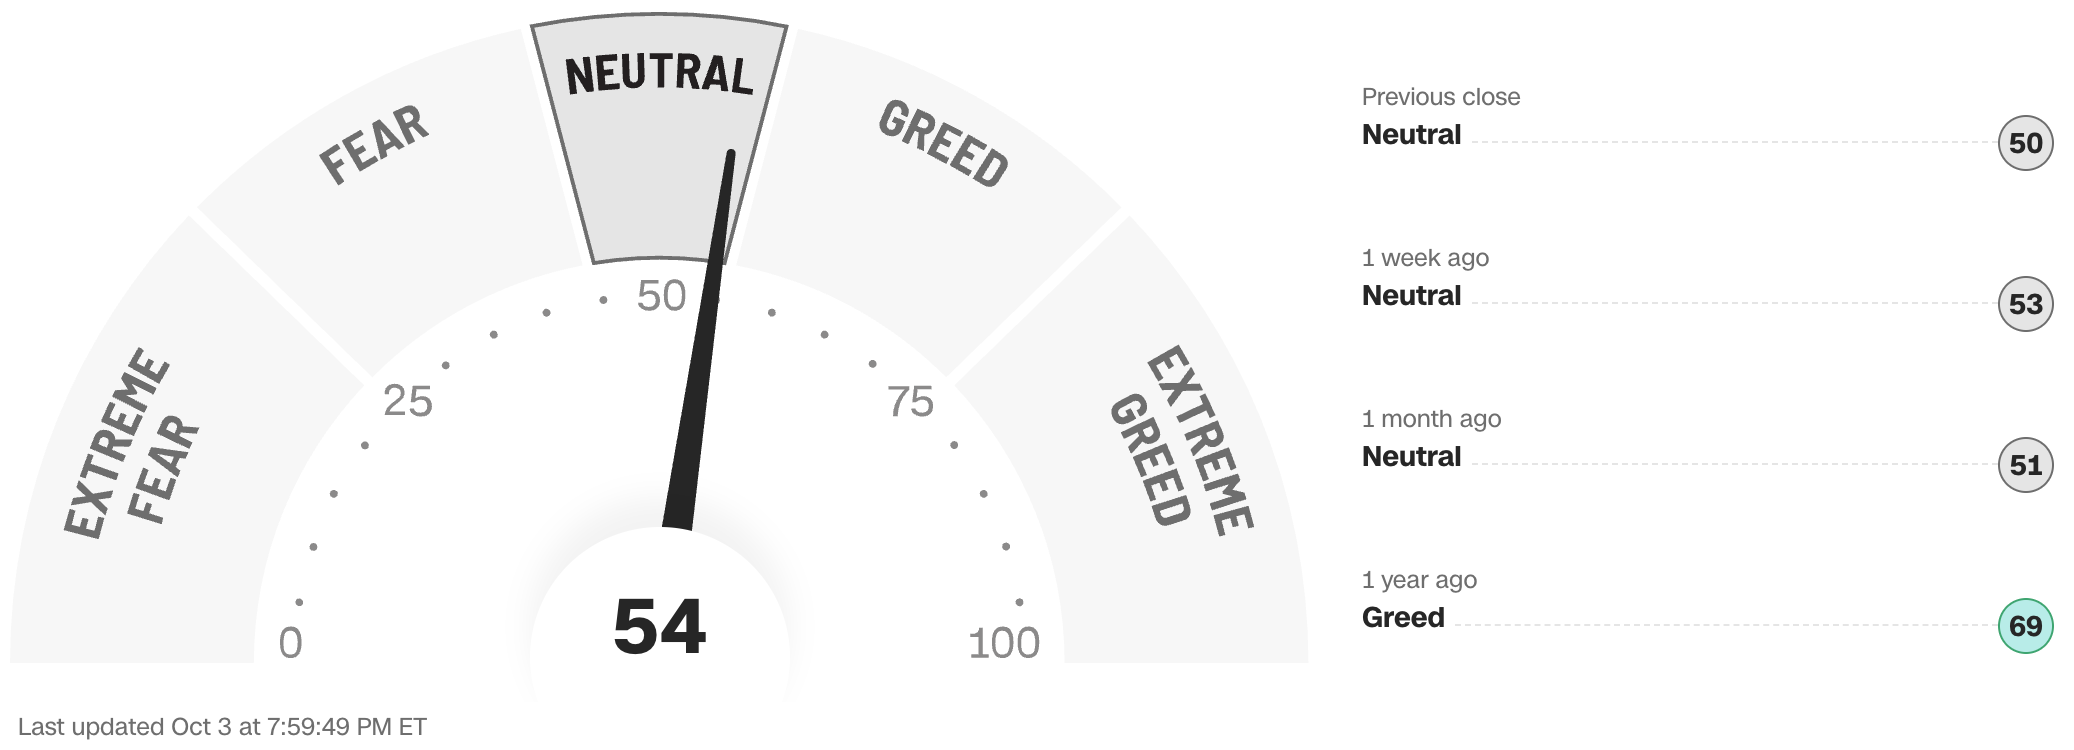
Data courtesy of CNN Business as of Friday’s market close
The Fear & Greed Index from CNN Business can be used as an attempt to gauge whether or not stocks are fairly priced and to determine the mood of the market. It is a compilation of seven of the most important indicators that measure different aspects of stock market behavior. They are: market momentum, stock price strength, stock price breadth, put and call option ratio, junk bond demand, market volatility and safe haven demand.
Extreme Fear readings can lead to potential opportunities as investors may have driven prices “too low” from a possibly excessive risk-off negative sentiment.
Extreme Greed readings can be associated with possibly too-frothy prices and a sense of “FOMO” with investors chasing rallies in an excessively risk-on environment . This overcrowded positioning leaves the market potentially vulnerable to a sharp downward reversal at some point.
A “sweet spot” is considered to be in the lower-to-mid “Greed” zone.
Note: Anglia Advisors has updated its Privacy Policy. You can view the latest version here.
WWW.ANGLIAADVISORS.COM | SIMON@ANGLIAADVISORS.COM | CALL OR TEXT: (646) 286 0290 | FOLLOW ANGLIA ADVISORS ON INSTAGRAM
This material represents a highly opinionated, speculative assessment of the financial market environment based on assumptions and prevailing information and data at a specific point in time and is always subject to change at any time. Although the content is believed to be correct at the time of publication, no warranty of its accuracy or completeness is ever given. It is never to be interpreted as an attempt to forecast any future events, nor does it offer any kind of guarantee whatsoever of future results, circumstances or outcomes.
The material contained herein is not necessarily complete and is also wholly insufficient to be relied upon as research or investment advice or as a sole basis for any financial determinations, including investment decisions or making any kind of consumer choices, without further consultation with Anglia Advisors or other fully-qualified Registered Investment Advisor. The user assumes the entire risk of any decisions made or actions taken based in whole or in part on any of the information provided in this or any other Anglia Advisors published content.
Under no circumstances is any Anglia Advisors’ content ever intended to constitute tax, legal or medical advice and should never be taken as such. Neither the information contained nor any opinion expressed herein constitutes a solicitation for the purchase of any security or asset class. No formal client advice may be rendered by Anglia Advisors unless and until a properly-executed client engagement agreement is in place.
Posts may contain links or references to third party websites or may post data or graphics from them for the convenience and interest of readers. While Anglia Advisors might have reason to believe in the quality of the content provided on these sites, the firm has no control over, and is not in any way responsible for, the accuracy of such content nor for the security or privacy protocols that external sites may or may not employ. By making use of such links, the user assumes, in its entirety, any kind of risk associated with accessing them or making use of any information provided therein.
Those associated with Anglia Advisors, including clients with managed or advised investments, may maintain positions in securities and/or asset classes mentioned in this post.
If you enjoyed this post, why not share it with someone?


