


The stock market was starting to run out of ammunition when it came to any meaningful remaining economic data releases this year with just PCE inflation and GDP to come and any Santa Claus rally would have to be built mainly on vibes. It would also be subject to geopolitical winds which don’t look great (Venezuela, Ukraine, Middle East) as well as the volatility that can often result from thin holiday markets and lightly-populated trading desks.
The three-and-a-half day week began positively on Monday following the previous week’s surprise drop in inflation and lukewarm US labor market data keeping a January Fed Funds Rate cut at least on the table. After an as-expected 2.8% PCE inflation reading pretty much confirming the previous week’s CPI numbers, the stock indexes made a charge to try to squeeze in some more record highs before the ball drops on New Year’s Eve, closing higher and back into the green for the month of December, just shy of their goal.
An extraordinary GDP print premarket on Tuesday showed a 4.3% growth estimate for Q3, a two-year high which blew through expectations, although it was tempered by the inclusion in the data of a tactical and temporary acceleration of economic activity during the quarter with companies and consumers trying to get ahead of tariffs.
In this good-news-is-bad-news environment, markets were briefly unnerved by this strong argument against the need for more Fed rate cuts and the market-driven probability of a January reduction fell sharply (see INTEREST RATE EXPECTATIONS below).
The stock rally initially stalled but the indexes soon found their feet in super-low-volume trading and the quest for more new all-time highs resumed and proved ultimately successful in the case of the S&P 500 which closed at a new record.
Defying Trump’s attempts to shut them down, US financial markets were open for a half-day on Wednesday and stocks got back to work marching deeper into record territory on scant volume with the S&P 500 index scoring its 39th all-time high of the year and a first on a Xmas Eve since 2013 when its price reached the giddy heights of 1,833. It is now closing in on 7,000.
With most major international markets closed, New York traders who did decide to show up at their posts on Friday spent a deathly-quiet session (the lowest volume trading day of 2025) with half an eye on the weather forecast, with the North-East bracing for a brutal dumping of snow. Predictably, stocks went nowhere to close out what was still a solid week for the indexes.
The reality is that two of the most important pillars of the now-three-year+ rally in stock prices (during which time the S&P 500 has increased by over 80%), AI enthusiasm and strongly-expected Fed rate cuts, may not necessarily be firmly in place as we move into 2026.
However, with a buoyant GDP, jobs still being created every month, the higher-earning American consumer continuing to spend hard, inflation stable (even though it remains above the Fed’s target) and ongoing cheery corporate earnings, the current odds of a recession in 2026 are no higher than the historical norm (they are never zero).
Having said that, given midterm elections, the uncertain geopolitical landscape and Trump’s habit of routinely lobbing Molotov cocktails into the mix, I think that a degree of unpredictable economic disorder next year can safely be assumed.
If you are not yet a financial planning or investment management client of Anglia Advisors and would like to explore becoming one, please feel free to reach out to arrange a complimentary no-obligation discovery call with me.
ARTICLE OF THE WEEK ..
The case for the commonly-held idea that we are in a soon-to-pop AI bubble relies heavily on the precedent of the tech crash in 2000. Here’s an argument for why that may well be a flawed premise and the fears might possibly be unfounded.
.. AND I QUOTE ..
“Respect the trend, but don’t ignore the risks.”
Cameron Dawson, chief investment officer at NewEdge Wealth
LAST WEEK BY THE NUMBERS:
Last week’s market color courtesy of finviz.com
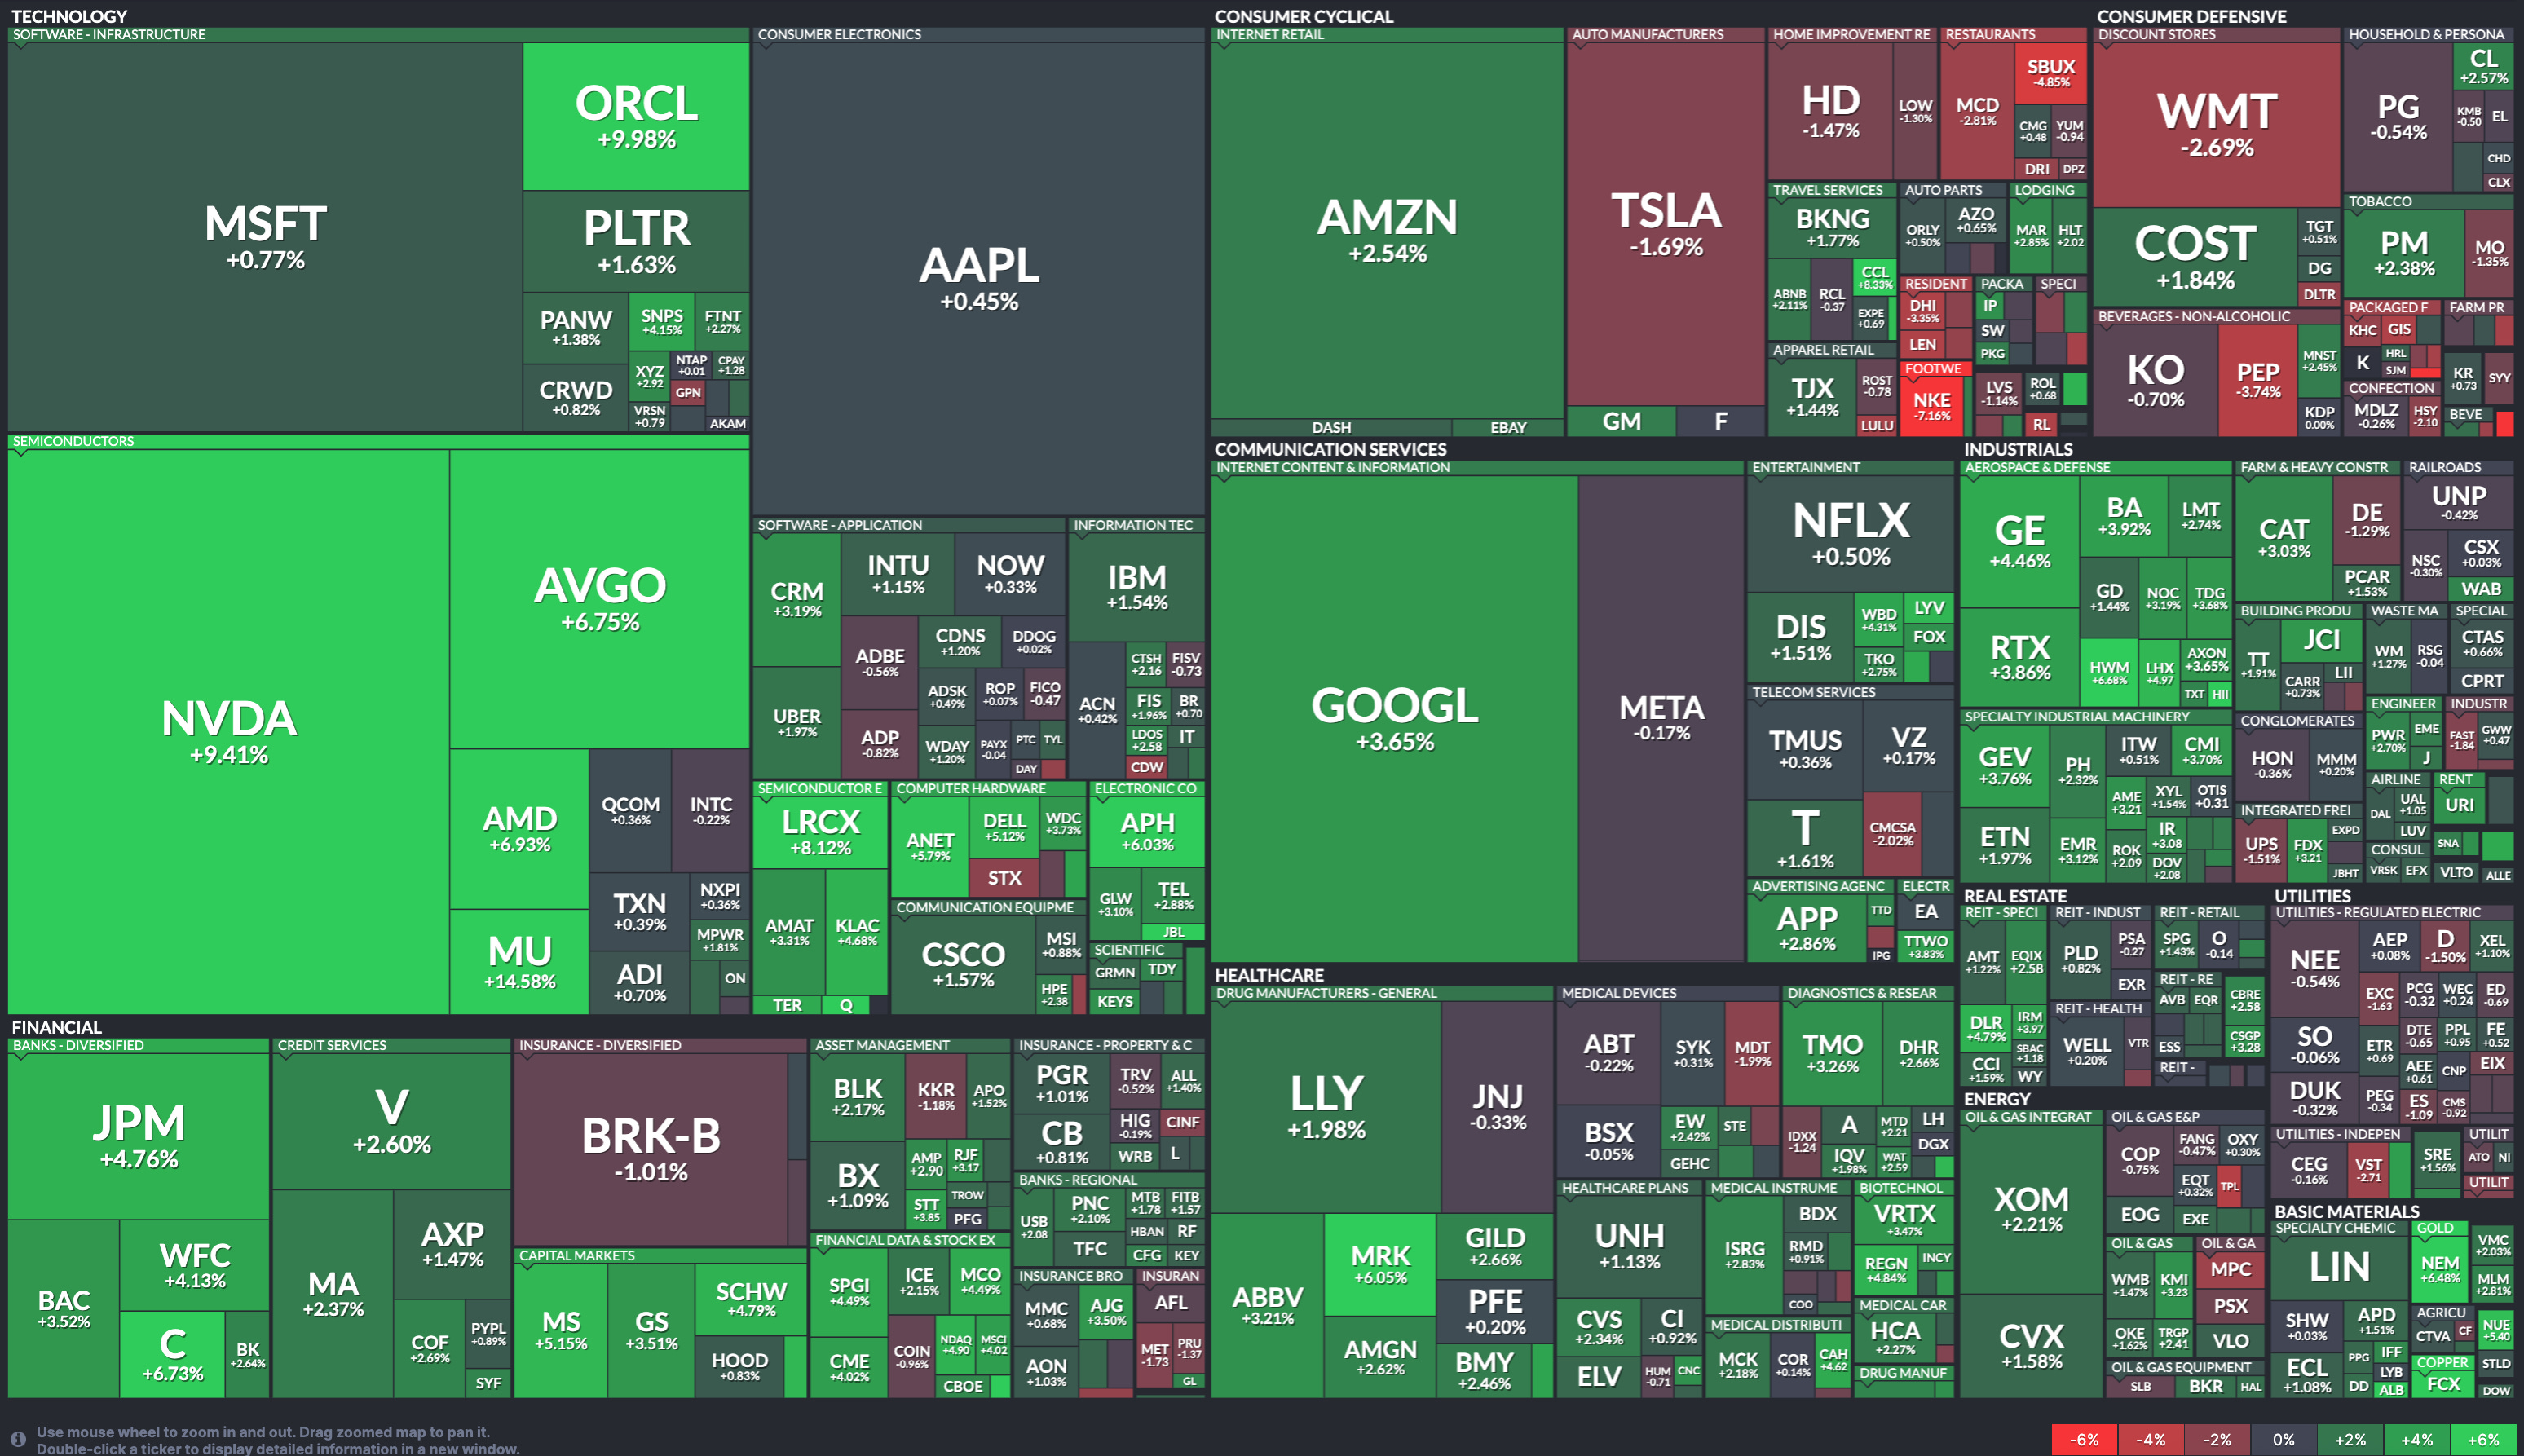
Last week’s best performing US sector: Materials (two biggest holdings: Linde, Newmont) ⬆︎ 1.0% for the week
Last week’s worst performing US sector: Consumer Defensive (two biggest holdings: Walmart, Costco) ⬆︎ 0.4% for the week
SPY, a US Large Cap ETF, tracks the S&P 500 index, made up of 500 stocks from a universe of the largest US companies. Its price rose 1.4% last week, is up 17.8% so far this year and ended the week 0.2% below its all-time record closing high (12/24/2025).
IWM, a US Small Cap ETF, tracks the Russell 2000 index, made up of the bottom two-thirds in terms of company size of a universe of 3,000 of the largest US stocks. Its price rose 0.3% last week, is up 13.8% so far this year and ended the week 2.6% below its all-time record closing high (12/10/2025).
VXUS, a Global Non-US ETF, tracks the MSCI ACWI Ex-US index, made up of over 8,500 of the largest names from a universe of stocks issued by companies from around the world excluding the United States, in both developed and emerging markets. Its price rose 1.6% last week, is up 28.7% so far this year and ended the week 0.5% below its all-time record closing high (12/24/2025).
INTEREST RATES:
FED FUNDS RATE * ⬌ 3.625% (unchanged from a week ago)
PRIME RATE ** ⬌ 6.75% (unchanged from a week ago)
3 MONTH TREASURY ⬆︎ 3.64% (3.62% a week ago)
2 YEAR TREASURY ⬇︎ 3.46% (3.48% a week ago)
5 YEAR TREASURY ⬇︎ 3.68% (3.70% a week ago)
10 YEAR TREASURY *** ⬇︎ 4.14% (4.16% a week ago)
20 YEAR TREASURY ⬇︎ 4.76% (4.77% a week ago)
30 YEAR TREASURY ⬇︎ 4.81% (4.82% a week ago)
Data courtesy of the Federal Reserve and the Department of the Treasury as of the market close on Friday
* Decided upon by the Federal Reserve Open Market Committee at periodic meetings 8x a year. Used as a basis for overnight interbank loans and for determining high yield savings interest rates.
** Wall Street Journal Prime Rate as of Friday’s close. Tending to move in lockstep with the Fed Funds Rate, this measure is used as a basis for determining certain consumer loan interest rates such as credit cards, auto loans, personal loans, home equity loans/lines of credit and securities-based lending.
*** Used as a basis for determining mortgage interest rates and some business loans
AVERAGE 30-YEAR FIXED MORTGAGE RATE:
⬇︎ 6.18%
One week ago: 6.21%, one month ago: 6.25%, one year ago: 6.85%
Data courtesy of the Freddie Mac Primary Mortgage Market Survey
INTEREST RATE EXPECTATIONS:
Where will the Fed Funds interest rate be after the next rate-setting meeting on January 28th?
Unchanged from now .. ⬆︎ 82% probability (78% a week ago)
0.25% lower than now .. ⬇︎ 18% probability (22% a week ago)
With eight rate-setting meetings in 2026, what is the most commonly-expected number of 0.25% Fed Funds interest rate cuts next year?
⬌ Two (unchanged from a week ago)
Data courtesy of CME FedWatch Tool
All data based on the Fed Funds interest rate (currently 3.625%). Calculated from Federal Funds futures prices as of the market close on Friday.
PERCENT OF S&P 500 STOCKS ABOVE THEIR OWN 200-DAY MOVING AVERAGE:
⬆︎ 60%
One week ago: 58%, one month ago: 58%, one year ago: 60%
Data courtesy of MacroMicro as of Friday’s market close
This widely-used technical measure of market breadth is considered to be a very robust indicator of the overall health of the S&P 500 index.
A high percentage (above 70%) generally suggests broad market strength and a bullish trend, while a low percentage (below 30%) may indicate market weakness and a bearish trend.
FEAR & GREED INDEX:
“Be fearful when others are greedy and be greedy when others are fearful.” Warren Buffett.
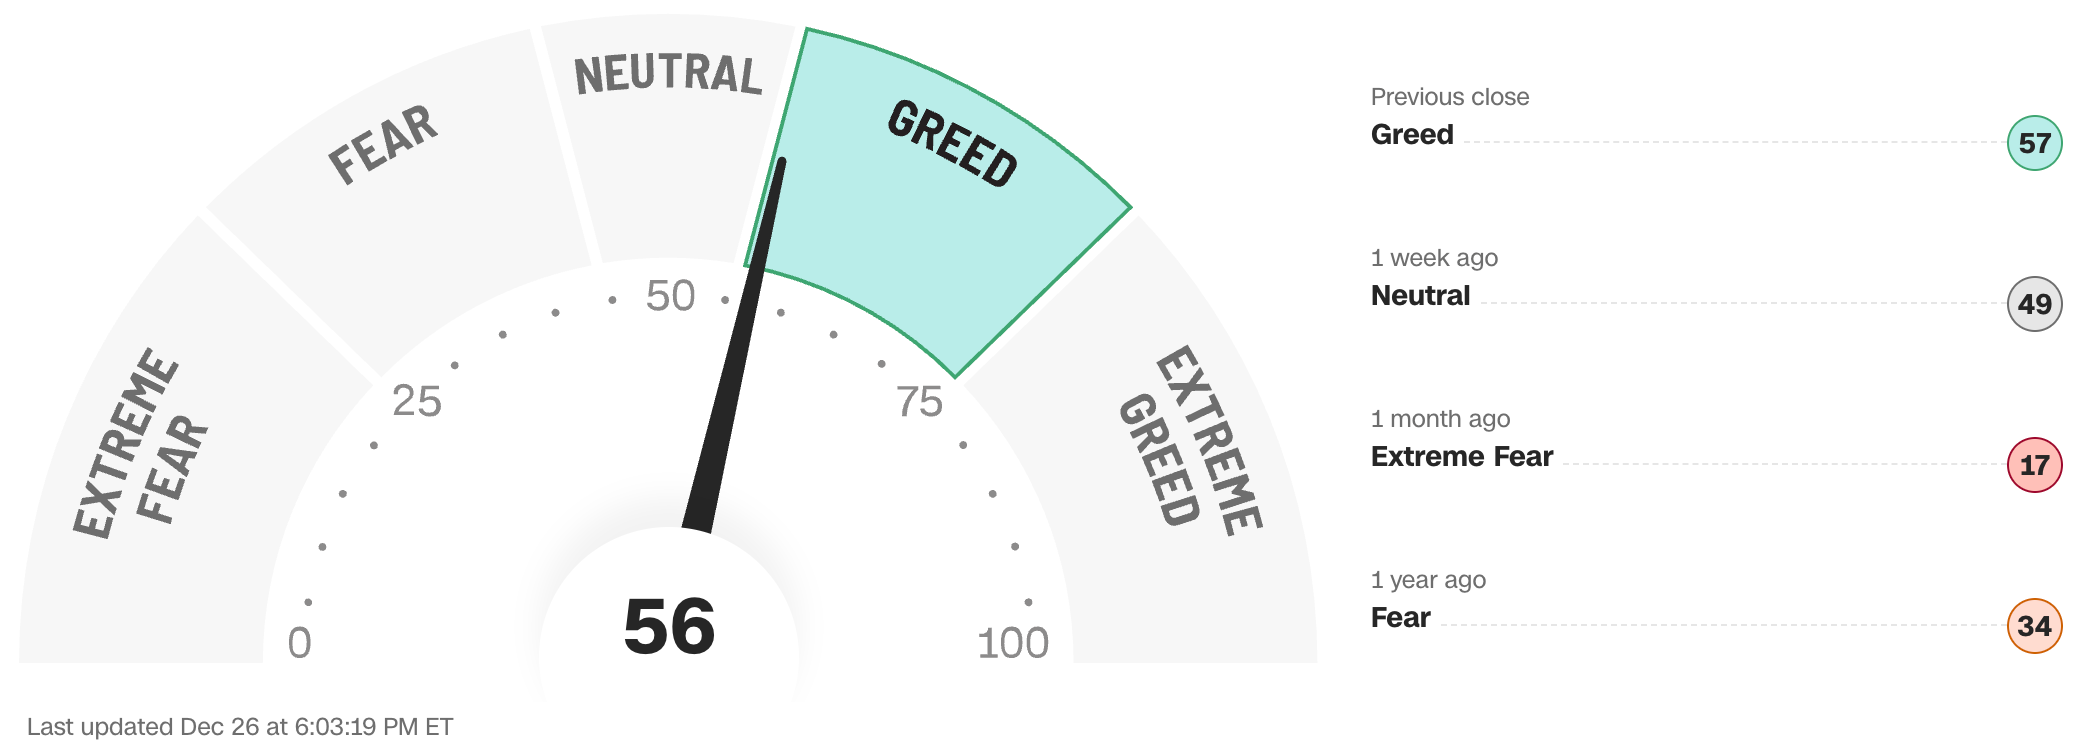
Data courtesy of CNN Business as of Friday’s market close
The Fear & Greed Index from CNN Business can be used as an attempt to gauge whether or not stocks are fairly priced and to determine the mood of the market. It is a compilation of seven of the most important indicators that measure different aspects of stock market behavior. They are: market momentum, stock price strength, stock price breadth, put and call option ratio, junk bond demand, market volatility and safe haven demand.
Extreme Fear readings can lead to potential opportunities as investors may have driven prices “too low” from a possibly excessive risk-off negative sentiment.
Extreme Greed readings can be associated with possibly too-frothy prices and a sense of “FOMO” with investors chasing rallies in an excessively risk-on environment . This overcrowded positioning leaves the market potentially vulnerable to a sharp downward reversal at some point.
A “sweet spot” is considered to be in the lower-to-mid “Greed” zone.
Anglia Advisors recently updated its Privacy Policy. You can view the latest version here.
WWW.ANGLIAADVISORS.COM | SIMON@ANGLIAADVISORS.COM | CALL OR TEXT: (646) 286 0290 | FOLLOW ANGLIA ADVISORS ON INSTAGRAM
This material represents a highly opinionated, speculative assessment of the financial market environment based on assumptions and prevailing information and data at a specific point in time and is always subject to change at any time. Although the content is believed to be correct at the time of publication, no warranty of its accuracy or completeness is ever given. It is never to be interpreted as an attempt to forecast any future events, nor does it offer any kind of guarantee whatsoever of future results, circumstances or outcomes.
The material contained herein is not necessarily complete and is also wholly insufficient to be relied upon as research or investment advice or as a sole basis for any financial determinations, including investment decisions or making any kind of consumer choices, without further consultation with Anglia Advisors or other fully-qualified Registered Investment Advisor. The user assumes the entire risk of any decisions made or actions taken based in whole or in part on any of the information provided in this or any other Anglia Advisors published content.
Under no circumstances is any Anglia Advisors’ content ever intended to constitute tax, legal or medical advice and should never be taken as such. Neither the information contained nor any opinion expressed herein constitutes a solicitation for the purchase of any security or asset class. No formal client advice may be rendered by Anglia Advisors unless and until a properly-executed client engagement agreement is in place.
Posts may contain links or references to third party websites or may post data or graphics from them for the convenience and interest of readers. While Anglia Advisors might have reason to believe in the quality of the content provided on these sites, the firm has no control over, and is not in any way responsible for, the accuracy of such content nor for the security or privacy protocols that external sites may or may not employ. By making use of such links, the user assumes, in its entirety, any kind of risk associated with accessing them or making use of any information provided therein.
Those associated with Anglia Advisors, including clients with managed or advised investments, may maintain positions in securities and/or asset classes mentioned in this post.
If you enjoyed this post, why not share it with someone?


