


The weekend newswires were obviously dominated by the abduction of Nicolas Maduro and his wife during a large-scale deadly US military attack on Venezuela. Trump bizarrely declared US remote sovereignty over the country that supposedly has the world’s largest oil reserves, with zero detail about how this would be accomplished but also refusing to rule out the deployment of American troops on the ground.
It was also heavily implied that either Cuba, Colombia, Mexico or Greenland could be the next cab off the rank for similar treatment.
As stock traders got back to the grind after the holidays on Monday, Asian and European markets and even the oil price mostly shrugged off the weekend’s events and US stocks sprang higher at the open, led by energy names who stand to potentially benefit from developments in Venezuela and tech names with the kick-off in Las Vegas of the annual CES, a kind of battleground for chipmakers and designers to announce and show off their sexy new products. But a late-arriving Santa Claus had gifts for most of the risk-on sectors and the indexes closed the session solidly higher on much improved volume.
Stocks opened in a more muted fashion on Tuesday morning but quickly picked up steam as the session wore on. The gains seemed to be simply momentum-based as there was no real news, data or a specific catalyst for the rise in the indexes, but the S&P 500 still reached its first new all-time record high of the year, creeping ever closer to the 7,000 mark.
Wednesday saw heavily-outdated JOLTS data indicating an expected decline in job openings, an also-anticipated drop in Durable Goods orders as well as flashpoints in international waters as the US military ran around seizing Venezuela-linked oil tankers, including an empty Russian one.
Stocks continued higher at a more cautious pace but a late day swoon ended the three-day winning streak after Trump went on an out-of-left-field social media blitz to signal a ban on large investors from buying homes, forced taxpayer purchase of mortgage bonds and aerospace and defense companies (think GE, Lockheed Martin, possibly even Boeing) to no longer be allowed to issue dividends to shareholders while at the same time advocating for sky-high, deficit-busting levels of more than half a trillion dollars of increased defense spending.
This slew of outlandish interventionist policy proclamations continued to weigh on enthusiasm on Thursday and the stock indexes basically spent the session treading water but with a somewhat noticeable rotation out of the Magnificent Seven into Small Cap stocks with the Russell 2000 Small Cap Index achieving a new all-time record high.
We finally got to see a cleaner Jobs Report pre-market on Friday after recent data contamination due to the shutdown which showed a lackluster level of new job creation but a drop in the unemployment rate to below 4.4%. As a result, the odds of a January 28th cut in the Fed Funds Rate tumbled to negligible levels (see INTEREST RATE EXPECTATIONS below).
Stock indexes moved steadily higher and deeper into record territory, once again led by Small Caps, bringing to an end an exhausting but price-positive week with the anticipation of the Q4 earnings season kicking off in the coming days.
I don’t usually focus on individual names in this report, but here’s a pop quiz .. Where do you think Nvidia’s returns in 2025 ranked among the stocks in the S&P 500 index? .. The answer might surprise many, Nvidia was actually only the 75th best performer out of the 500 (#1 was SanDisk), but it was the biggest contributor to the positive performance of the index (and thereby to S&P 500-tracking ETFs and mutual funds) due to its high weighting (almost 8% of the entire index).
As a group, all of the Magnificent Seven stocks outperformed the S&P 500 index in 2023, six of them did in 2024 but just two of them did in 2025.
The fact is that Nvidia’s stock price has been in the doldrums since late October and remains 10% lower than it was back then on capital spending concerns, while the S&P 500 has traded at multiple new all-time highs in that time, including again just last week.
The bar for further large gains in Nvidia’s price is high but among other components of the S&P 500 index and others (including international indexes), there appear to be plenty of stocks (Google, AMD and a collection of overseas companies, for example) willing to pick up Nvidia’s slack.
So, yet again, we see the overwhelming argument for holding thousands of different stocks across multiple geographies, sectors and capitalizations using ETFs rather than concentrating your bets by selectively picking just a handful of names, bets you will likely lose.
I was recently interviewed by Vetta-Fi who host the annual Exchange ETF conference in Las Vegas about my practice. You can read the interview here.
If you are not yet a financial planning or investment management client of Anglia Advisors and would like to explore becoming one, please feel free to reach out to arrange a complimentary no-obligation discovery call with me.
ARTICLE OF THE WEEK ..
Prediction platforms are enabling bets on everything from who’ll be the next Fed chairman to will Zelensky wear a suit, from the World Cup winner to the timing of a second coming of Jesus Christ. But there are significant questions about access, integrity and regulation.
.. AND I QUOTE ..
“We think people are sleeping on the macro risks — and [Venezuela] is a macro risk we didn’t even see.”
Christopher Harvey, Head of equity and portfolio strategy, CIBC Capital Markets
LAST WEEK BY THE NUMBERS:
Last week’s market color courtesy of finviz.com
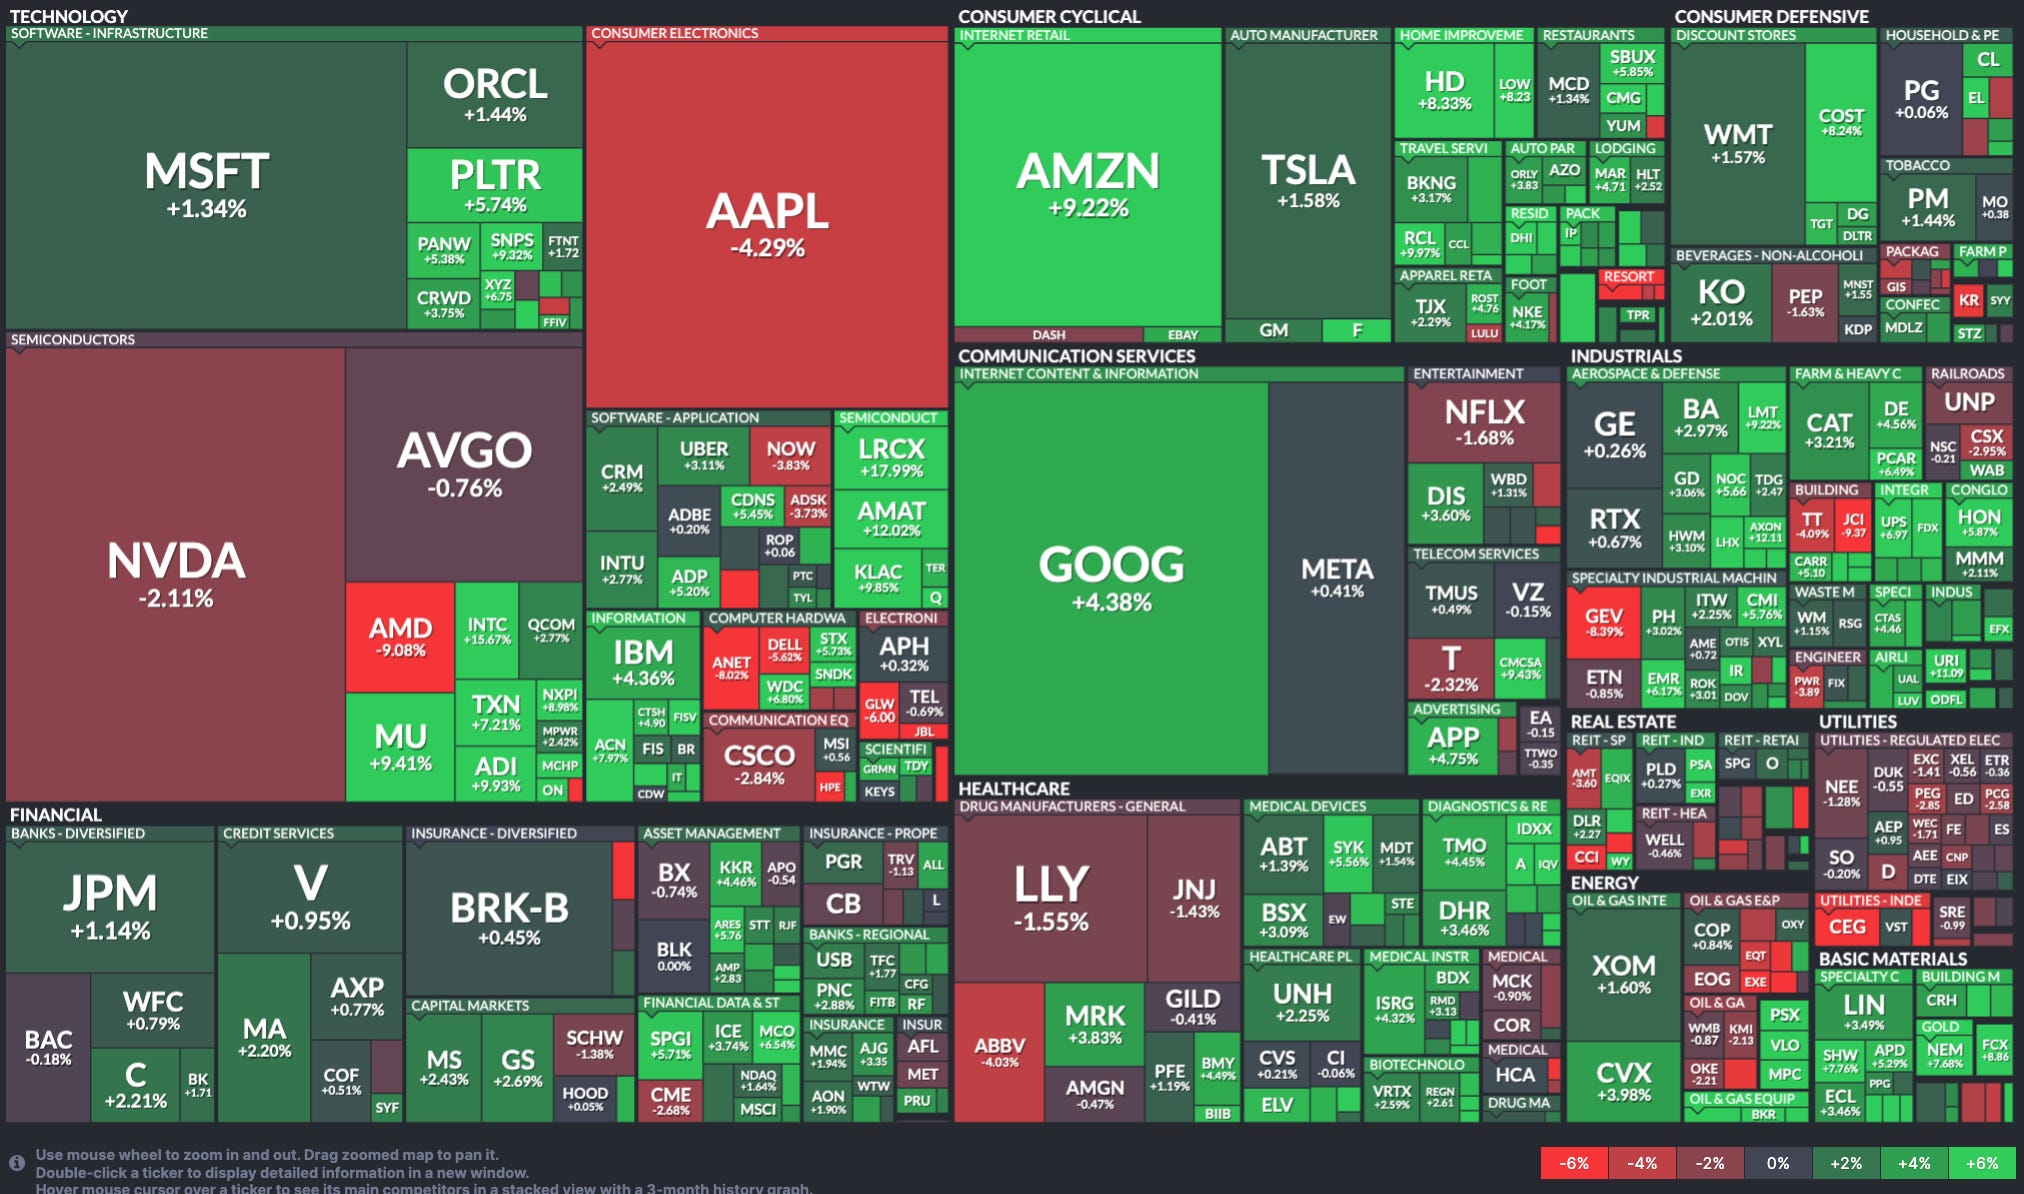
Last week’s best performing US sector: Consumer Cyclical (two biggest holdings: Amazon, Tesla) ⬆︎ 5.1% for the week
Last week’s worst performing US sector: Utilities (two biggest holdings: NextEra Energy, Constellation) ⬇︎ 1.6% for the week
SPY, a US Large Cap ETF, tracks the S&P 500 index, made up of 500 stocks from a universe of the largest US companies. Its price rose 1.6% last week, is up 1.7% so far this year and ended the week at its all-time record closing high.
IWM, a US Small Cap ETF, tracks the Russell 2000 index, made up of the bottom two-thirds in terms of company size of a universe of 3,000 of the largest US stocks. Its price rose 4.6% last week, is up 5.7% so far this year and ended the week at its all-time record closing high.
VXUS, a Global Non-US ETF, tracks the MSCI ACWI Ex-US index, made up of over 8,500 of the largest names from a universe of stocks issued by companies from around the world excluding the United States, in both developed and emerging markets. Its price rose 1.7% last week, is up 3.2% so far this year and ended the week at its all-time record closing high.
INTEREST RATES:
FED FUNDS RATE * ⬌ 3.625% (unchanged from a week ago)
PRIME RATE ** ⬌ 6.75% (unchanged from a week ago)
3 MONTH TREASURY ⬇︎ 3.62% (3.65% a week ago)
2 YEAR TREASURY ⬆︎ 3.54% (3.47% a week ago)
5 YEAR TREASURY ⬆︎ 3.75% (3.74% a week ago)
10 YEAR TREASURY *** ⬇︎ 4.18% (4.19% a week ago)
20 YEAR TREASURY ⬇︎ 4.76% (4.81% a week ago)
30 YEAR TREASURY ⬇︎ 4.82% (4.86% a week ago)
Data courtesy of the Federal Reserve and the Department of the Treasury as of the market close on Friday
* Decided upon by the Federal Reserve Open Market Committee at periodic meetings 8x a year. Used as a basis for overnight interbank loans and for determining high yield savings interest rates.
** Wall Street Journal Prime Rate as of Friday’s close. Tending to move in lockstep with the Fed Funds Rate, this measure is used as a basis for determining certain consumer loan interest rates such as credit cards, auto loans, personal loans, home equity loans/lines of credit and securities-based lending.
*** Used as a basis for determining mortgage interest rates and some business loans
AVERAGE 30-YEAR FIXED MORTGAGE RATE:
⬆︎ 6.16%
One week ago: 6.15%, one month ago: 6.21%, one year ago: 6.93%
Data courtesy of the Freddie Mac Primary Mortgage Market Survey
INTEREST RATE EXPECTATIONS:
Where will the Fed Funds interest rate be after the next rate-setting meeting on January 28th?
Unchanged from now .. ⬆︎ 96% probability (83% a week ago)
0.25% lower than now .. ⬇︎ 4% probability (17% a week ago)
With eight rate-setting meetings in 2026, what is the most commonly-expected number of 0.25% Fed Funds interest rate cuts this year?
⬌ Two (unchanged from a week ago)
Data courtesy of CME FedWatch Tool
All data based on the Fed Funds interest rate (currently 3.625%). Calculated from Federal Funds futures prices as of the market close on Friday.
PERCENT OF S&P 500 STOCKS ABOVE THEIR OWN 200-DAY MOVING AVERAGE:
⬆︎ 64%
One week ago: 59%, one month ago: 56%, one year ago: 55%
Data courtesy of MacroMicro as of Friday’s market close
This widely-used technical measure of market breadth is considered to be a very robust indicator of the overall health of the S&P 500 index.
A high percentage (above 70%) generally suggests broad market strength and a bullish trend, while a low percentage (below 30%) may indicate market weakness and a bearish trend.
FEAR & GREED INDEX:
“Be fearful when others are greedy and be greedy when others are fearful.” Warren Buffett.
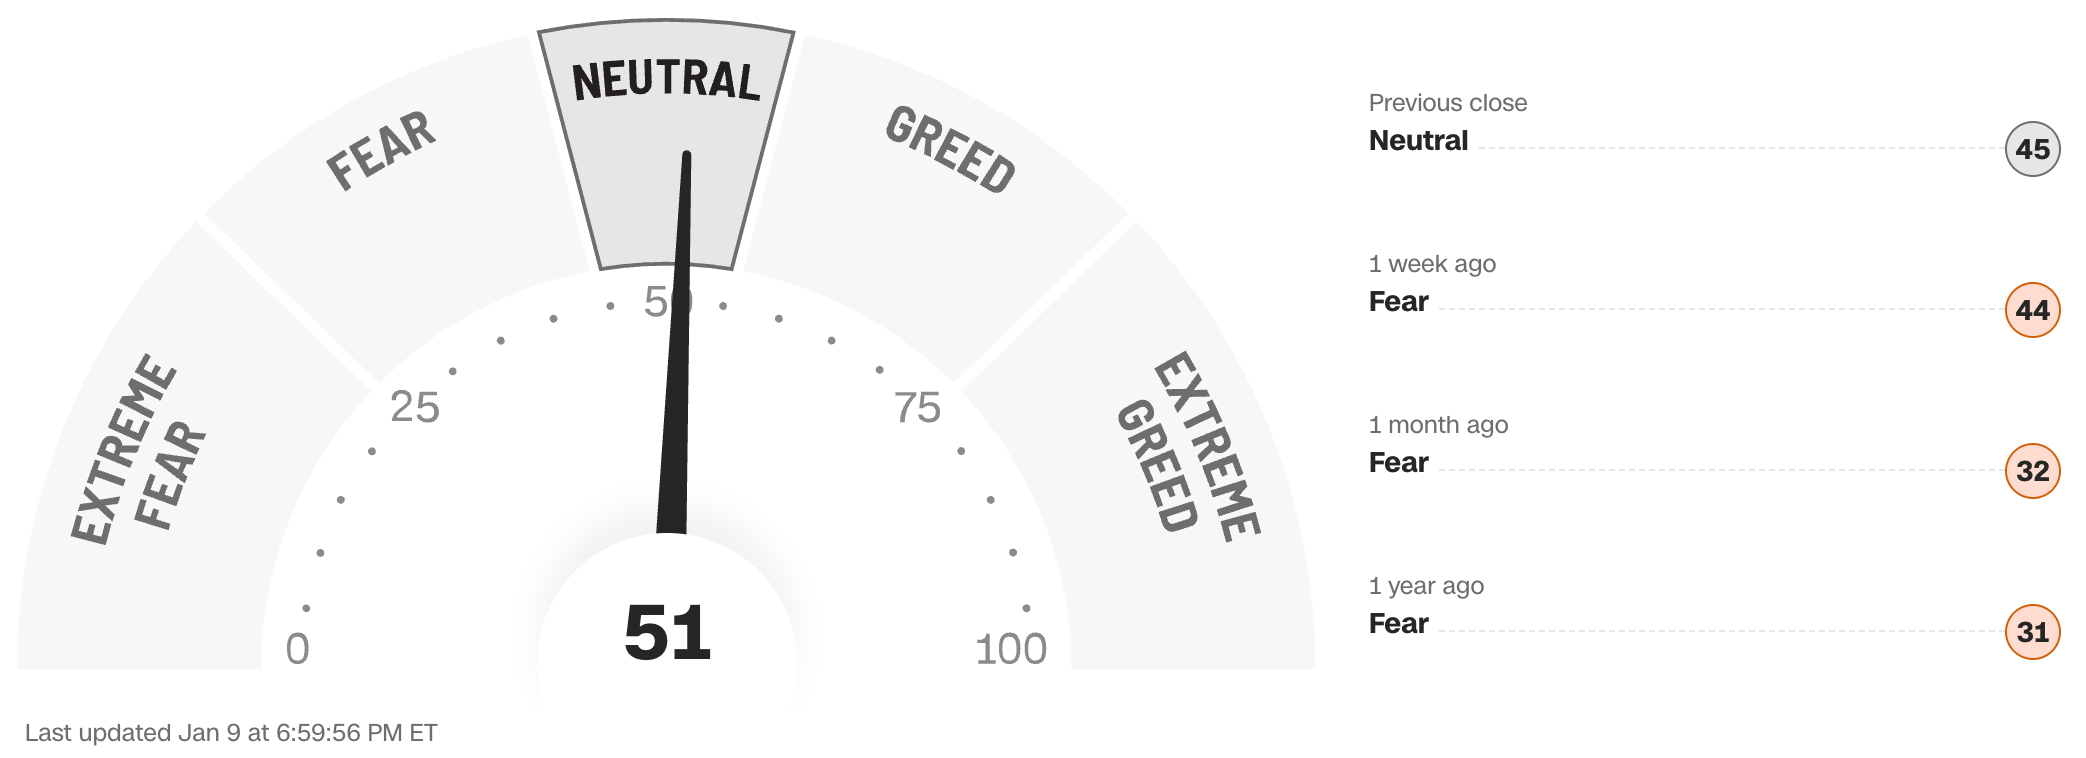
Data courtesy of CNN Business as of Friday’s market close
The Fear & Greed Index from CNN Business can be used as an attempt to gauge whether or not stocks are fairly priced and to determine the mood of the market. It is a compilation of seven of the most important indicators that measure different aspects of stock market behavior. They are: market momentum, stock price strength, stock price breadth, put and call option ratio, junk bond demand, market volatility and safe haven demand.
Extreme Fear readings can lead to potential opportunities as investors may have driven prices “too low” from a possibly excessive risk-off negative sentiment.
Extreme Greed readings can be associated with possibly too-frothy prices and a sense of “FOMO” with investors chasing rallies in an excessively risk-on environment . This overcrowded positioning leaves the market potentially vulnerable to a sharp downward reversal at some point.
A “sweet spot” is considered to be in the lower-to-mid “Greed” zone.
Anglia Advisors recently updated its Privacy Policy. You can view the latest version here.
WWW.ANGLIAADVISORS.COM | SIMON@ANGLIAADVISORS.COM | CALL OR TEXT: (646) 286 0290 | FOLLOW ANGLIA ADVISORS ON INSTAGRAM
This material represents a highly opinionated, speculative assessment of the financial market environment based on assumptions and prevailing information and data at a specific point in time and is always subject to change at any time. Although the content is believed to be correct at the time of publication, no warranty of its accuracy or completeness is ever given. It is never to be interpreted as an attempt to forecast any future events, nor does it offer any kind of guarantee whatsoever of future results, circumstances or outcomes.
The material contained herein is not necessarily complete and is also wholly insufficient to be relied upon as research or investment advice or as a sole basis for any financial determinations, including investment decisions or making any kind of consumer choices, without further consultation with Anglia Advisors or other fully-qualified Registered Investment Advisor. The user assumes the entire risk of any decisions made or actions taken based in whole or in part on any of the information provided in this or any other Anglia Advisors published content.
Under no circumstances is any Anglia Advisors’ content ever intended to constitute tax, legal or medical advice and should never be taken as such. Neither the information contained nor any opinion expressed herein constitutes a solicitation for the purchase of any security or asset class. No formal client advice may be rendered by Anglia Advisors unless and until a properly-executed client engagement agreement is in place.
Posts may contain links or references to third party websites or may post data or graphics from them for the convenience and interest of readers. While Anglia Advisors might have reason to believe in the quality of the content provided on these sites, the firm has no control over, and is not in any way responsible for, the accuracy of such content nor for the security or privacy protocols that external sites may or may not employ. By making use of such links, the user assumes, in its entirety, any kind of risk associated with accessing them or making use of any information provided therein.
Those associated with Anglia Advisors, including clients with managed or advised investments, may maintain positions in securities and/or asset classes mentioned in this post.
If you enjoyed this post, why not share it with someone?


