01/04/2026. Catch up with all you need to know from the entire week in financial markets in less than ten minutes every Sunday by reading or listening to my easily-digestible weekly market review.
Another holiday-shortened week began with Trump holding an apparently chummy meeting in Florida with Zelensky followed by a cozy phone call with Putin, but the desperate PR spin from all sides afterwards was unable to mask the reality that a workable peace deal is still well out of reach.
Stocks retreated further on Monday from their Xmas Eve record highs on pitiful trading volume on the back of some year-end profit-taking as niggling doubts persisted about AI company valuations and the ultimate projected rate of return on their gigantic levels of spending. Interest rates inched higher.
The penultimate trading day of the year on Tuesday saw a churn to nowhere for stocks. The release of the minutes from the most recent Fed rate-setting meeting that voted to cut by 0.25% indicated a divided committee with a number of members clearly open to changing their minds and their votes depending on upcoming economic data. Some Big Tech/AI names recovered a little but the session was a low volume snooze-fest with the indexes barely moving.
Stocks exited 2025 with a whimper on Wednesday, slipping lower over the course of another lethargic session.
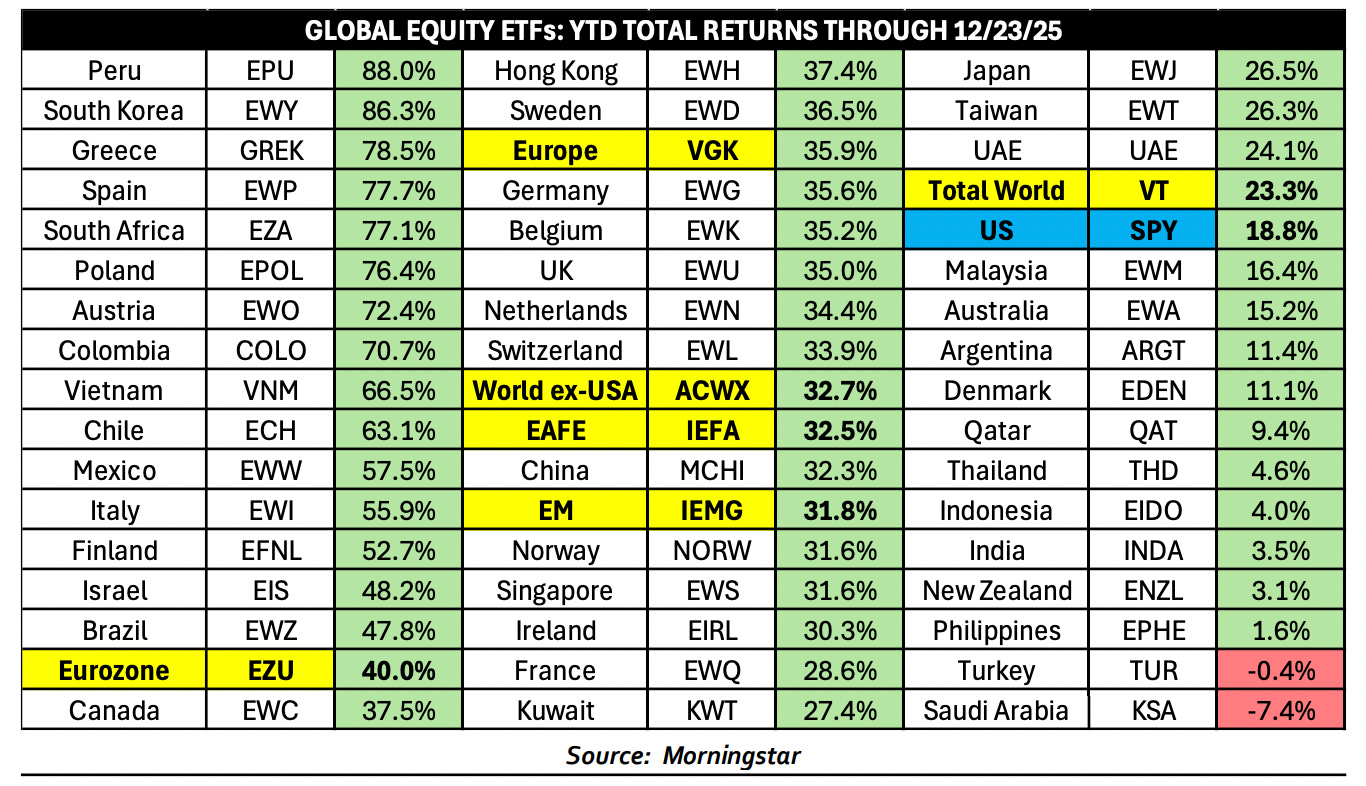
For the calendar year, the S&P 500 was up ~17%, its sixth year of 15%+ gains in the past seven and ended close to its all-time record high. The NASDAQ was up ~20%, but international markets (developed and emerging combined) outperformed the US for the first time in years with an aggregated ~30% increase in 2025.
Peru was the world’s best-performing stock market in dollar terms through late December 2025 (+88%) and the worst was Saudi Arabia (-7%).
The US (as represented by the S&P 500) finished in 39th place out of the 51 countries and regions studied in terms of stock market performance.
The new trading year kicked off on Friday with international stocks off to the races again but US equities slumbered through another dreary low-volume session. A renewed bout of TACO broke out with a number of selected tariffs getting delayed or diluted, something we can expect to see more of in a mid-term election year. The US indexes closed the day mixed and down for the week.
Wall Street is unanimously bullish on the year ahead, despite the fact that historical data shows generally less-than-impressive average returns in the year following previous strong three-year runs like the one we have just experienced, which has generated an ~84% return so far in the S&P 500 since the October 2022 bottom.
In last week’s report I referenced two of the pillars upon which the rally has been primarily built; a high level of AI enthusiasm and a strong expectation of imminent multiple Fed Funds Rate cuts - both of which could possibly be on the wane as we enter 2026.
There are two other major pillars; stable economic and earnings growth and tariff clarity.
Stable economic growth did a lot of the heavy lifting in 2025 as Wall Street was constantly surprised by how under control inflation appeared to be, how orderly the decline in the labor market has been and how well particularly high-end consumer spending held up, bolstering corporate earnings.
This could all change if the unemployment rate moves sustainably above 5% (currently 4.6%), inflation (currently 2.8%) shifts to the mid-3% range or higher and/or top-earning consumers start pulling back on spending.
A major component of tariff clarity will come any day now when the Supreme Court finally rules on the legality of the emergency powers-contingent IEEPA tariffs, the type used for most of the levy impositions so far. Should the court strike them down, there could be chaos as US companies seek refunds/credits on what they have already paid and the administration will be forced to pivot to other tariff types like Section 232 or Section 301.
2026 also promises a revamped Federal Reserve led by a spineless Trump yes-man, a probably nasty midterm election campaign likely to result in a divided Congress, continued geopolitical volatility, upside and downside economic data surprises, new themes and paradigms and a whole collection of bombshells that we cannot even conceive of yet.
I’ll do my best to keep you updated and informed each week as these all play out.
If you are not yet a financial planning or investment management client of Anglia Advisors and would like to explore becoming one, please feel free to reach out to arrange a complimentary no-obligation discovery call with me.
ARTICLE OF THE WEEK ..
“Some might argue that [an investment’s performance relative to the broad market] is all that matters, but I disagree.”
“Choice can be a tax, not a benefit. Consumers don’t want more choices; they want more confidence in the choices presented.”
Scott Galloway
LAST WEEK BY THE NUMBERS:
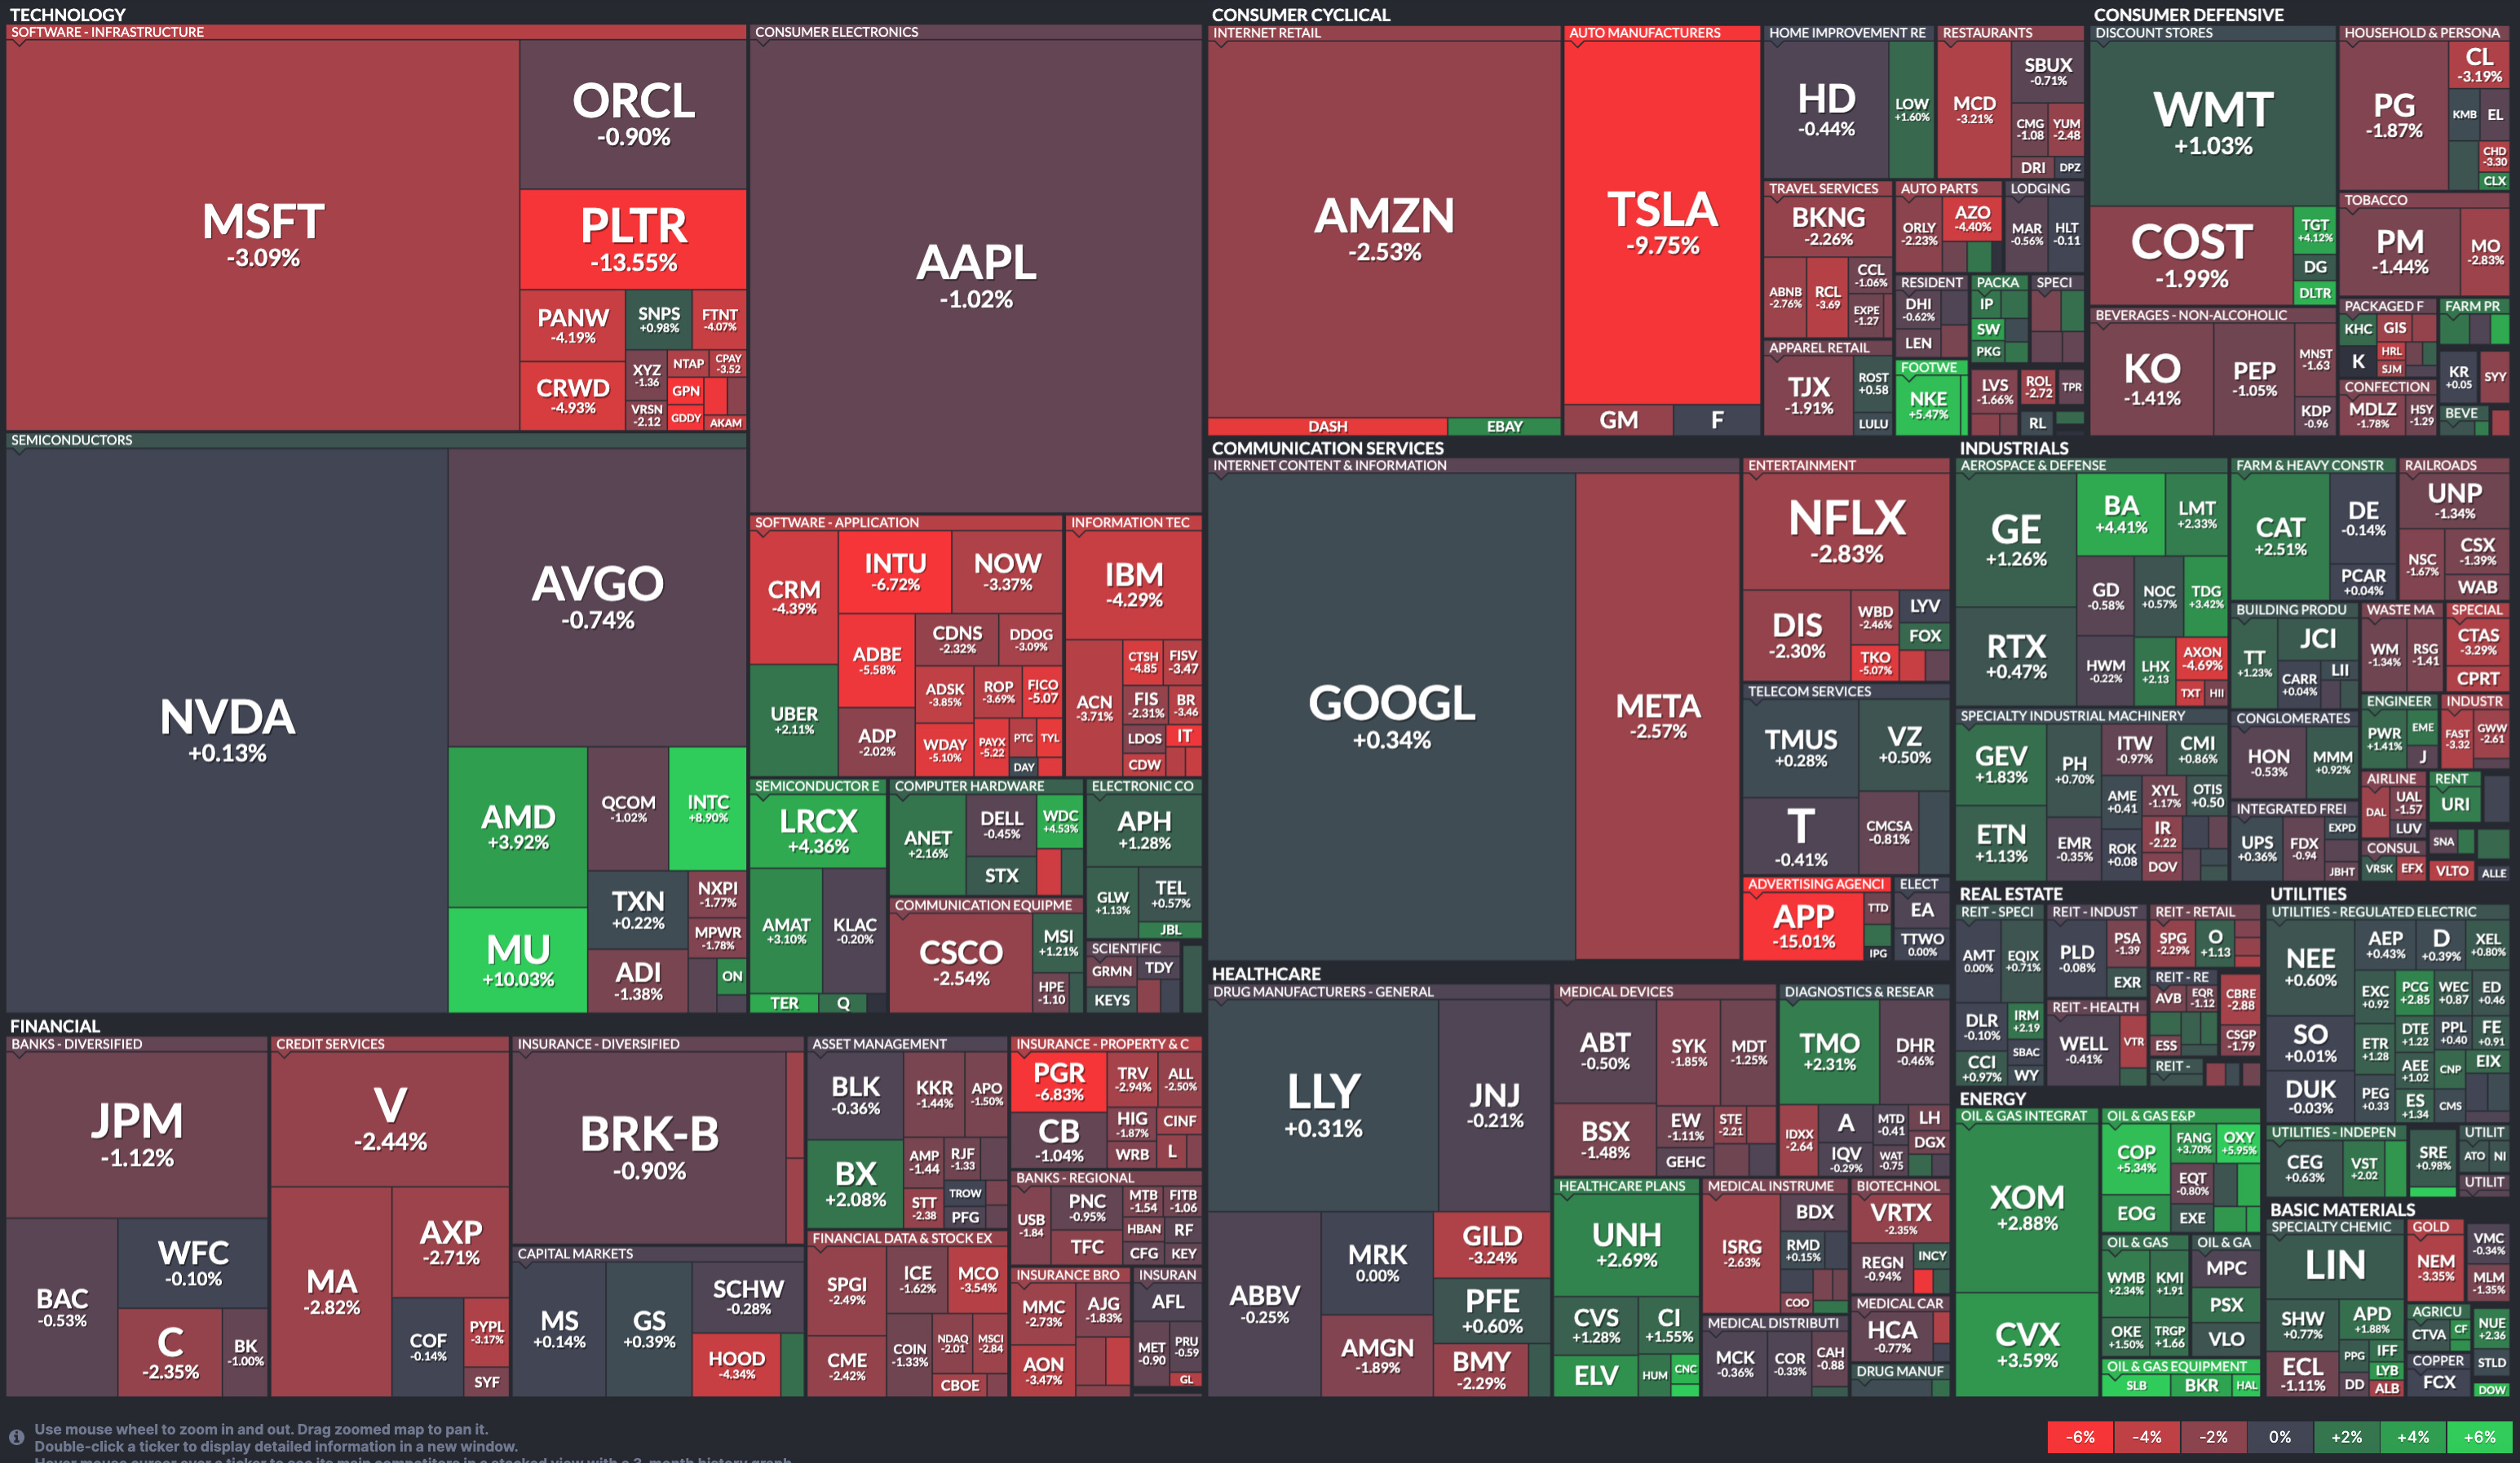
Last week’s market color courtesy of finviz.com
Last week’s best performing US sector: Energy (two biggest holdings: Exxon-Mobil, Chevron) ⬆︎ 3.3% for the week
Last week’s worst performing US sector: Consumer Cyclical (two biggest holdings: Amazon, Tesla) ⬇︎ 3.0% for the week
SPY, a US Large Cap ETF, tracks the S&P 500 index, made up of 500 stocks from a universe of the largest US companies. Its price fell 1.0% last week and ended the week 1.2% below its all-time record closing high (12/24/2025).
IWM, a US Small Cap ETF, tracks the Russell 2000 index, made up of the bottom two-thirds in terms of company size of a universe of 3,000 of the largest US stocks. Its price fell 1.1% last week and ended the week 3.7% below its all-time record closing high (12/10/2025).
VXUS, a Global Non-US ETF, tracks the MSCI ACWI Ex-US index, made up of over 8,500 of the largest names from a universe of stocks issued by companies from around the world excluding the United States, in both developed and emerging markets. Its price rose 0.9% last week and ended the week at its all-time record closing high.
INTEREST RATES:
FED FUNDS RATE * ⬌ 3.625% (unchanged from a week ago)
PRIME RATE ** ⬌ 6.75% (unchanged from a week ago)
3 MONTH TREASURY ⬆︎ 3.65% (3.64% a week ago)
2 YEAR TREASURY ⬆︎ 3.47% (3.46% a week ago)
5 YEAR TREASURY ⬆︎ 3.74% (3.68% a week ago)
10 YEAR TREASURY *** ⬆︎ 4.19% (4.14% a week ago)
20 YEAR TREASURY ⬆︎ 4.81% (4.76% a week ago)
30 YEAR TREASURY ⬆︎ 4.86% (4.81% a week ago)
Data courtesy of the Federal Reserve and the Department of the Treasury as of the market close on Friday
* Decided upon by the Federal Reserve Open Market Committee at periodic meetings 8x a year. Used as a basis for overnight interbank loans and for determining high yield savings interest rates.
** Wall Street Journal Prime Rate as of Friday’s close. Tending to move in lockstep with the Fed Funds Rate, this measure is used as a basis for determining certain consumer loan interest rates such as credit cards, auto loans, personal loans, home equity loans/lines of credit and securities-based lending.
*** Used as a basis for determining mortgage interest rates and some business loans
AVERAGE 30-YEAR FIXED MORTGAGE RATE:
⬇︎ 6.15%
One week ago: 6.18%, one month ago: 6.20%, one year ago: 6.91%
Data courtesy of the Freddie Mac Primary Mortgage Market Survey
INTEREST RATE EXPECTATIONS:
Where will the Fed Funds interest rate be after the next rate-setting meeting on January 28th?
Unchanged from now .. ⬆︎ 83% probability (82% a week ago)
0.25% lower than now .. ⬇︎ 17% probability (18% a week ago)
With eight rate-setting meetings in 2026, what is the most commonly-expected number of 0.25% Fed Funds interest rate cuts this year?
⬌ Two (unchanged from a week ago)
Data courtesy of CME FedWatch Tool
All data based on the Fed Funds interest rate (currently 3.625%). Calculated from Federal Funds futures prices as of the market close on Friday.
PERCENT OF S&P 500 STOCKS ABOVE THEIR OWN 200-DAY MOVING AVERAGE:
⬇︎ 59%
One week ago: 60%, one month ago: 58%, one year ago: 55%
Data courtesy of MacroMicro as of Friday’s market close
This widely-used technical measure of market breadth is considered to be a very robust indicator of the overall health of the S&P 500 index.
A high percentage (above 70%) generally suggests broad market strength and a bullish trend, while a low percentage (below 30%) may indicate market weakness and a bearish trend.
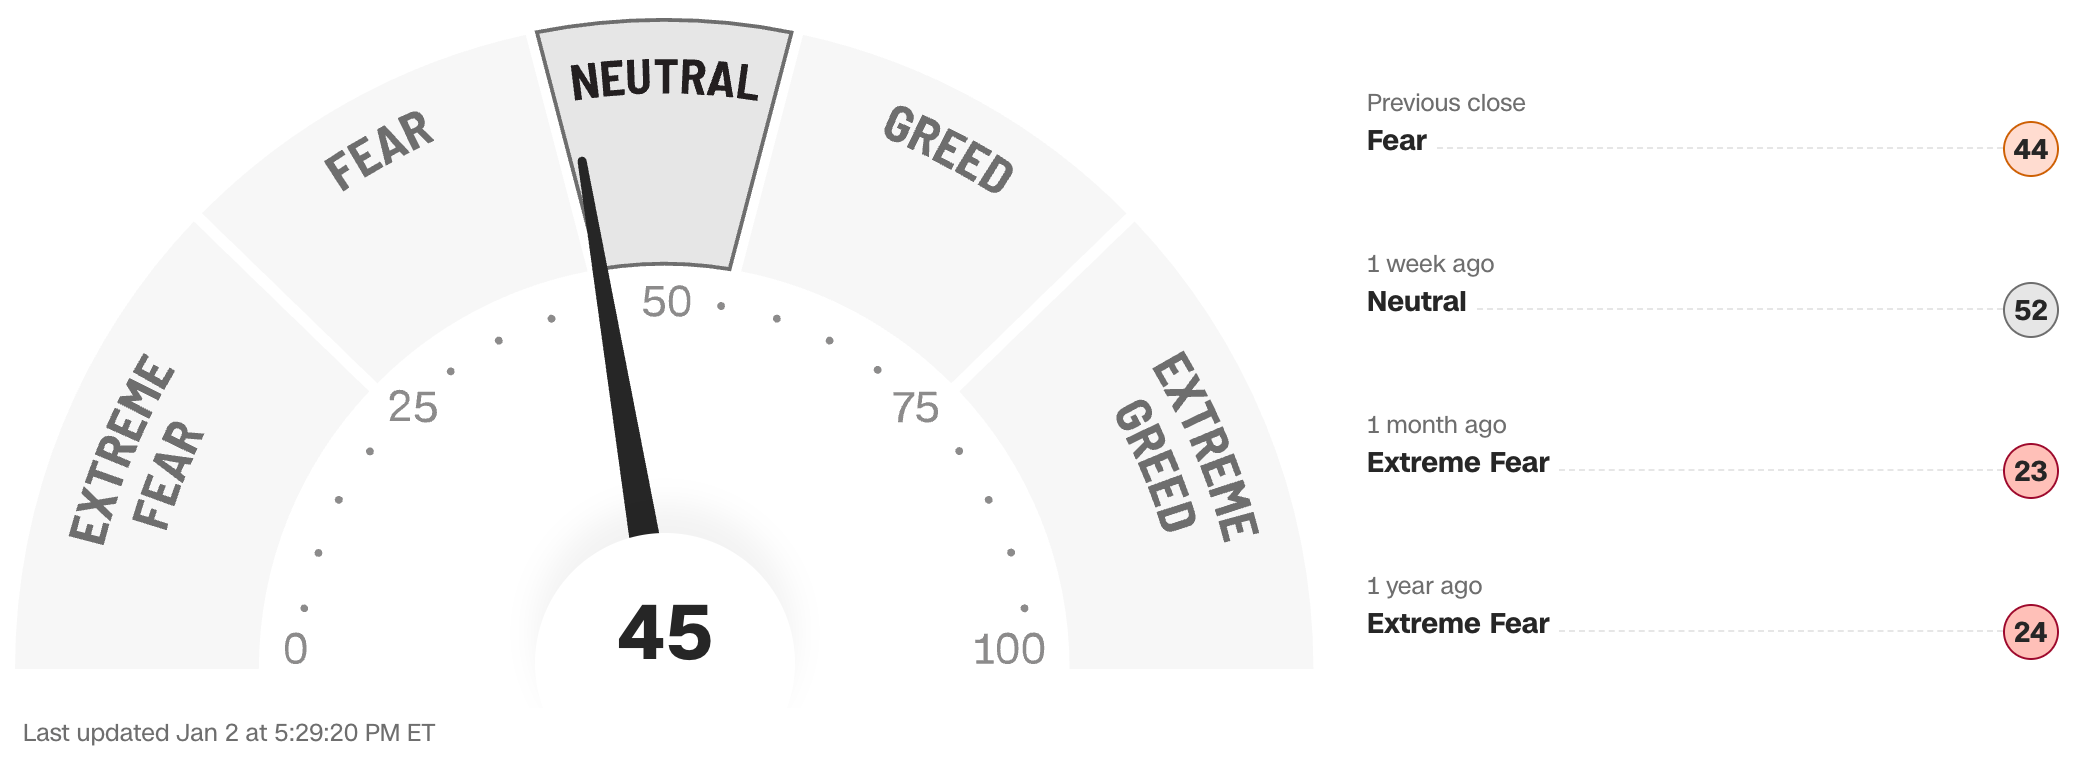
FEAR & GREED INDEX:
“Be fearful when others are greedy and be greedy when others are fearful.” Warren Buffett.
Data courtesy of CNN Business as of Friday’s market close
The Fear & Greed Index from CNN Business can be used as an attempt to gauge whether or not stocks are fairly priced and to determine the mood of the market. It is a compilation of seven of the most important indicators that measure different aspects of stock market behavior. They are: market momentum, stock price strength, stock price breadth, put and call option ratio, junk bond demand, market volatility and safe haven demand.
Extreme Fear readings can lead to potential opportunities as investors may have driven prices “too low” from a possibly excessive risk-off negative sentiment.
Extreme Greed readings can be associated with possibly too-frothy prices and a sense of “FOMO” with investors chasing rallies in an excessively risk-on environment . This overcrowded positioning leaves the market potentially vulnerable to a sharp downward reversal at some point.
A “sweet spot” is considered to be in the lower-to-mid “Greed” zone.
Anglia Advisors recently updated its Privacy Policy. You can view the latest version here.
This material represents a highly opinionated, speculative assessment of the financial market environment based on assumptions and prevailing information and data at a specific point in time and is always subject to change at any time. Although the content is believed to be correct at the time of publication, no warranty of its accuracy or completeness is ever given. It is never to be interpreted as an attempt to forecast any future events, nor does it offer any kind of guarantee whatsoever of future results, circumstances or outcomes.
The material contained herein is not necessarily complete and is also wholly insufficient to be relied upon as research or investment advice or as a sole basis for any financial determinations, including investment decisions or making any kind of consumer choices, without further consultation with Anglia Advisors or other fully-qualified Registered Investment Advisor. The user assumes the entire risk of any decisions made or actions taken based in whole or in part on any of the information provided in this or any other Anglia Advisors published content.
Under no circumstances is any Anglia Advisors’ content ever intended to constitute tax, legal or medical advice and should never be taken as such. Neither the information contained nor any opinion expressed herein constitutes a solicitation for the purchase of any security or asset class. No formal client advice may be rendered by Anglia Advisors unless and until a properly-executed client engagement agreement is in place.
Posts may contain links or references to third party websites or may post data or graphics from them for the convenience and interest of readers. While Anglia Advisors might have reason to believe in the quality of the content provided on these sites, the firm has no control over, and is not in any way responsible for, the accuracy of such content nor for the security or privacy protocols that external sites may or may not employ. By making use of such links, the user assumes, in its entirety, any kind of risk associated with accessing them or making use of any information provided therein.
Those associated with Anglia Advisors, including clients with managed or advised investments, may maintain positions in securities and/or asset classes mentioned in this post.
If you enjoyed this post, why not share it with someone?