


Following a mostly meaningful news-free weekend, markets headed into the last full week of September, historically the worst week of the year for stock prices, with lots of Fed governor speeches lined up including from the president’s manservant Stephen Miran and chairman Powell along with a potentially spicy UN General Assembly (UNGA) in New York and developing concerns about an imminent US government shutdown.
Even so, the S&P 500 and the NASDAQ still managed to push deeper into all-time high territory for a third session in a row on Monday after Nvidia, the indexes’ largest component stock, touched its own new record high price after announcing a $100 billion investment in OpenAI.
Miran parroted all of the president’s talking points about implementing a series of jumbo Fed Funds Interest Rate cuts while implausibly denying that the administration was exercising any influence on him. Trump drew a totally unfounded causal link between child autism and pregnant women’s use of Tylenol and some healthcare stocks wavered in response to the absurd claim that was quickly refuted by medical experts from the US and around the world.
Markets paused for breath on Tuesday morning, awaiting any signals from Powell’s lunchtime speech. As a warm up act, Trump gave his UN audience the big middle finger in a meandering, largely fact-free rant at the UNGA.
More importantly for financial markets, Powell reiterated in his address that there was no risk-free path forward when it comes to interest rate policy and seemed to place equal weight on both inflation and unemployment risk. He also called the stock market “highly valued” and gave no firm assurances of continued rate cuts. Disappointed traders took the indexes substantially lower, driving down tech stocks in particular.
A generally quiet day on the news front on Wednesday provided the opportunity for more profit-taking in the tech sector after the recent run-up. Although a government shutdown would still be more of a political stunt than a market-impacting event, the ever-increasing prospect was starting to unnerve Wall Street, particularly the possibility that the Jobs Report may not even be released this week as a result and the indexes all closed in the red.
Stocks continued their retreat from all-time highs on Thursday after GDP growth was confirmed to be at its highest level for two years, a scorching hot 3.8% for Q2 and jobless claims remained tame, both undermining the case for giant Fed rate cuts to rescue the country from a seemingly non-existent imminent economic disaster.
After the close, Trump - who just weeks ago promised to bring down consumer healthcare costs - decreed a 100% tariff on all imported branded pharmaceutical products beginning on October 1st along with additional levies on another batch of goods from trucks to high national security-risk items such as kitchen cabinets and bathroom vanities.
Wall Street, always a TACO believer, mostly shrugged off the announcement on Friday and was focused more on the PCE inflation reading which came in hovering close to 3.0% as expected and another decline in consumer sentiment. The absence of a nasty upside surprise in the inflation data cheered the stock market and the indexes snapped their three day losing streak but still experienced a small weekly loss for the first time this month.
Market-driven interest rates have only moved upwards since the Fed rate cut on September 17th and this phenomenon persisted last week (see INTEREST RATES below) and mortgage rates have now turned back higher after weeks of consistently dropping (see below).
Last week’s moderate pullback notwithstanding, why have stocks been sizzling while economic conditions feel so depressed for many? There is a powerful three-way tailwind that has sent the indexes to new highs, favoring certain sectors and confirming the accurate old adage that the stock market is not the economy.
Monetary stimulus through ongoing Fed overnight interest rate cuts and hopes that market-driven rates will follow suit further out on the curve
Fiscal stimulus that was solidified and boosted by the tax and spending bill but which only works if there is strong and persistent economic growth
Private stimulus from continued AI enthusiasm and massive related capital expenditure from a handful of companies that are showing consistently strong earnings
As long as this trinity of stimuli remains in place (not guaranteed by any means), there is currently little reason to fear the imminent death of the rally.
However, if growing tariff-fed inflation starts to cramp the Fed’s style when it comes to rate cuts and/or if growth starts to slow and/or if doubts emerge about AI adoption and the associated cap-ex and earnings start to tail off, then the stock market will suddenly be very vulnerable to a pullback or worse and that should not be ignored amidst the currently highly bullish sentiment.
If you are not yet a financial planning or investment management client of Anglia Advisors and would like to explore becoming one, please feel free to reach out to arrange a complimentary no-obligation discovery call with me.
ARTICLE OF THE WEEK ..
150 years of the 60/40 stock/bond portfolio. “The point isn’t how much the 60/40 grew, it’s how much it didn’t lose during downturns”.
.. AND I QUOTE ..
“I want for AI to do my laundry and dishes so that I can do art and writing, not for AI to do my art and writing so that I can do my laundry and dishes.”
Joanna Maciejewska, author
LAST WEEK BY THE NUMBERS:
Last week’s market color courtesy of finviz.com
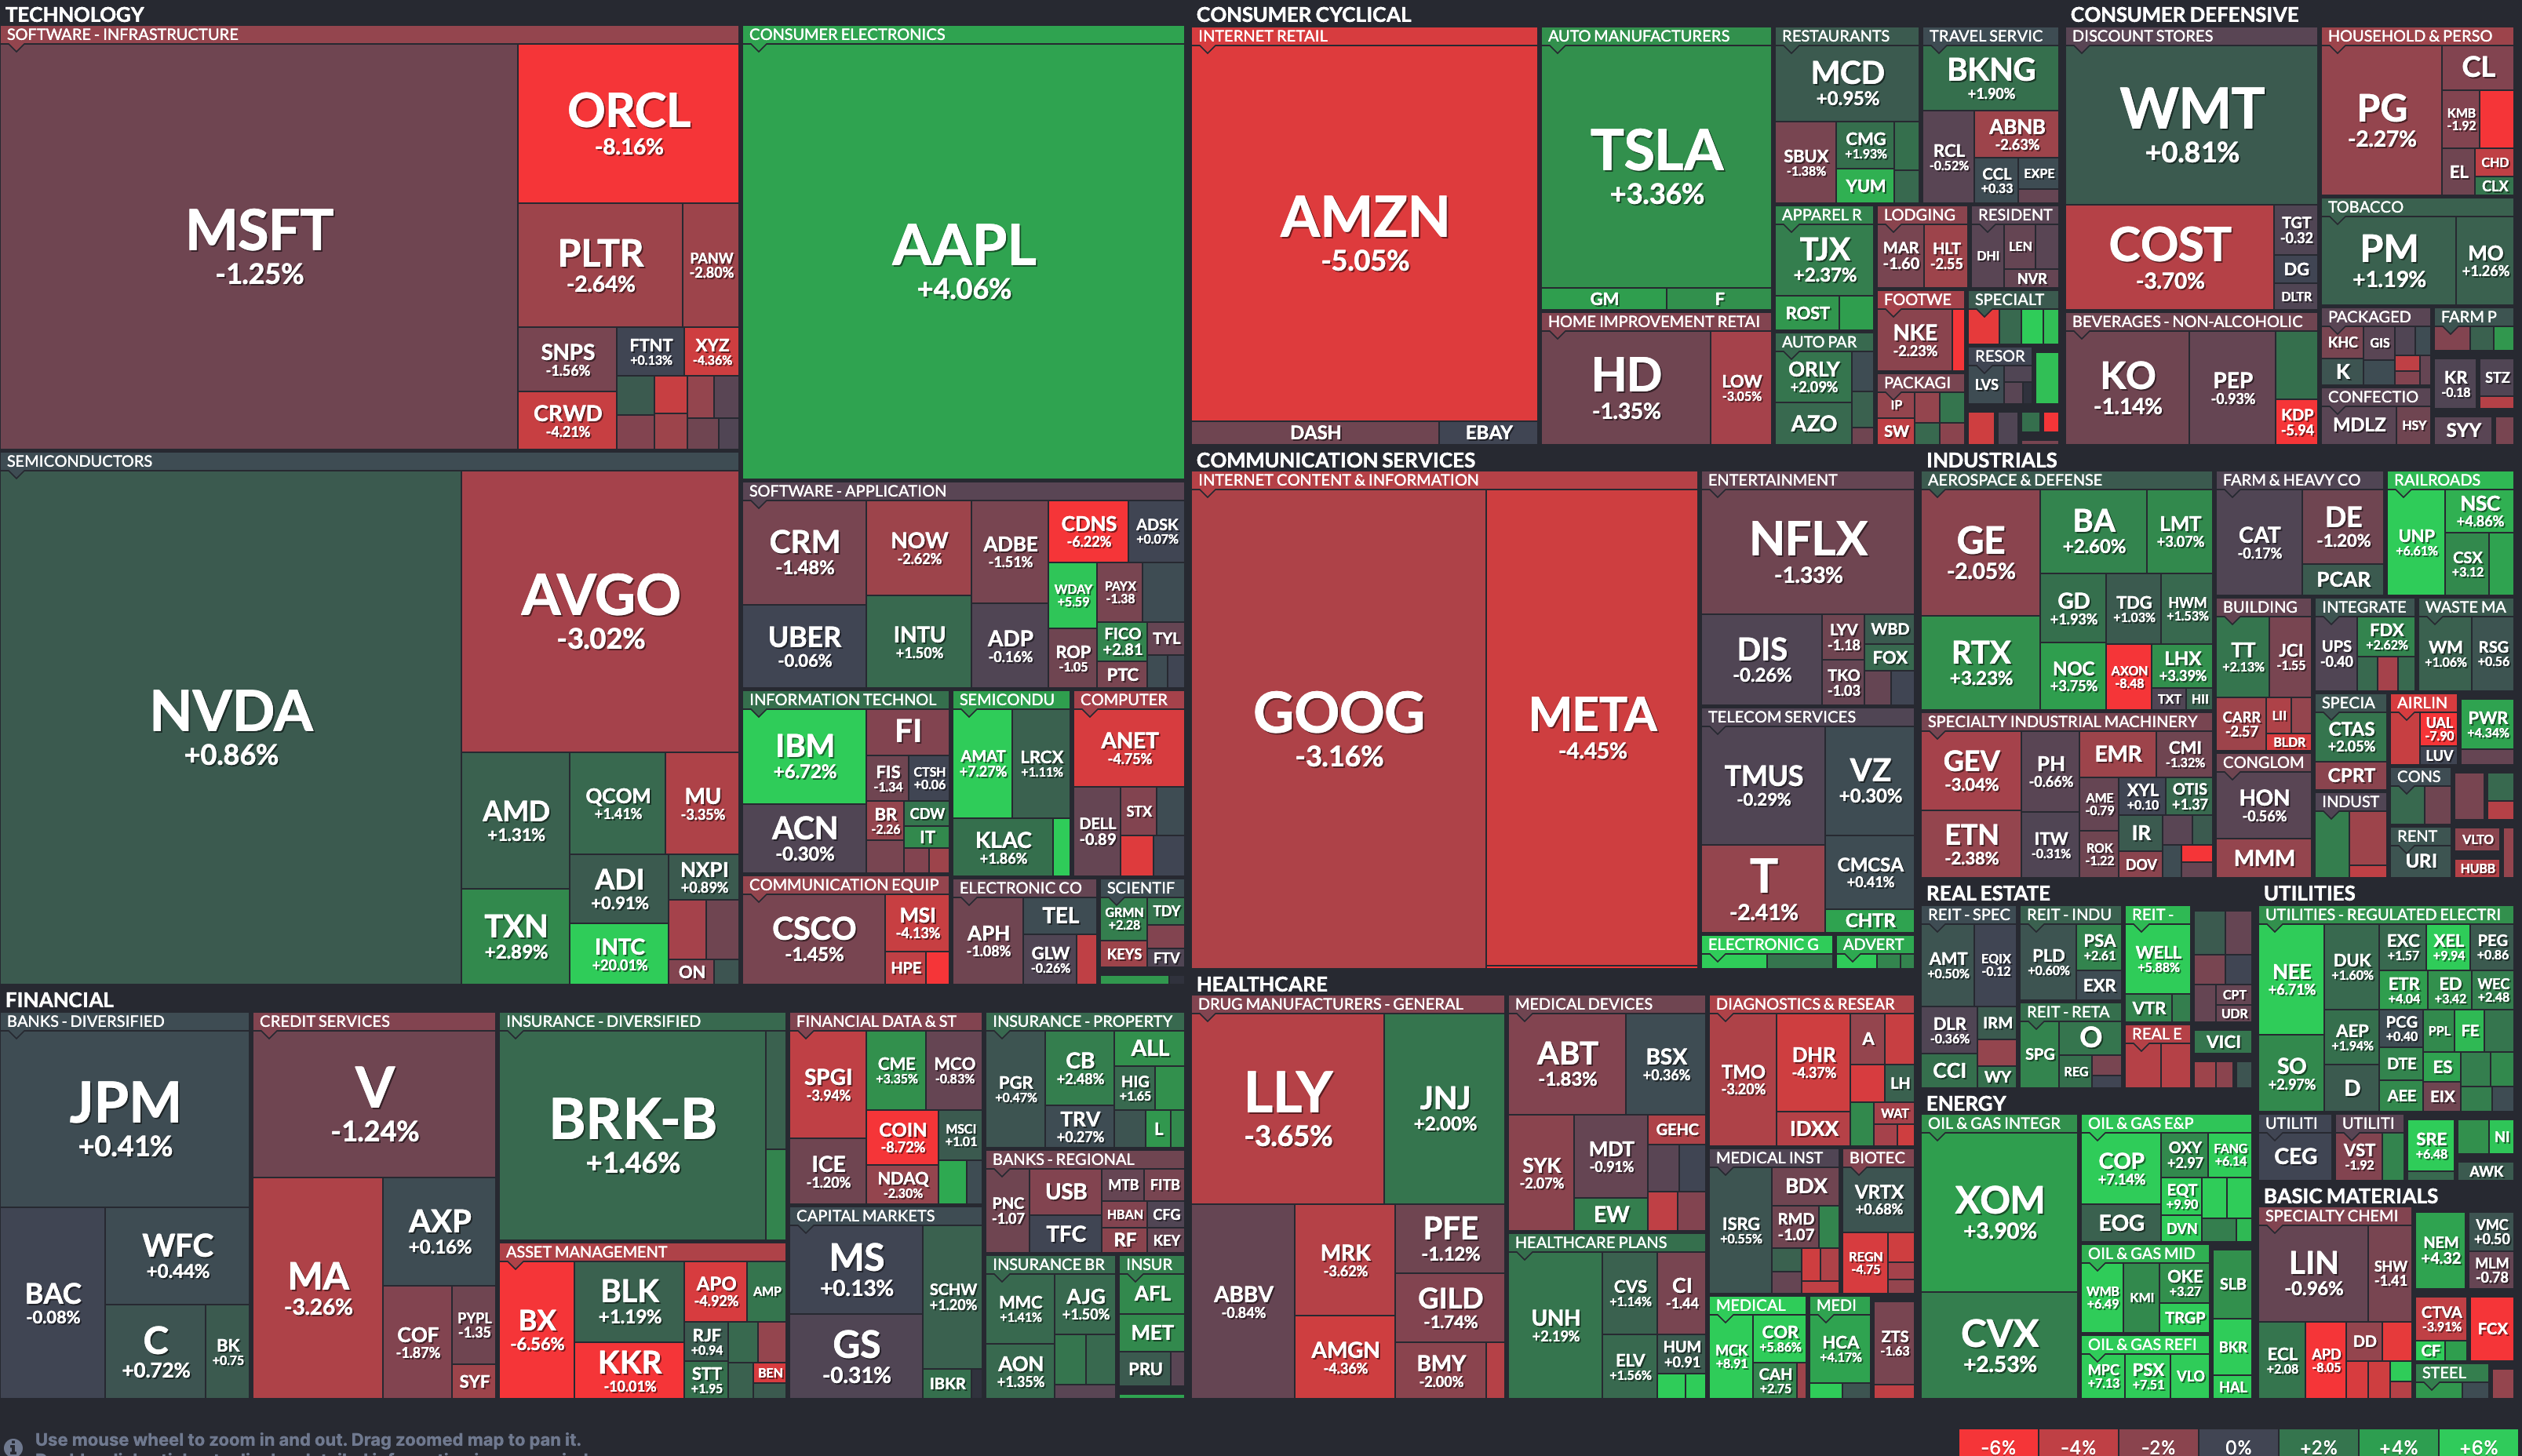
Last week’s best performing US sector: Energy (two biggest holdings: Exxon-Mobil, Chevron) ⬆︎ 3.9% for the week
Last week’s worst performing US sector: Materials (two biggest holdings: Linde, Newmont) ⬇︎ 2.2% for the week
SPY, a US Large Cap ETF, tracks the S&P 500 index, made up of 500 stocks from a universe of the largest US companies. Its price fell 0.3% last week, is up 12.9% so far this year and ended the week 0.8% below its all-time record closing high (09/22/2025).
IWM, a US Small Cap ETF, tracks the Russell 2000 index, made up of the bottom two-thirds in terms of company size of a universe of 3,000 of the largest US stocks. Its price fell 0.7% last week, is up 9.2% so far this year and ended the week 2.4% below its all-time record closing high (09/18/2025).
VXUS, a Global Non-US ETF, tracks the MSCI ACWI Ex-US index, made up of over 8,500 of the largest names from a universe of stocks issued by companies from around the world excluding the United States, in both developed and emerging markets. Its price fell 0.5% last week, is up 23.5% so far this year and ended the week 2.0% below its all-time record closing high (09/22/2025).
INTEREST RATES:
FED FUNDS * ⬌ 4.125% (unchanged)
PRIME RATE ** ⬌ 7.25% (unchanged)
3 MONTH TREASURY ⬇︎ 4.02% (4.03% a week ago)
2 YEAR TREASURY ⬆︎ 3.63% (3.57% a week ago)
5 YEAR TREASURY ⬆︎ 3.76% (3.68% a week ago)
10 YEAR TREASURY *** ⬆︎ 4.20% (4.14% a week ago)
20 YEAR TREASURY ⬆︎ 4.74% (4.71% a week ago)
30 YEAR TREASURY ⬆︎ 4.77% (4.75% a week ago)
Data courtesy of the Federal Reserve and the Department of the Treasury as of the market close on Friday
* Decided upon by the Federal Reserve Open Market Committee. Used as a basis for overnight interbank loans and for determining high yield savings interest rates.
** Wall Street Journal Prime Rate as of Friday’s close. Used as a basis for determining many consumer loan interest rates such as credit cards, personal loans, home equity loans/lines of credit, securities-based lending and auto loans.
*** Used as a basis for determining mortgage interest rates and some business loans
AVERAGE 30-YEAR FIXED MORTGAGE RATE:
⬆︎ 6.30%
One week ago: 6.26%, one month ago: 6.57%, one year ago: 6.08%
Data courtesy of Freddie Mac Primary Mortgage Market Survey
INTEREST RATE EXPECTATIONS:
Where will the Fed Funds interest rate be after the next rate-setting meeting on October 29th?
Unchanged from now .. ⬆︎ 12% probability (8% a week ago)
0.25% lower than now .. ⬇︎ 88% probability (92% a week ago)
With two more Fed rate-setting meetings left in 2025, what is the most commonly-expected number of remaining 0.25% Fed Funds interest rate cuts this year?
⬌ Two (unchanged from a week ago)
Data courtesy of CME FedWatch Tool
All data based on the Fed Funds interest rate (currently 4.125%). Calculated from Federal Funds futures prices as of the market close on Friday.
PERCENT OF S&P 500 STOCKS ABOVE THEIR OWN 200-DAY MOVING AVERAGE:
⬆︎ 62%
One week ago: 60%, one month ago: 64%, one year ago: 80%
Data courtesy of MacroMicro as of Friday’s market close
This widely-used technical measure of market breadth is considered to be a robust indicator of the overall health of the S&P 500 index. A high percentage (above 70%) generally suggests broad market strength and a bullish trend, while a low percentage (below 30%) may indicate market weakness and a bearish trend.
FEAR & GREED INDEX:
“Be fearful when others are greedy and be greedy when others are fearful.” Warren Buffet.
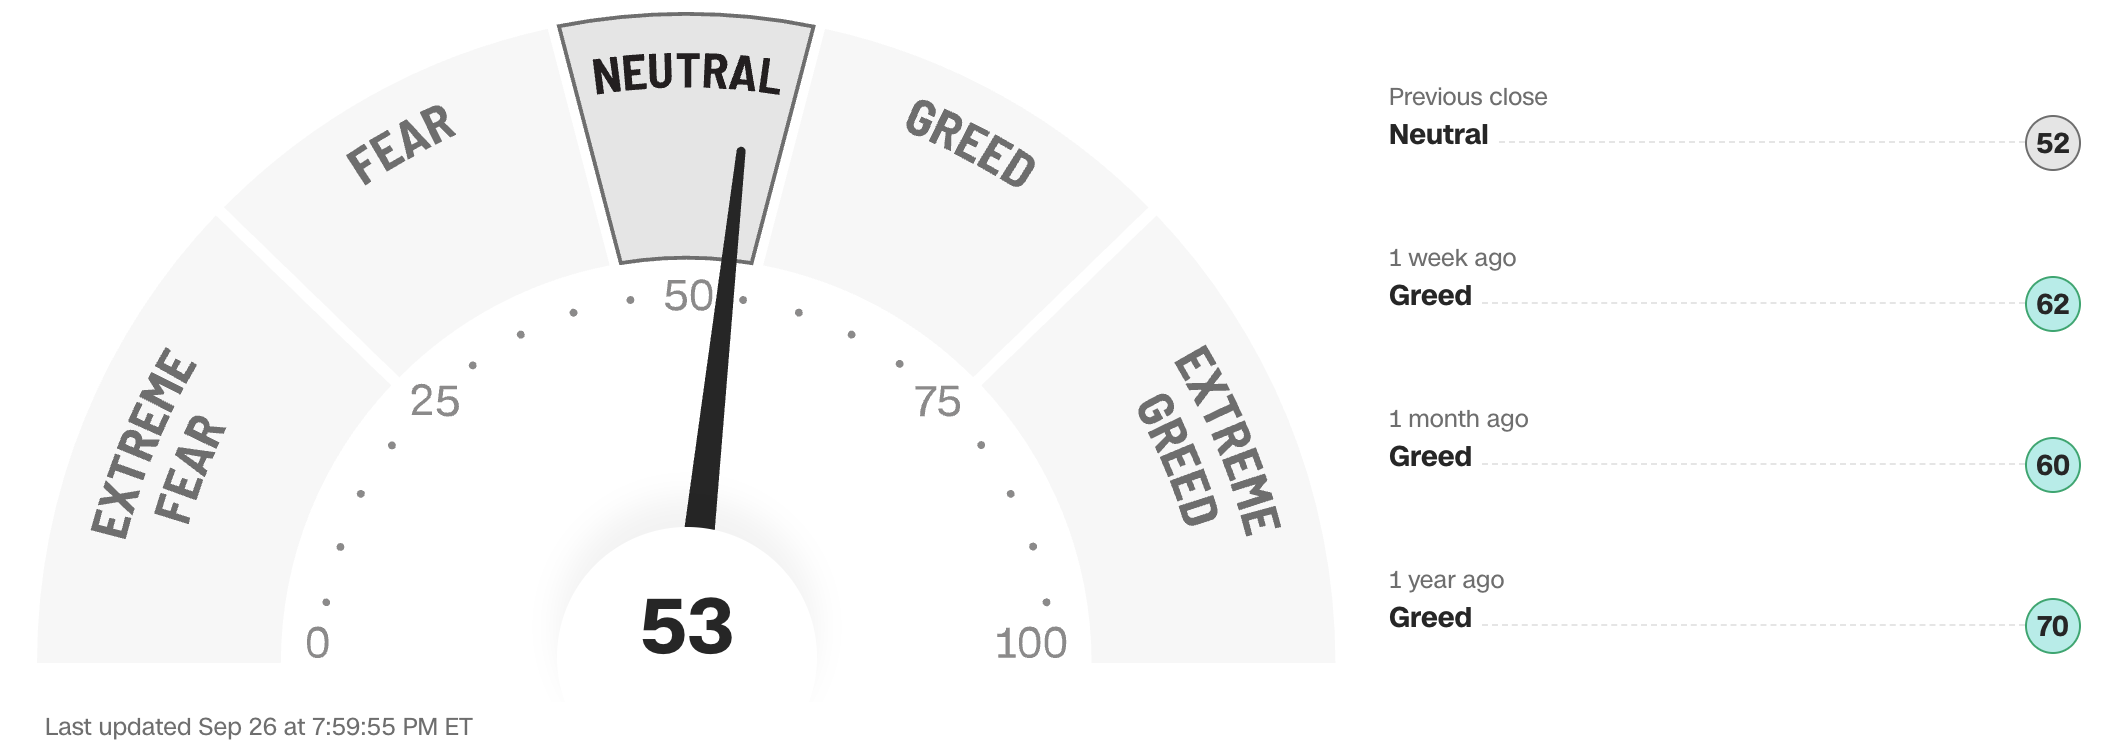
Data courtesy of CNN Business as of Friday’s market close
The Fear & Greed Index from CNN Business can be used as an attempt to gauge whether or not stocks are fairly priced and to determine the mood of the market. It is a compilation of seven of the most important indicators that measure different aspects of stock market behavior. They are: market momentum, stock price strength, stock price breadth, put and call option ratio, junk bond demand, market volatility and safe haven demand.
Extreme Fear readings can lead to potential opportunities as investors may have driven prices “too low” from a possibly excessive risk-off negative sentiment.
Extreme Greed readings can be associated with possibly too-frothy prices and a sense of “FOMO” with investors chasing rallies in an excessively risk-on environment . This overcrowded positioning leaves the market potentially vulnerable to a sharp downward reversal at some point.
A “sweet spot” is considered to be in the lower-to-mid “Greed” zone.
Note: Anglia Advisors has updated its Privacy Policy. You can view the latest version here.
WWW.ANGLIAADVISORS.COM | SIMON@ANGLIAADVISORS.COM | CALL OR TEXT: (646) 286 0290 | FOLLOW ANGLIA ADVISORS ON INSTAGRAM
This material represents a highly opinionated, speculative assessment of the financial market environment based on assumptions and prevailing information and data at a specific point in time and is always subject to change at any time. Although the content is believed to be correct at the time of publication, no warranty of its accuracy or completeness is ever given. It is never to be interpreted as an attempt to forecast any future events, nor does it offer any kind of guarantee whatsoever of future results, circumstances or outcomes.
The material contained herein is not necessarily complete and is also wholly insufficient to be relied upon as research or investment advice or as a sole basis for any financial determinations, including investment decisions or making any kind of consumer choices, without further consultation with Anglia Advisors or other fully-qualified Registered Investment Advisor. The user assumes the entire risk of any decisions made or actions taken based in whole or in part on any of the information provided in this or any other Anglia Advisors published content.
Under no circumstances is any Anglia Advisors’ content ever intended to constitute tax, legal or medical advice and should never be taken as such. Neither the information contained nor any opinion expressed herein constitutes a solicitation for the purchase of any security or asset class. No formal client advice may be rendered by Anglia Advisors unless and until a properly-executed client engagement agreement is in place.
Posts may contain links or references to third party websites or may post data or graphics from them for the convenience and interest of readers. While Anglia Advisors might have reason to believe in the quality of the content provided on these sites, the firm has no control over, and is not in any way responsible for, the accuracy of such content nor for the security or privacy protocols that external sites may or may not employ. By making use of such links, the user assumes, in its entirety, any kind of risk associated with accessing them or making use of any information provided therein.
Those associated with Anglia Advisors, including clients with managed or advised investments, may maintain positions in securities and/or asset classes mentioned in this post.
If you enjoyed this post, why not share it with someone?


