



The US/Iran ceasefire memorandum is obviously in tatters. Iran closed the Strait of Hormuz, prompting a reinstatement of the blockade by Trump who also briefly proposed an idea to create his own toll system to pocket 20% from all shipping traffic (within 24 hours, he was forced to clumsily back-track on this bonkers plan). The US carried out more air strikes, prompting a resumption of Iranian attacks on multiple military targets throughout the region.
Financial markets have not so far priced in any outcome other than the conflict being comfortably in the rear-view mirror very soon. If the certainty behind this conviction were to begin to crumble, there could be an urgent need to reprice risk assets lower and this significant escalation over the weekend drove up energy prices and interest rates and sent overseas stocks reeling on Monday, particularly in the highly volatile South Korean market.
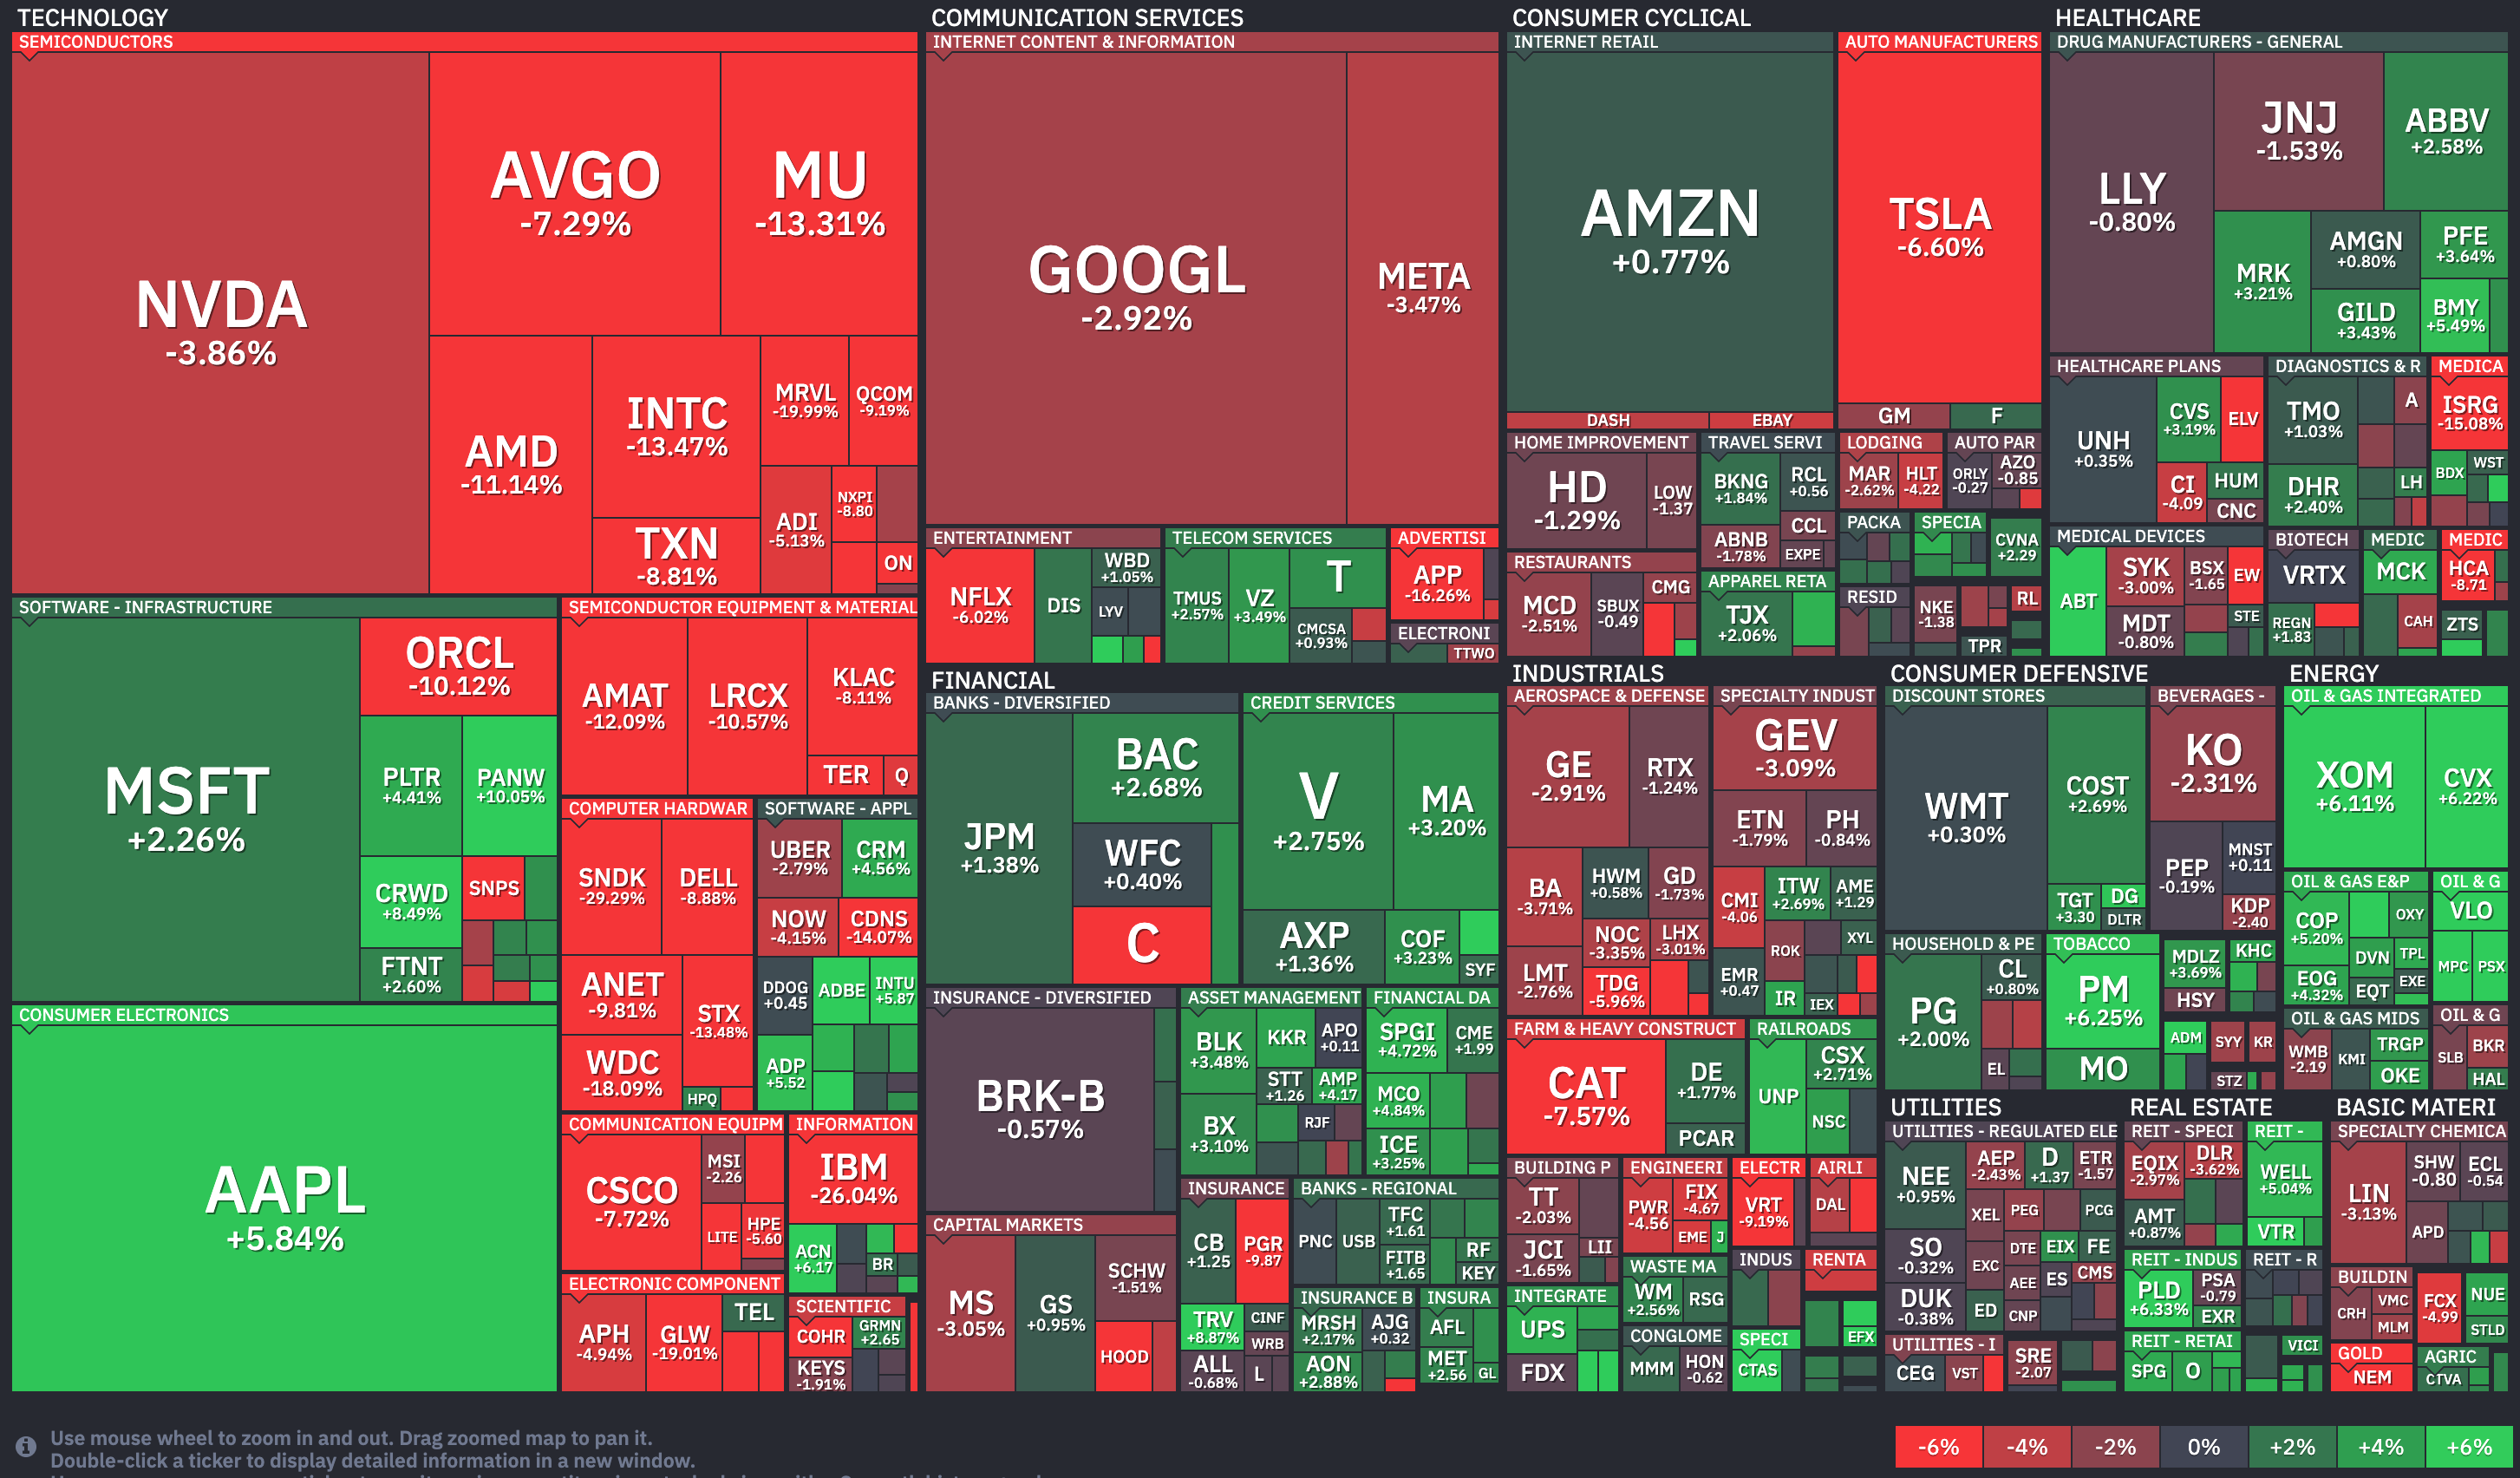
Wall Street took stock prices lower in a more orderly fashion over the course of the session, the decline led by Tech/AI names but without the whiff of panic that was sensed in parts of Asia.
Sky-high expectations means that simply beating Q2 earnings estimates is not necessarily good enough any more and misses are being severely punished. As an example, Citibank and GE’s stock prices fell back despite very solid reports.
On the other hand, IBM was slaughtered on Tuesday after a disappointing report, losing a quarter of its total value after enduring its biggest one-day percentage price dive since “Hey Jude” (which just enjoyed a revival among us recently-devastated English soccer fans) topped the charts in 1968. IBM’s customers are turning away from the 115-year old juggernaut to younger, more nimble AI companies.
However, Goldman Sachs, JPMorgan and Wells Fargo all smashed through estimates by enough to move higher, in some cases to new all-time record highs.
CPI retail inflation for June dropped to 3.50% annualized, reflecting last month’s fall in oil prices. This eased some of the fears about a Fed Funds Rate hike on July 29th (see INTEREST RATE EXPECTATIONS below) which drove interest rates back down across the board and stocks reacted positively, closing nicely higher.
PPI wholesale inflation data released on Wednesday reinforced the CPI numbers by pulling back from recent highs. Morgan Stanley, BlackRock and Bank of New York joined the ballooning list of financial firms issuing spectacular earnings, helping to somewhat offset market concerns about the chaotically deteriorating geopolitical situation in the Middle East, fueled by increasingly intense threats of violence from Trump. The indexes hugged the flatline all session and closed little changed.
Americans still can’t stop spending as shown by the Retail Sales release on Thursday morning which was the cherry on top of a very strong week of data.
However, the indexes drifted lower again over the course of the day on intensifying chip/AI stock weakness and a growing sense that an increasingly erratic Trump may be losing whatever control he felt he had left over the Iran war and that the market’s previous assumptions about a swift, clean end to the conflict may now need to be recalibrated.
In a weird, rambling address to the nation on Thursday night, Trump made wild and unsubstantiated claims about electoral fraud including directly accusing China of hacking, data theft and interference just a few weeks before his scheduled meeting with Chinese premier Xi in Washington DC. He also found time to include a highly misleading plug for his largely unimpressive Trump Child Accounts.
China remained in focus on Friday with the unveiling of Kimi K3, a potentially serious competitor to the likes of Nvidia, Broadcom, OpenAI, Anthropic and the rest. Asian markets dumped and what had been a selloff in chip/AI names on Wall Street quickly turned into a rout as traders rushed to exit the exact same positions that had driven the major Q2 rally.
This was enough to tip the chipmaker stock index into an official bear market as the NASDAQ got battered, not helped by a disappointing Netflix earnings report and subsequent share price plunge for the major index component. The S&P 500 got off a little more lightly, but still dropped to close near its lows of the day to finish up a losing week.
If you are not yet a financial planning or investment management client of Anglia Advisors and would like to explore becoming one, please feel free to reach out to arrange a complimentary no-obligation discovery call with me.
ARTICLE OF THE WEEK ..
It’s time to completely rethink the financial value of home ownership.
.. AND I QUOTE ..
“Inflation has been too high, for too long and does not appear to be on track all the way back to 2% [the Fed’s official target]. The inflation risks are to the upside.”
Lorie Logan, Dallas Federal Reserve President and FOMC voting member
LAST WEEK BY THE NUMBERS:
Last week’s S&P 500 market color courtesy of finviz.com
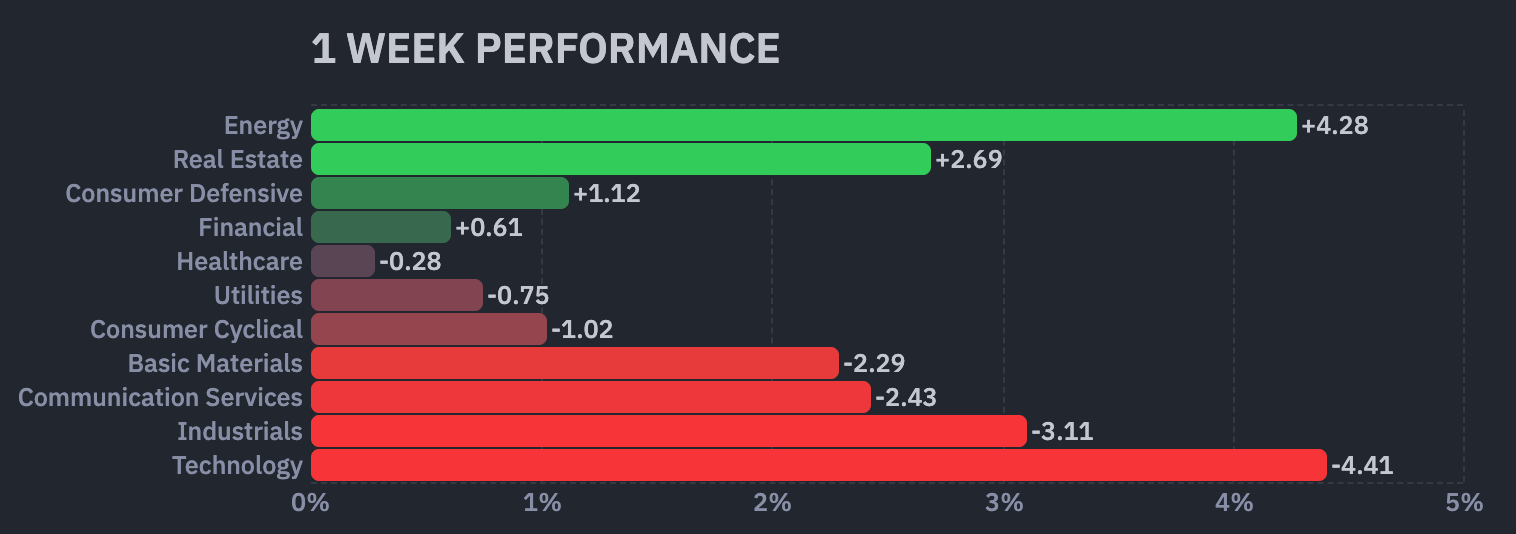
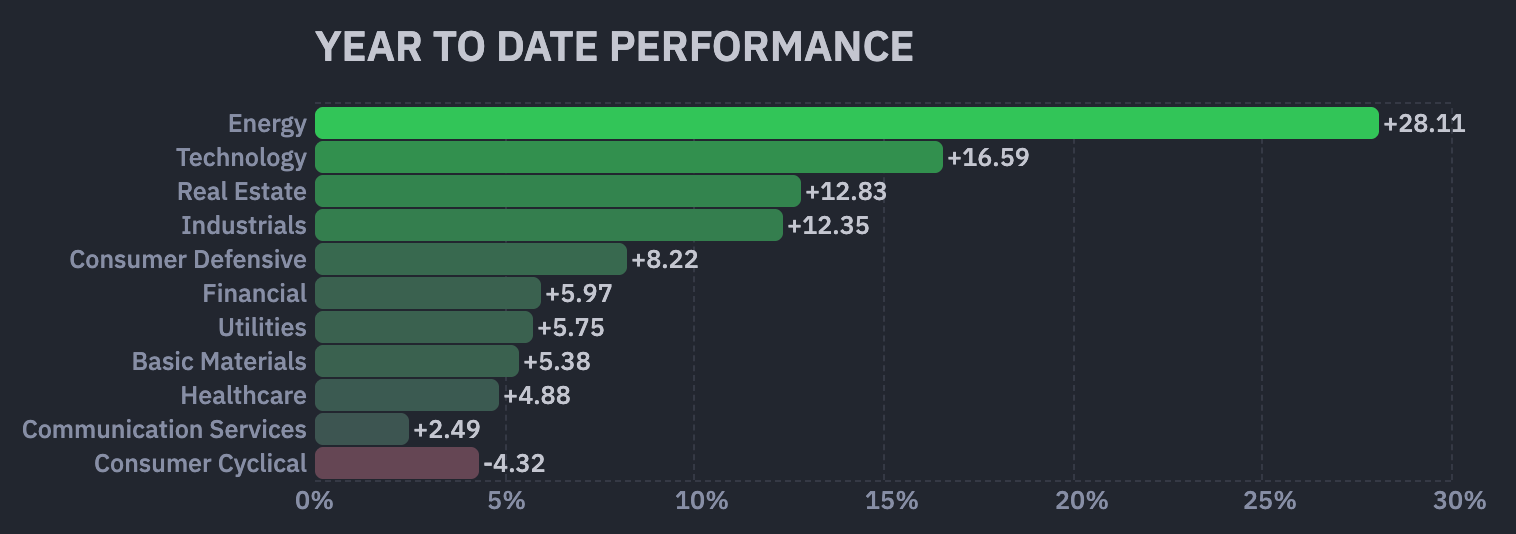
SPY, a US Large Cap ETF, tracks the S&P 500 index, made up of 500 stocks from a universe of the largest US companies. It fell 1.3% last week, is higher by 4.9% over the last three months and is up 9.6% so far this year.
IWM, a US Small Cap ETF, tracks the Russell 2000 index, made up of the bottom two-thirds in terms of company size of a universe of 3,000 of the largest US stocks. It fell 0.5% last week, is higher by 6.9% over the last three months and is up 19.9% so far this year.
VXUS, an International Non-US ETF, tracks the MSCI ACWI Ex-US index, made up of over 8,500 of the largest names from a universe of stocks issued by companies from around the world excluding the United States, in both developed and emerging markets. It fell 1.2% last week, is unchanged over the last three months and is up 11.1% so far this year.
Data shown is total return (including dividends)
INTEREST RATES:
FED FUNDS RATE * 3.625% (unchanged from a week ago)
PRIME RATE ** 6.75% (unchanged from a week ago)
3 MONTH TREASURY 3.85% (3.85% a week ago)
2 YEAR TREASURY 4.18% (4.21% a week ago)
5 YEAR TREASURY 4.28% (4.30% a week ago)
10 YEAR TREASURY *** 4.55% (4.56% a week ago)
20 YEAR TREASURY 5.07% (5.08% a week ago)
30 YEAR TREASURY 5.06% (5.06% a week ago)
Data courtesy of the Federal Reserve and the Department of the Treasury as of Friday’s market close.
* Decided upon by the Federal Reserve Open Market Committee at periodic meetings 8x a year. Used as a basis for overnight interbank loans and for determining high yield savings interest rates.
** Wall Street Journal Prime Rate as of Friday’s close. Tending to move in lockstep with the Fed Funds Rate, this measure is used as a basis for determining certain consumer loan interest rates such as credit cards, auto loans, personal loans, home equity loans/lines of credit and securities-based lending.
*** Used as a basis for determining mortgage interest rates.
AVERAGE 30-YEAR FIXED MORTGAGE RATE:
6.55%
One week ago: 6.49%, one month ago: 6.38%, one year ago: 6.75%
Data courtesy of the Federal Reserve Bank of St. Louis.
INTEREST RATE EXPECTATIONS:
Where will the Fed Funds interest rate be after the next rate-setting meeting on July 29th?
0.25% higher than now .. 13% probability (34% a week ago)
Unchanged from now .. 87% probability (66% a week ago)
0.25% lower than now .. 0% probability (0% a week ago)
With four more rate-setting meetings this year, what is the most commonly-expected number of remaining Fed Funds interest rate changes in 2026?
One increase, 43% probability (a week ago: one increase, 38% probability)
Data courtesy of the CME FedWatch Tool and is derived from futures market pricing as of Friday’s market close based on the current Fed Funds interest rate of 3.625%.
PERCENT OF S&P 500 STOCKS ABOVE THEIR OWN 200-DAY MOVING AVERAGE:
66%
One week ago: 66%, one month ago: 57%, one year ago: 42%
Data courtesy of barchart.com as of Friday’s market close.
This widely-used technical measure of market breadth is considered to be a very robust indicator of the overall health of the S&P 500 index.
A high percentage (above 70%) generally suggests broad market strength and a bullish trend, while a low percentage (below 30%) may indicate market weakness and a bearish trend.
FEAR & GREED INDEX:
“Be fearful when others are greedy and be greedy when others are fearful.” Warren Buffett.
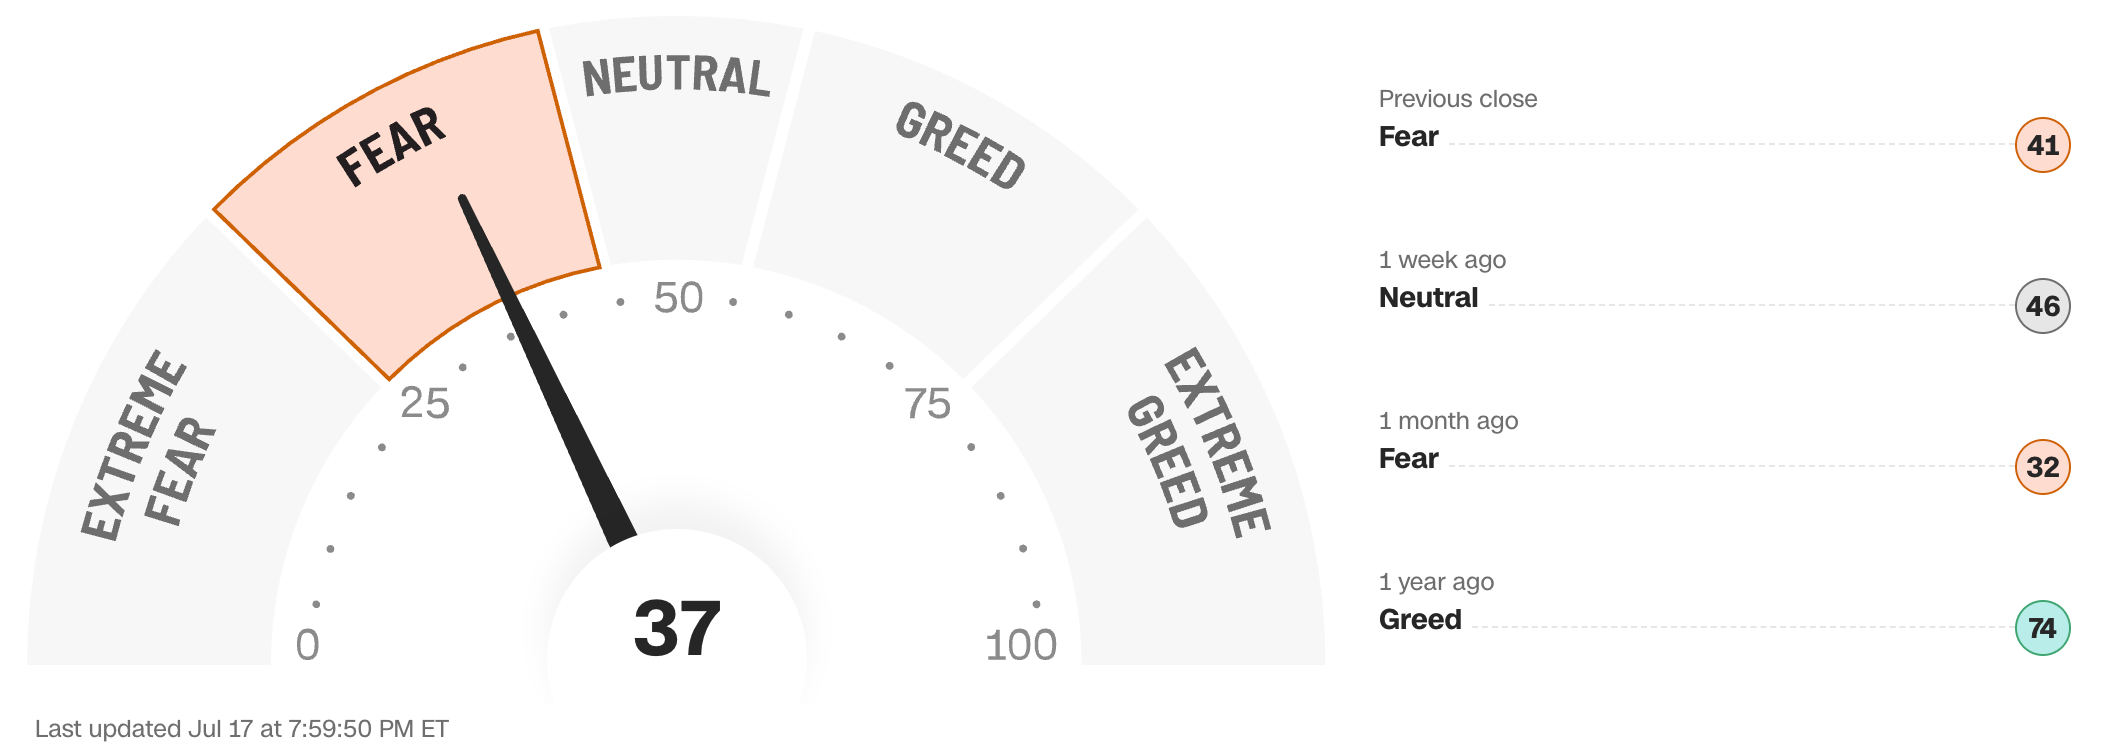
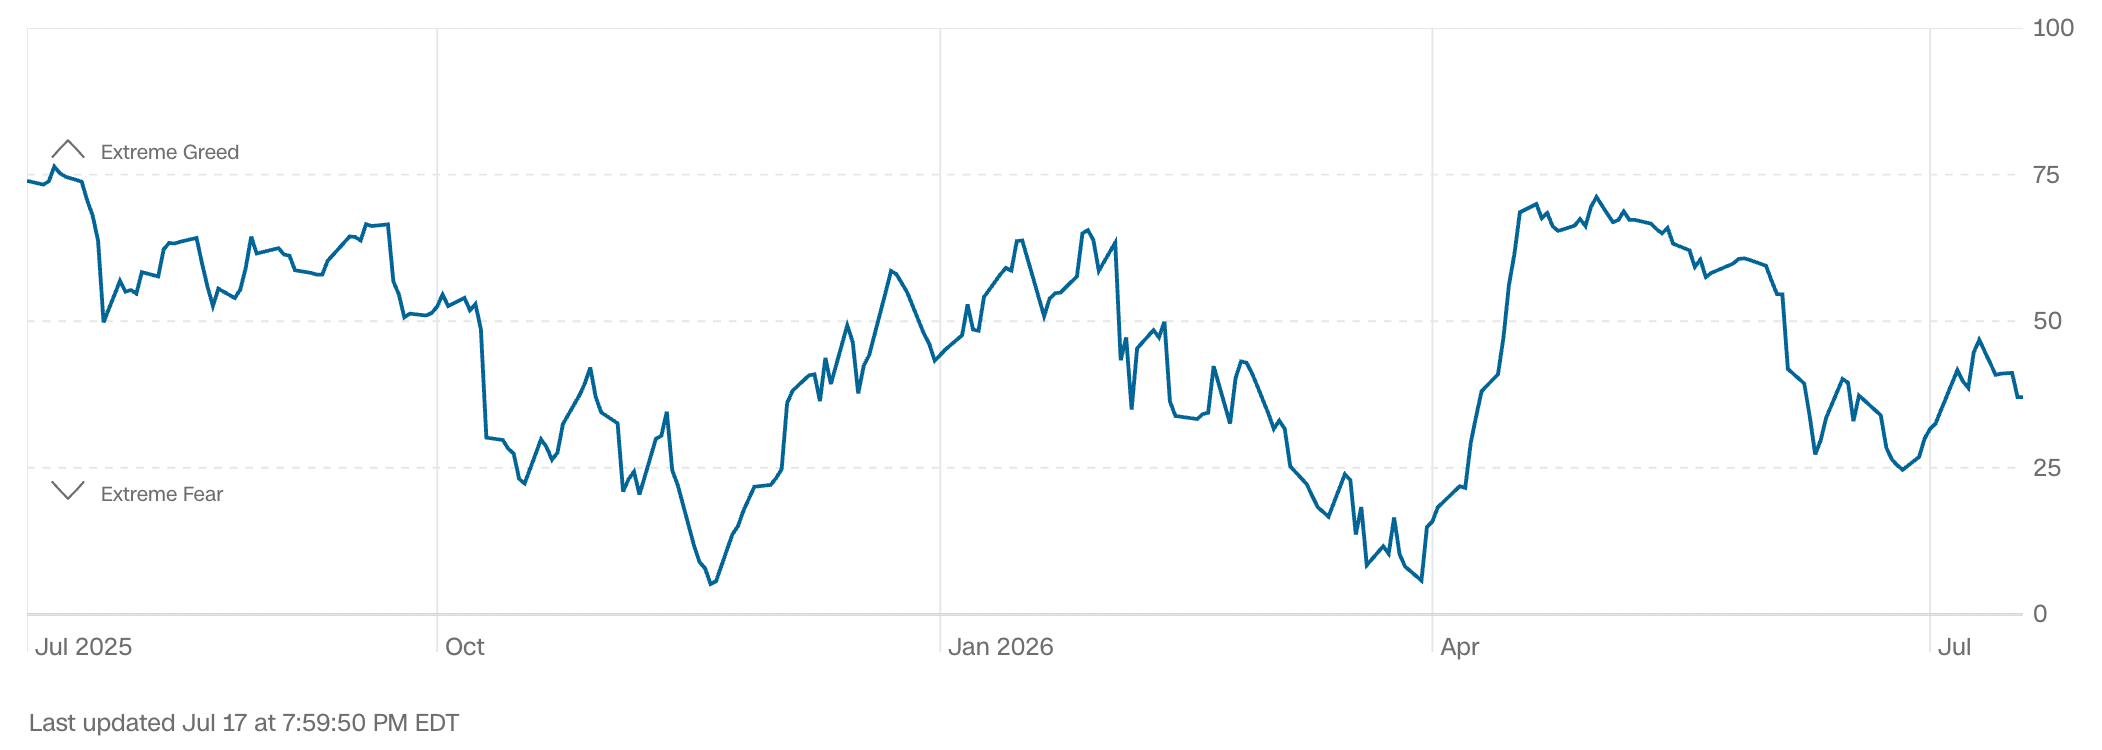
Data courtesy of CNN Business as of Friday’s market close.
The Fear & Greed Index from CNN Business can be used as an attempt to gauge whether or not stocks are fairly priced and to determine the mood of the market. It is a compilation of seven of the most important indicators that measure different aspects of stock market behavior. They are: market momentum, stock price strength, stock price breadth, put and call option ratio, junk bond demand, market volatility and safe haven demand.
Extreme Fear readings can lead to potential opportunities as investors may have driven prices “too low” from a possibly excessive risk-off negative sentiment.
Extreme Greed readings can be associated with possibly too-frothy prices and a sense of “FOMO” with investors chasing rallies in an excessively risk-on environment . This overcrowded positioning leaves the market potentially vulnerable to a sharp downward reversal at some point.
WWW.ANGLIAADVISORS.COM | SIMON@ANGLIAADVISORS.COM | CALL OR TEXT: (646) 286 0290 | FOLLOW ANGLIA ADVISORS ON INSTAGRAM


