


Trump decided over the weekend that he“didn’t like” Iran’s response to the US proposal to end the conflict but yet again there was little of substance regarding the war for Wall Street to focus on, with markets continuing to view the situation as slowly trending towards some kind of ceasefire.
The Strait of Hormuz has been closed for ten weeks now with no prospect of reopening, a once-unthinkable shock to the world economy and yet the oil price came into the week still well below the high of $140 seen in 2022 (Russia/Ukraine) and global stocks at all-time highs.
US stocks hovered around those highs at the open on Monday with Trump describing the current pause in Middle East hostilities as being “on life support” and continued rising energy prices keeping a lid on the recent melt-up, but the indexes still managed to inch forward a touch. Hence, more new all-time record levels.
The latest CPI report on Tuesday morning was the first to fully include higher fuel costs brought about by the war and inevitably showed another big leap in retail inflation to 3.8% annualized, closing in on double the Fed’s 2% target (which it hasn’t met for five years now). Gas prices are up by 28% from a year ago and airfares by 21%. Notably, retail prices are now rising at a faster rate than wages.
Interest rates shifted upwards on the vanishing prospect of any rate cuts at all in 2026 or early 2027. Indeed, an increase in the Fed Funds Rate this year is now priced as being more likely than a rate cut. Wall Street winced at the data and the indexes pulled back and interest rates jumped.
Trump arrived in Beijing on Wednesday morning for a meeting with Chinese premier Xi after bizarrely telling journalists; “I don’t think about Americans’ financial situations”.
Kevin Warsh was waived through Congress as the next Fed chairman and was immediately confronted with a big problem. CPI’s baby brother, PPI, was released pre-market and came in red hot, indicating a jaw-dropping jump from 4.3% to 6.0% in the annualized wholesale rate of inflation.
The bond market was shocked and drove up medium and longer term interest rates. The 30-year Treasury rate blasted through 5.00% to its highest level since 2007, before the Great Financial Crisis. Stocks, however, took things in stride and tech stock traders in particular stepped in to buy Tuesday’s dip, pushing the indexes into the green and back to yet more record highs.
By the time markets opened on Thursday, all that had come out of China was meaningless drivel about partnership and obscure references to Confucius and Abraham Lincoln. Of far more interest was the latest Retail Sales data which showed continued steady, if not profligate, spending by the US consumer.
Despite the continued lack of anything interesting emanating from Beijing, stocks continued to move relentlessly higher, helped by a spectacular earnings report from Cisco. The major indexes reached their third set of all-time record highs of the week with the S&P 500 closing above 7500 for the first time ever and even the silly old dinosaur index that is inexplicably still followed by some people, the Dow Jones Industrial Average, broke through 50,000.
The complete nothing-burger that was the Trump/Xi summit came to an end on Friday with muddled messaging from the US delegation and no apparent progress on Iran or tariffs. After a horror-show of a trading session in Europe with stocks and bonds plunging as local interest rates reached multi-decade highs and continued rising energy prices, US equity indexes cooled off as stock traders finally joined bond traders in fretting about inflation risk and took a lot of money off the table.
Some other things I’m thinking about ..
I think it’s important to identify and recognize what could go wrong here for stock markets. To be clear, these are possible scenarios, not predictions ..
Fed hikes interest rates: For the first time in years, the market-driven probability of a Fed Fund Rate increase by year-end is now higher than that of a cut as inflation continues to be a major and growing problem, fueled by tariffs and the oil price shock. A forced rate-hiking campaign could cause a major economic slowdown. The last time the Fed had to raise rates to control inflation in 2022, stocks dumped by more than 20%.
Stagflation materializes: It is the expected duration rather than the intensity of high inflation that matters. The longer energy prices stay high, the more entrenched elevated inflation will become, fueling possible stagflation and unlike in COVID-times, there will be no stimulus checks this time to help offset it.
The AI boom goes bust: Earnings reports have indicated colossal AI spending from a narrow group of tech companies that is potentially driving wider economic and corporate growth. If that expenditure were to be forcibly slowed due to poor investment returns, then the platform upon which a three-and-a-half year rally has been built could begin to crumble and many other sectors might be adversely impacted.
None of these three risks are imminent and the market is fundamentally strong. But stocks can go down, sometimes sustainably and I don’t want clients to be blindsided if it happens. Absent some kind of exogenous shock, any major decline is likely to be the result of one or more of these factors.
If you are not yet a financial planning or investment management client of Anglia Advisors and would like to explore becoming one, please feel free to reach out to arrange a complimentary no-obligation discovery call with me.
ARTICLE OF THE WEEK ..
“Your ability to take risk throughout your financial life will be influenced by three primary factors—your age, your liabilities and your level of wealth. As each increases, you should naturally want to take less risk.”
Maybe counterintuitive? Yes. Very sensible? Also yes. Important advice from Ritholtz’s Nick Maggiulli.
.. AND I QUOTE ..
“Risk management is less about how you respond to risk and more about recognizing how many things can go wrong before they actually do.”
Morgan Housel, partner at The Collaborative Fund.
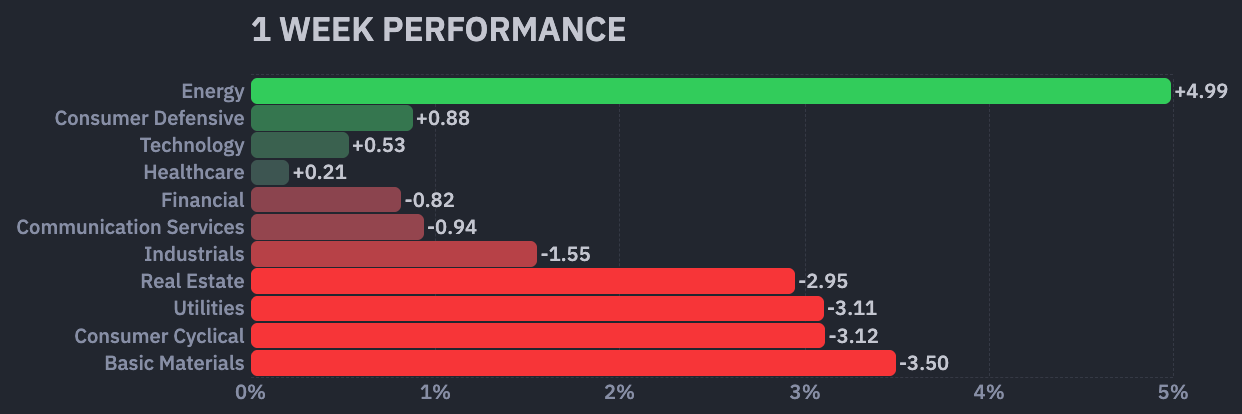
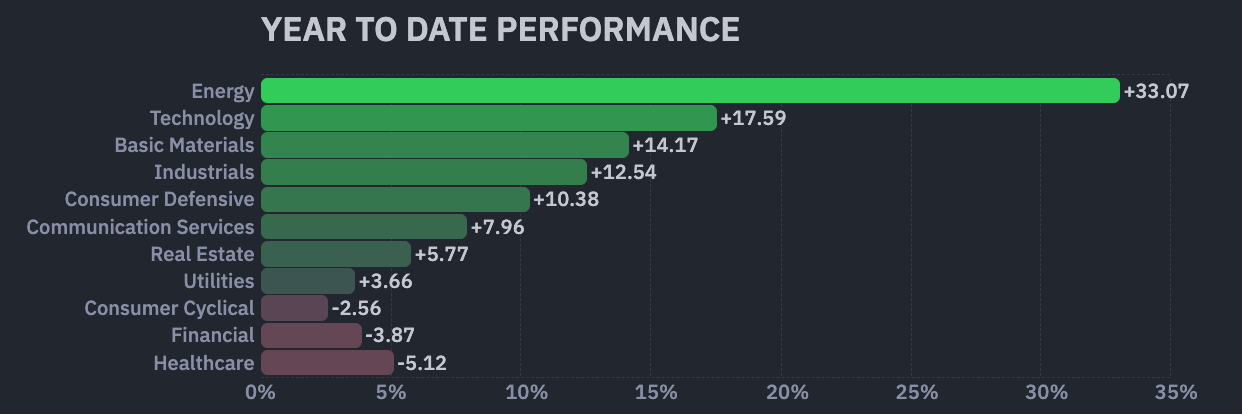
LAST WEEK BY THE NUMBERS:
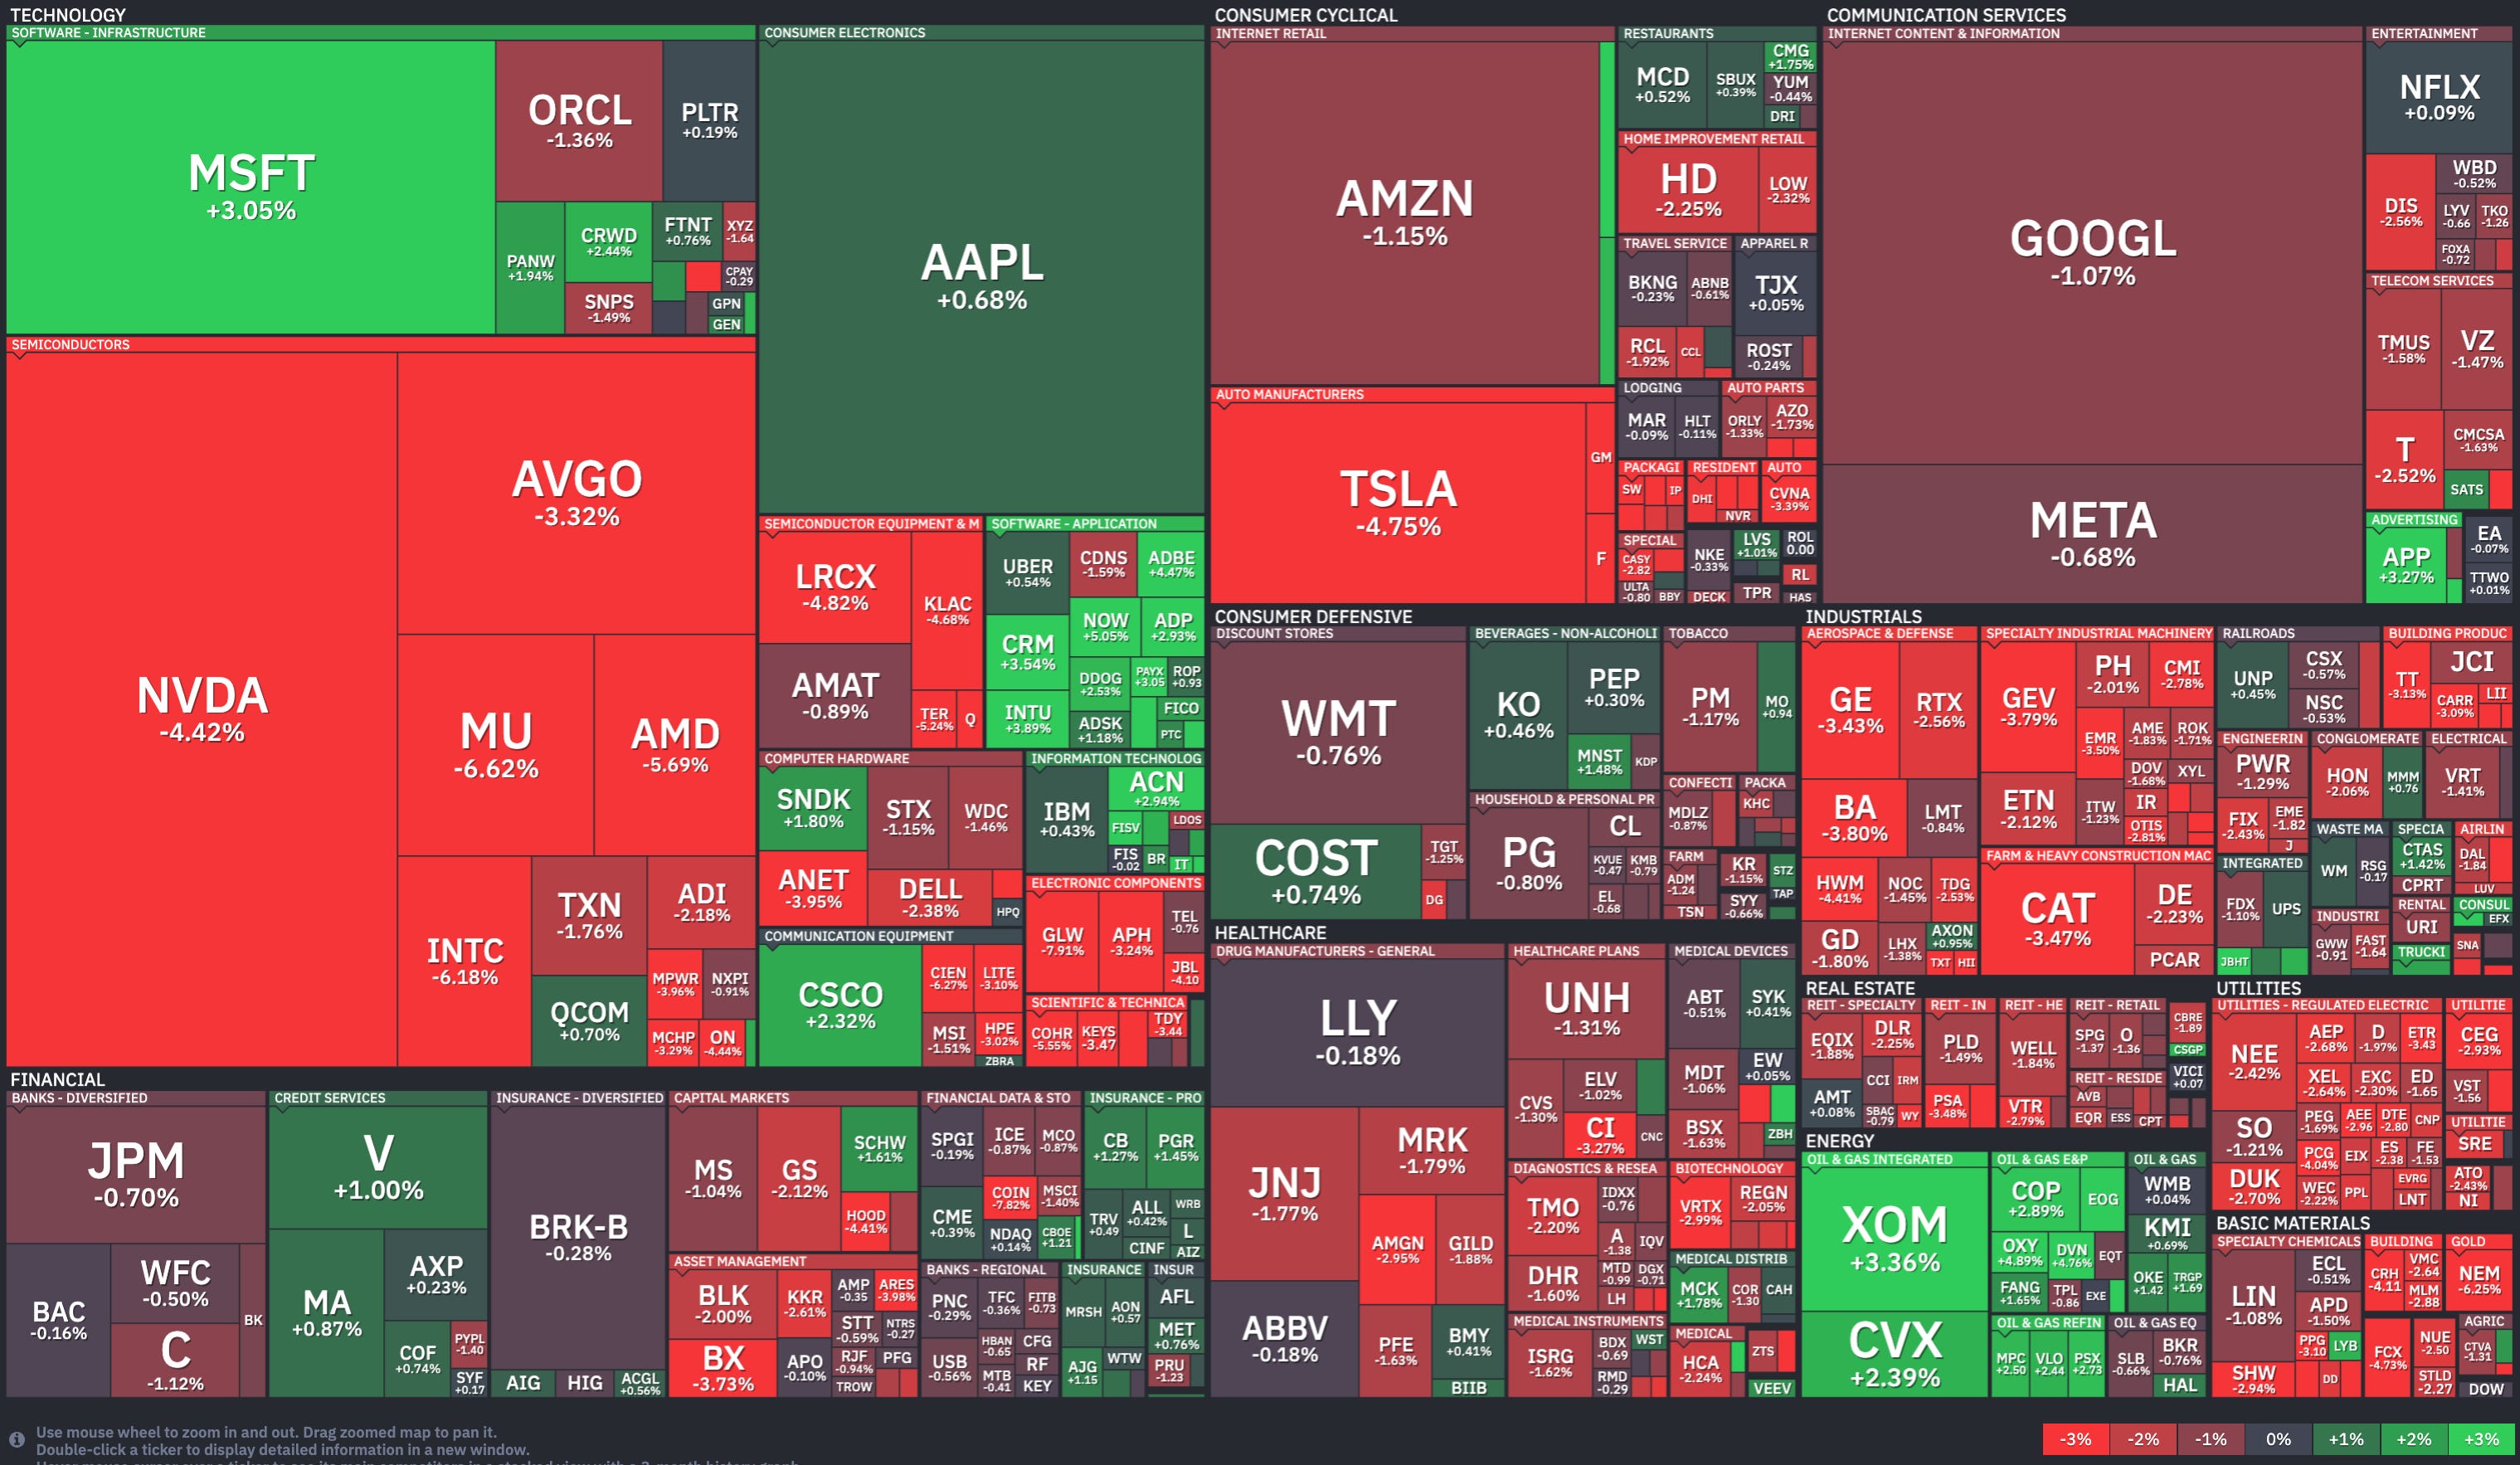
Last week’s S&P 500 market color courtesy of finviz.com
SPYM, a US Large Cap ETF, tracks the S&P 500 index, made up of 500 stocks from a universe of the largest US companies. Its price rose 0.2% last week, is up 8.4% so far this year and ended the week 1.4% below its all-time record closing high (05/14/2026).
IWM, a US Small Cap ETF, tracks the Russell 2000 index, made up of the bottom two-thirds in terms of company size of a universe of 3,000 of the largest US stocks. Its price fell 2.3% last week, is up 12.8% so far this year and ended the week 3.5% below its all-time record closing high (05/06/2026).
VXUS, an International Non-US ETF, tracks the MSCI ACWI Ex-US index, made up of over 8,500 of the largest names from a universe of stocks issued by companies from around the world excluding the United States, in both developed and emerging markets. Its price fell 2.7% last week, is up 10.2% so far this year and ended the week 3.1% below its all-time record closing high (05/06/2026).
INTEREST RATES:
FED FUNDS RATE * ⬌ 3.625% (unchanged from a week ago)
PRIME RATE ** ⬌ 6.75% (unchanged from a week ago)
3 MONTH TREASURY ⬌ 3.69% (3.69% a week ago)
2 YEAR TREASURY ⬆︎ 4.09% (3.90% a week ago)
5 YEAR TREASURY ⬆︎ 4.26% (4.02% a week ago)
10 YEAR TREASURY *** ⬆︎ 4.59% (4.38% a week ago)
20 YEAR TREASURY ⬆︎ 5.14% (4.93% a week ago)
30 YEAR TREASURY ⬆︎ 5.12% (4.95% a week ago)
Data courtesy of the Federal Reserve and the Department of the Treasury as of Friday’s market close.
* Decided upon by the Federal Reserve Open Market Committee at periodic meetings 8x a year. Used as a basis for overnight interbank loans and for determining high yield savings interest rates.
** Wall Street Journal Prime Rate as of Friday’s close. Tending to move in lockstep with the Fed Funds Rate, this measure is used as a basis for determining certain consumer loan interest rates such as credit cards, auto loans, personal loans, home equity loans/lines of credit and securities-based lending.
*** Used as a basis for determining mortgage interest rates.
AVERAGE 30-YEAR FIXED MORTGAGE RATE:
⬇︎ 6.36%
One week ago: 6.37%, one month ago: 6.32%, one year ago: 6.81%
Data courtesy of the Freddie Mac Primary Mortgage Market Survey.
INTEREST RATE EXPECTATIONS:
Where will the Fed Funds interest rate be after the next rate-setting meeting on June 17th?
0.25% higher than now .. ⬌ 0% probability (0% a week ago)
Unchanged from now .. ⬆︎ 99% probability (93% a week ago)
0.25% lower than now .. ⬇︎ 1% probability (7% a week ago)
With five more rate-setting meetings this year, what is the most commonly-expected number of remaining Fed Funds interest rate changes in 2026?
⬌ No changes (unchanged from a week ago)
Data courtesy of the CME FedWatch Tool and is derived from futures market pricing as of Friday’s market close based on the current Fed Funds interest rate of 3.625%.
PERCENT OF S&P 500 STOCKS ABOVE THEIR OWN 200-DAY MOVING AVERAGE:
⬇︎ 51%
One week ago: 53%, one month ago: 50%, one year ago: 42%
Data courtesy of barchart.com as of Friday’s market close.
This widely-used technical measure of market breadth is considered to be a very robust indicator of the overall health of the S&P 500 index.
A high percentage (above 70%) generally suggests broad market strength and a bullish trend, while a low percentage (below 30%) may indicate market weakness and a bearish trend.
FEAR & GREED INDEX:
“Be fearful when others are greedy and be greedy when others are fearful.” Warren Buffett.
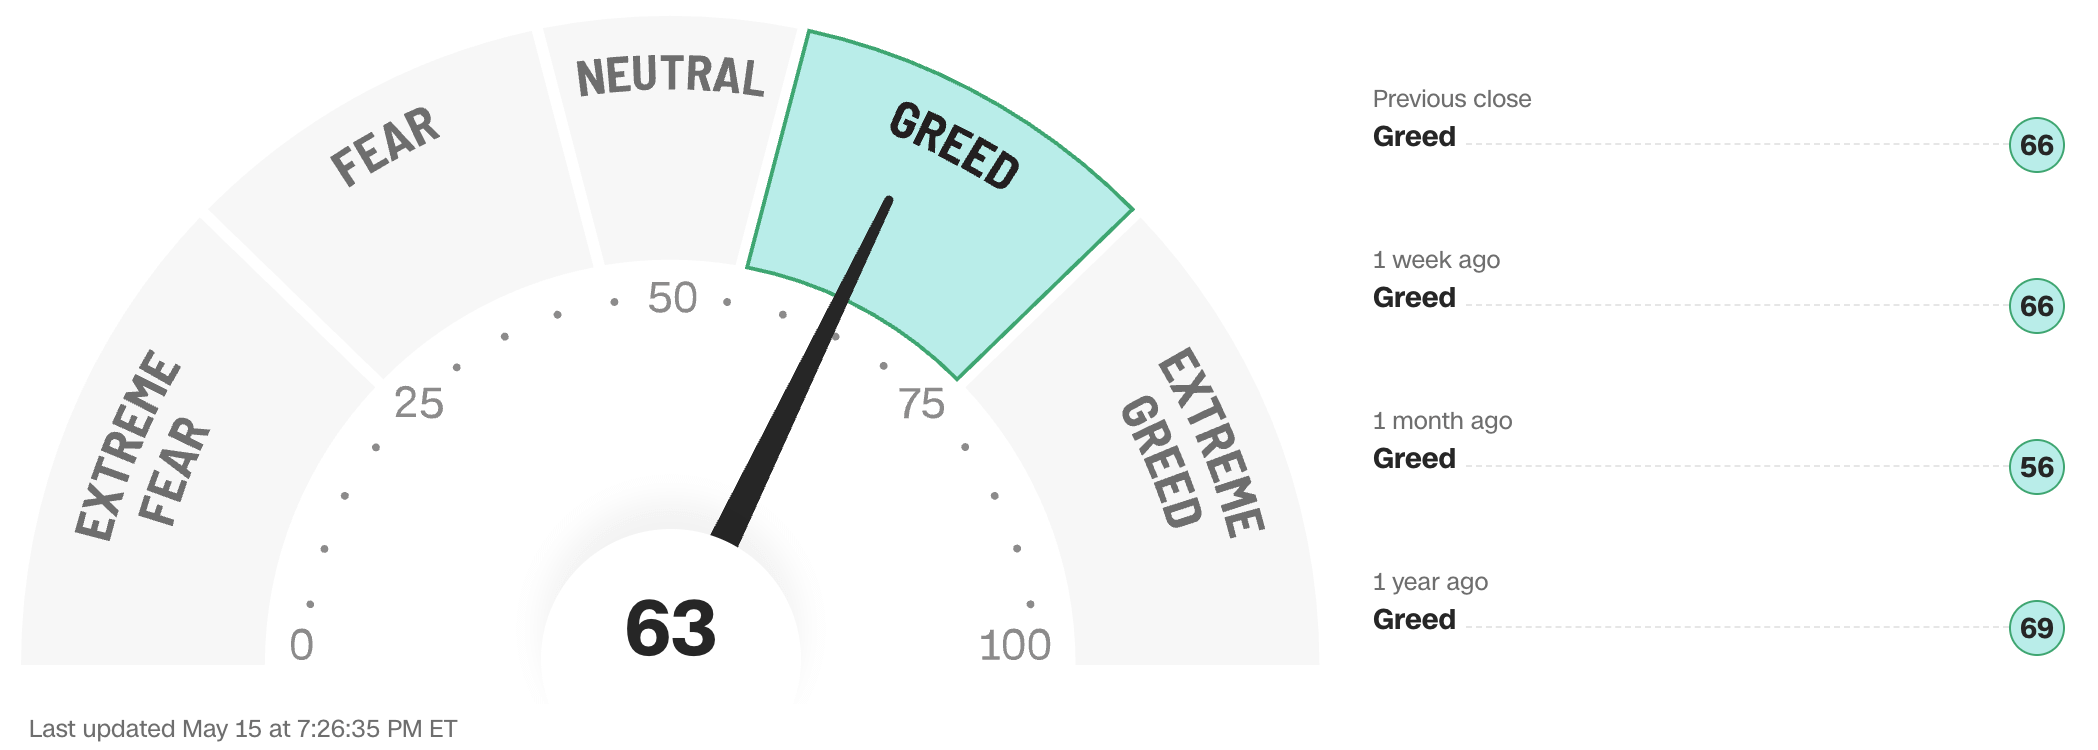
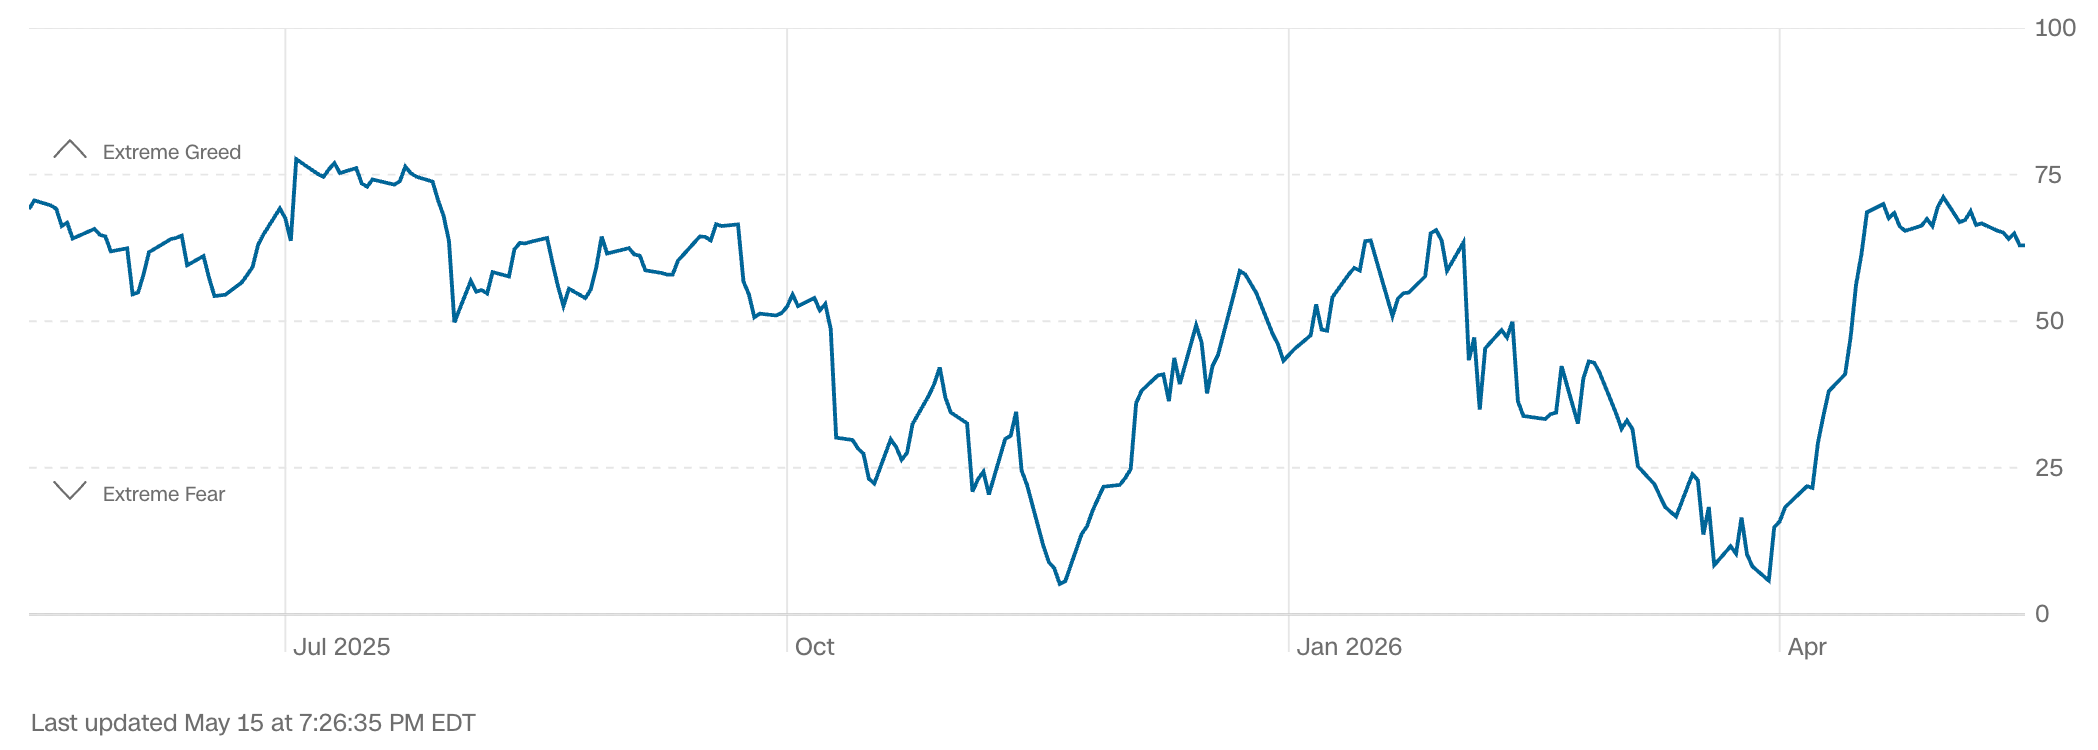
Data courtesy of CNN Business as of Friday’s market close.
The Fear & Greed Index from CNN Business can be used as an attempt to gauge whether or not stocks are fairly priced and to determine the mood of the market. It is a compilation of seven of the most important indicators that measure different aspects of stock market behavior. They are: market momentum, stock price strength, stock price breadth, put and call option ratio, junk bond demand, market volatility and safe haven demand.
Extreme Fear readings can lead to potential opportunities as investors may have driven prices “too low” from a possibly excessive risk-off negative sentiment.
Extreme Greed readings can be associated with possibly too-frothy prices and a sense of “FOMO” with investors chasing rallies in an excessively risk-on environment . This overcrowded positioning leaves the market potentially vulnerable to a sharp downward reversal at some point.
Anglia Advisors has updated its Privacy Policy. You can view the latest version here.
WWW.ANGLIAADVISORS.COM | SIMON@ANGLIAADVISORS.COM | CALL OR TEXT: (646) 286 0290 | FOLLOW ANGLIA ADVISORS ON INSTAGRAM
This material represents a highly opinionated, speculative assessment of the financial market environment based on assumptions and prevailing information and data at a specific point in time and is always subject to change at any time. Although the content is believed to be correct at the time of publication, no warranty of its accuracy or completeness is ever given. It is never to be interpreted as an attempt to forecast any future events, nor does it offer any kind of guarantee whatsoever of future results, circumstances or outcomes.
The material contained herein is not necessarily complete and is also wholly insufficient to be relied upon as research or investment advice or as a sole basis for any financial determinations, including investment decisions or making any kind of consumer choices, without further consultation with Anglia Advisors or other fully-qualified Registered Investment Advisor. The user assumes the entire risk of any decisions made or actions taken based in whole or in part on any of the information provided in this or any other Anglia Advisors published content.
Under no circumstances is any Anglia Advisors’ content ever intended to constitute tax, legal or medical advice and should never be taken as such. Neither the information contained nor any opinion expressed herein constitutes a solicitation for the purchase of any security or asset class. No formal client advice may be rendered by Anglia Advisors unless and until a properly-executed client engagement agreement is in place.
Posts may contain links or references to third party websites or may post data or graphics from them for the convenience and interest of readers. While Anglia Advisors might have reason to believe in the quality of the content provided on these sites, the firm has no control over, and is not in any way responsible for, the accuracy of such content nor for the security or privacy protocols that external sites may or may not employ. By making use of such links, the user assumes, in its entirety, any kind of risk associated with accessing them or making use of any information provided therein.
Those associated with Anglia Advisors, including clients with managed or advised investments, may maintain positions in securities and/or asset classes mentioned in this post.
If you enjoyed this post, why not share it with someone?


