


It was yet another weekend of nothing of substance war-wise for markets to chew on, apart from both sides ramping up the rhetoric and Trump posting some kind of characteristically detail-free vague promise called “Project Freedom” to somehow help guide tankers through the Strait of Hormuz.
Markets were unimpressed. Oil prices and interest rates spiked higher on Monday and stocks fell back from their record highs following exchanges of fire for the first time in weeks as we all got an unwelcome reminder that this war was not over.
Cracks in the fragile ceasefire continued to appear on Tuesday but neither side seems to yet to have reached the pain level required to be willing to announce its demise. For the US, that pain level probably stands at around $160 oil, a 4.75% 10 year Treasury rate and even deeper midterm woes for Republicans.
A buoyant risk-on stock market quickly recovered all of Monday’s losses, bolstered by Intel’s announcement of a deal with Apple. The indexes reached another new set of all-time highs. After the close, Advanced Micro Devices (AMD) released sensational earnings, Trump shut down Project Freedom after less than two days and the average price per gallon at US pumps reached $4.56, its highest level since the summer of 2022.
Reports on Wednesday morning that the US and Iran were closing in on a one-page, 14-point Memorandum of Understanding and Secretary of State Rubio straight up telling Congress that the war was over sent oil prices and interest rates tumbling.
Stocks went vertical with Wall Street traders keen to consign the conflict to the history books and finally get back to their happy place where they could focus on corporate earnings, interest rate projections and economic data rather than constantly having to try and interpret grammatically-challenged social media posts.
The soaring rally spilled into Asia on Thursday with Japanese stocks in particular ripping higher, but wavered when markets opened in New York. Perhaps with one eye on the following day’s crucial employment numbers and in response to oil prices and interest rates slowing their declines from the previous day, Wall Street took its foot off the gas and the indexes closed in the red.
After the close, the US Court of International Trade ruled Trump’s imposition of 10% across-the-board Section 122 tariffs to be illegal, just weeks after the Supreme Court tossed out his IEEPA tariffs.
Further exchange of fire between the US and Iran overnight was dismissed by Trump as a “love tap” . But it did cast some doubt on the prospects of a deal and sent oil prices briefly higher again on Friday ahead of the pre-market Jobs Report which showed a significantly greater-than-expected number of new payrolls and an unchanged unemployment rate of 4.3%.
This Goldilocks data confirmed a stable labor market and pushed back against fears of stagflation. Interest rates shifted lower and the stock indexes, boosted by another big day for Intel and several other semiconductor names, jumped again to wipe out Thursday’s losses and complete a sixth straight week of gains. The S&P 500 index notched its 15th new record high of the year (after almost 40 of them in 2025) and the NASDAQ scored its 11th.
Some other things I’m thinking about ..
Market valuations are clearly stretched in the short term and there are still risks to monitor. But there are genuinely legitimate reasons for the new highs. So, while this market remains vulnerable to temporary downside air pockets on any US/ Iran disappointment, there are fundamentally solid financial positives to be found in the best earnings in over twenty years and a resilient US consumer that are supporting stock prices. While these factors remain in place, the risk of a major fall in the indexes is probably limited. But if they deteriorate, the drop from these levels has the capability to be dramatic.
Prediction betting markets at Polymarket, PredictIt and Kalshi are being pitched on social media as a lucrative side hustle for young Americans squeezed by rent and student debt. However, the reality is that almost all of them are losing money, with over 100,000 accounts on Polymarket down by at least $1,000. Trade records show that the bulk of profits were raked in by a tiny group of what appear to be automated bots while everyone else on the platform, in aggregate, lost $131 million.
If you are not yet a financial planning or investment management client of Anglia Advisors and would like to explore becoming one, please feel free to reach out to arrange a complimentary no-obligation discovery call with me.
ARTICLE OF THE WEEK ..
Various AI platforms were asked to create and manage a stock portfolio. It didn’t go well.
.. AND I QUOTE ..
“They’re literally running out of money at the end of the month.”
Steve Cahillane, CEO of Kraft Heinz, referring to low-income US consumers facing tariffs, rising gas prices and stubborn inflation
LAST WEEK BY THE NUMBERS:
Last week’s S&P 500 market color courtesy of finviz.com
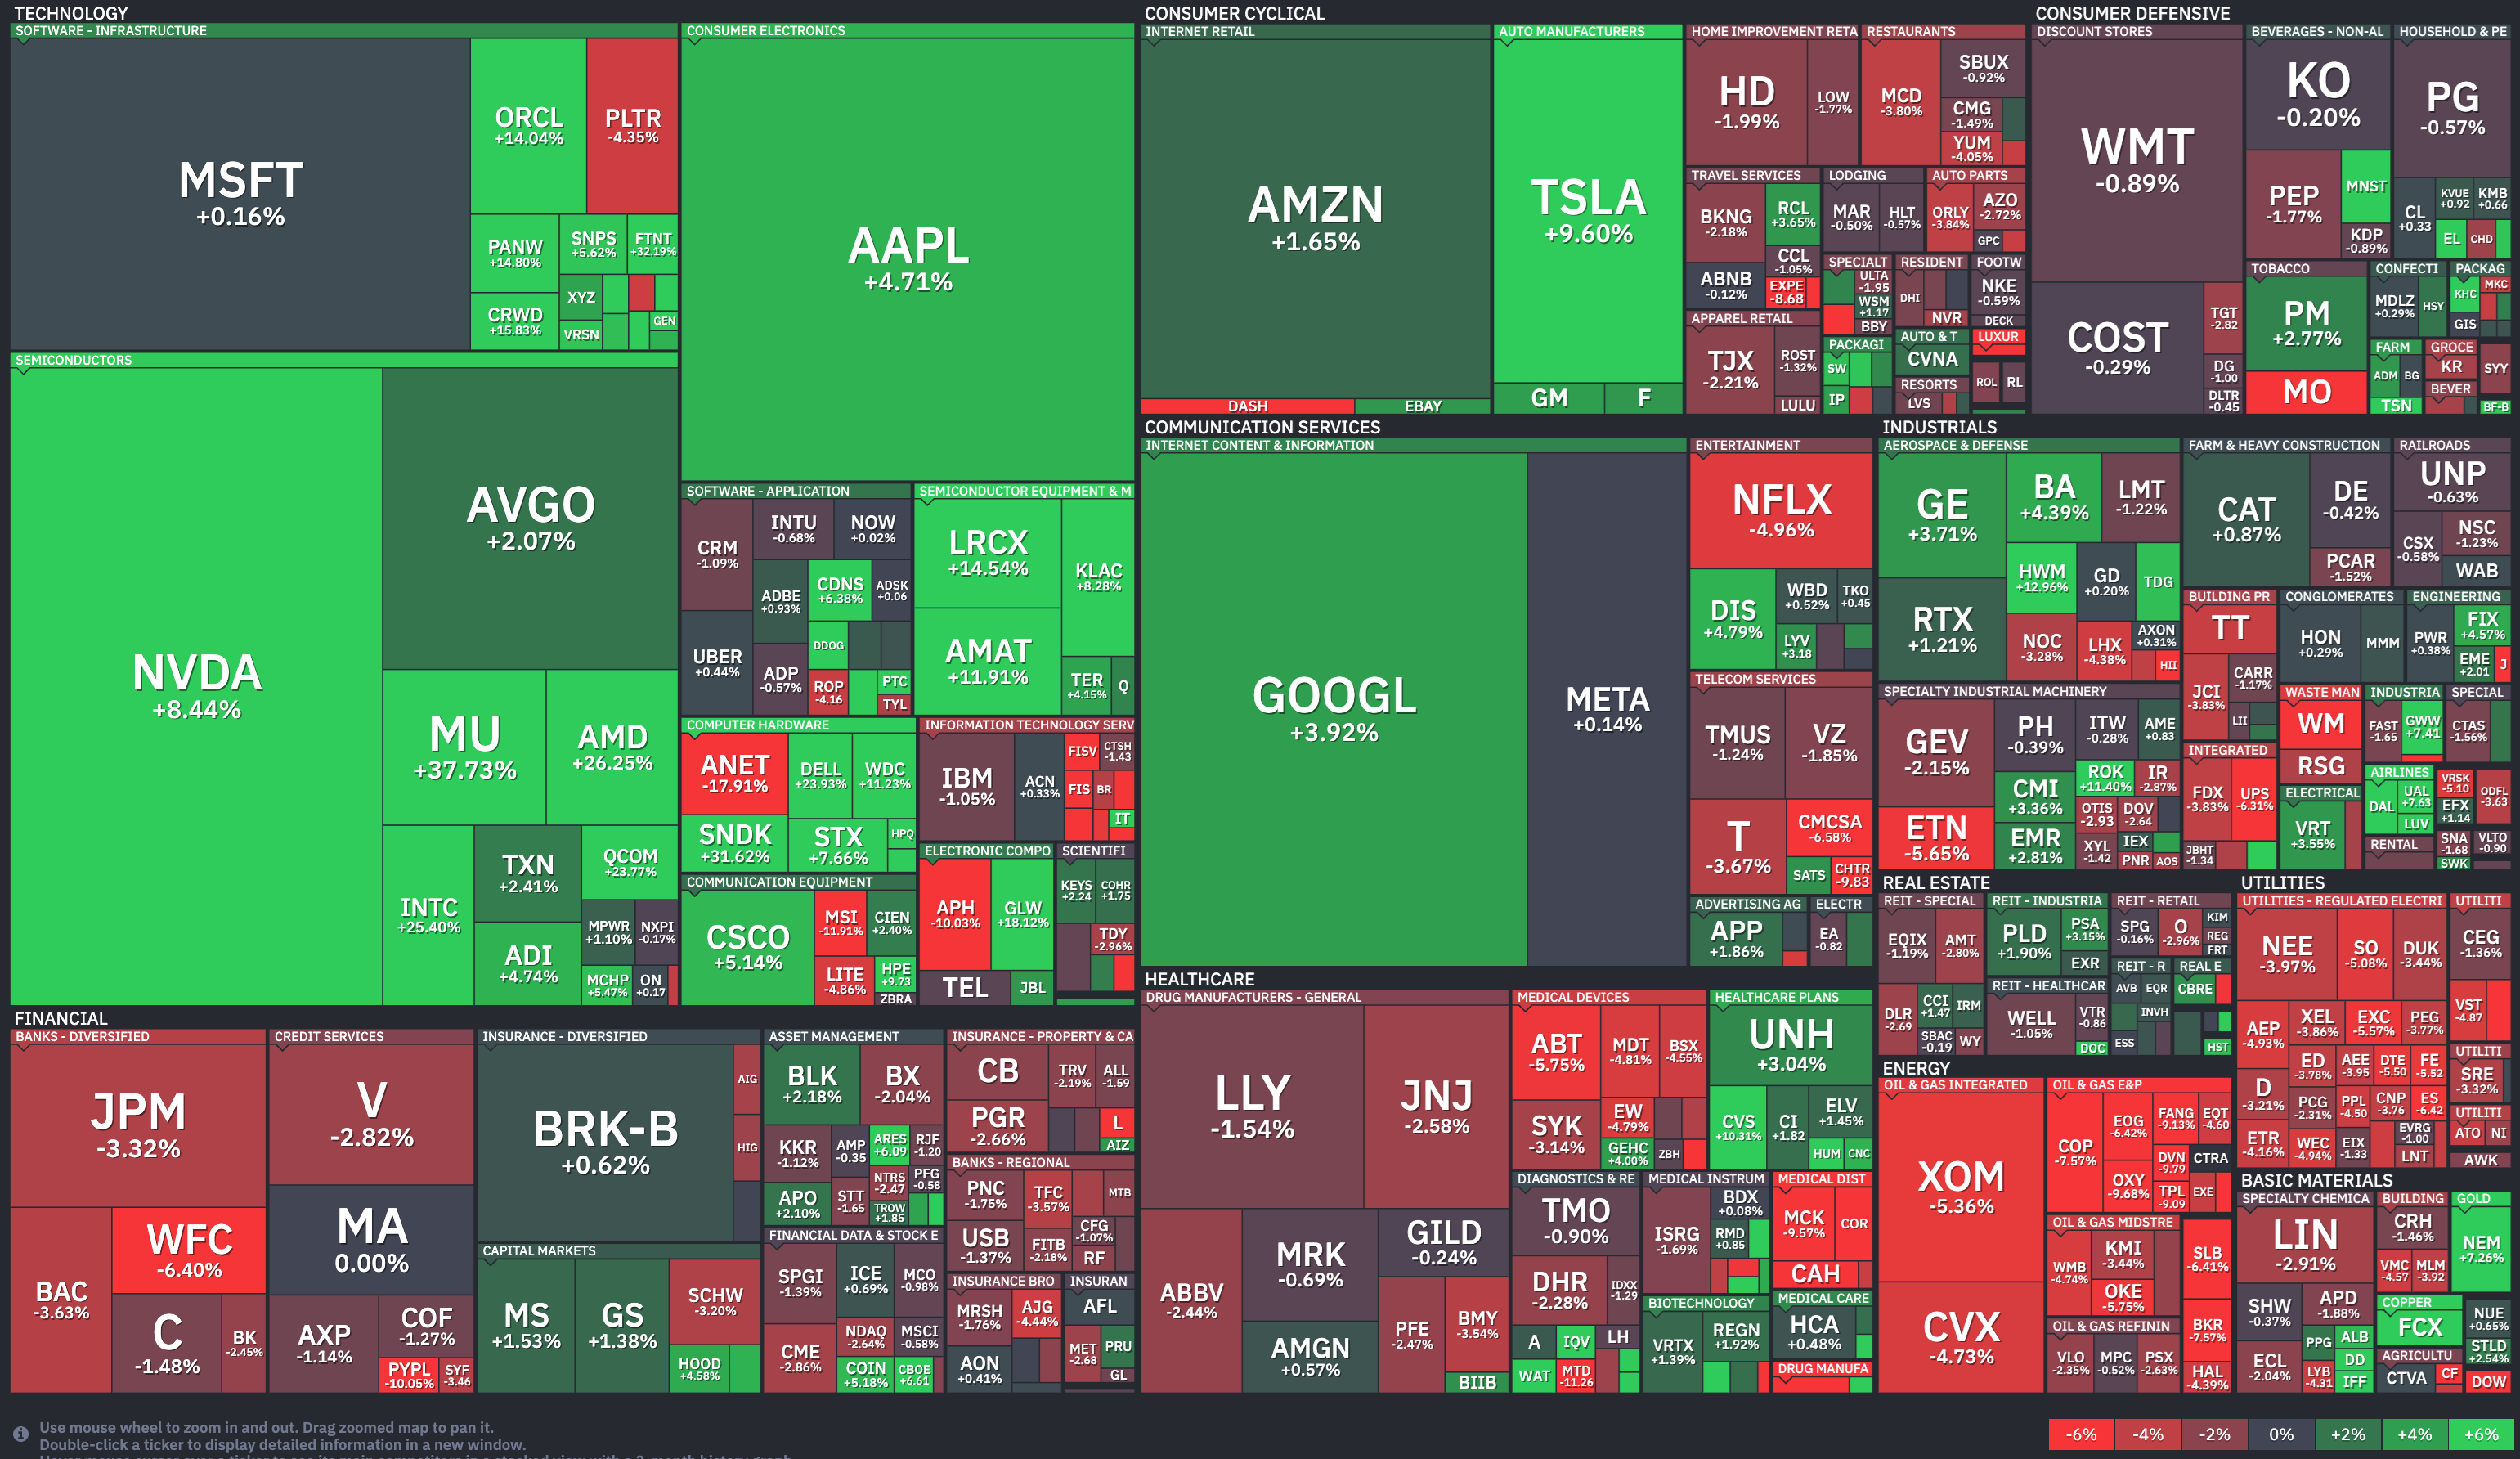
SPYM, a US Large Cap ETF, tracks the S&P 500 index, made up of 500 stocks from a universe of the largest US companies. Its price rose 2.4% last week, is up 8.2% so far this year and ended the week at its all-time record closing high (05/08/2026).
IWM, a US Small Cap ETF, tracks the Russell 2000 index, made up of the bottom two-thirds in terms of company size of a universe of 3,000 of the largest US stocks. Its price rose 1.8% last week, is up 15.4% so far this year and ended the week 1.2% below its all-time record closing high (05/06/2026).
VXUS, an International Non-US ETF, tracks the MSCI ACWI Ex-US index, made up of over 8,500 of the largest names from a universe of stocks issued by companies from around the world excluding the United States, in both developed and emerging markets. Its price rose 3.0% last week, is up 13.2% so far this year and ended the week 0.4% below its all-time record closing high (05/06/2026).
INTEREST RATES:
FED FUNDS RATE * ⬌ 3.625% (unchanged from a week ago)
PRIME RATE ** ⬌ 6.75% (unchanged from a week ago)
3 MONTH TREASURY ⬆︎ 3.69% (3.68% a week ago)
2 YEAR TREASURY ⬆︎ 3.90% (3.88% a week ago)
5 YEAR TREASURY ⬌ 4.02% (4.02% a week ago)
10 YEAR TREASURY *** ⬇︎ 4.38% (4.39% a week ago)
20 YEAR TREASURY ⬇︎ 4.93% (4.96% a week ago)
30 YEAR TREASURY ⬇︎ 4.95% (4.97% a week ago)
Data courtesy of the Federal Reserve and the Department of the Treasury as of Friday’s market close.
* Decided upon by the Federal Reserve Open Market Committee at periodic meetings 8x a year. Used as a basis for overnight interbank loans and for determining high yield savings interest rates.
** Wall Street Journal Prime Rate as of Friday’s close. Tending to move in lockstep with the Fed Funds Rate, this measure is used as a basis for determining certain consumer loan interest rates such as credit cards, auto loans, personal loans, home equity loans/lines of credit and securities-based lending.
*** Used as a basis for determining mortgage interest rates.
AVERAGE 30-YEAR FIXED MORTGAGE RATE:
⬆︎ 6.37%
One week ago: 6.30%, one month ago: 6.39%, one year ago: 6.76%
Data courtesy of the Freddie Mac Primary Mortgage Market Survey.
INTEREST RATE EXPECTATIONS:
Where will the Fed Funds interest rate be after the next rate-setting meeting on June 17th?
0.25% higher than now .. ⬌ 0% probability (0% a week ago)
Unchanged from now .. ⬌ 93% probability (93% a week ago)
0.25% lower than now .. ⬌ 7% probability (7% a week ago)
With five more rate-setting meetings in 2026, what is the most commonly-expected number of remaining 0.25% Fed Funds interest rate cuts this year?
⬌ Zero (unchanged from a week ago)
Data courtesy of the CME FedWatch Tool and is derived from futures market pricing as of Friday’s market close based on the current Fed Funds interest rate of 3.625%.
PERCENT OF S&P 500 STOCKS ABOVE THEIR OWN 200-DAY MOVING AVERAGE:
⬇︎ 53%
One week ago: 57%, one month ago: 52%, one year ago: 42%
Data courtesy of barchart.com as of Friday’s market close.
This widely-used technical measure of market breadth is considered to be a very robust indicator of the overall health of the S&P 500 index.
A high percentage (above 70%) generally suggests broad market strength and a bullish trend, while a low percentage (below 30%) may indicate market weakness and a bearish trend.
FEAR & GREED INDEX:
“Be fearful when others are greedy and be greedy when others are fearful.” Warren Buffett.
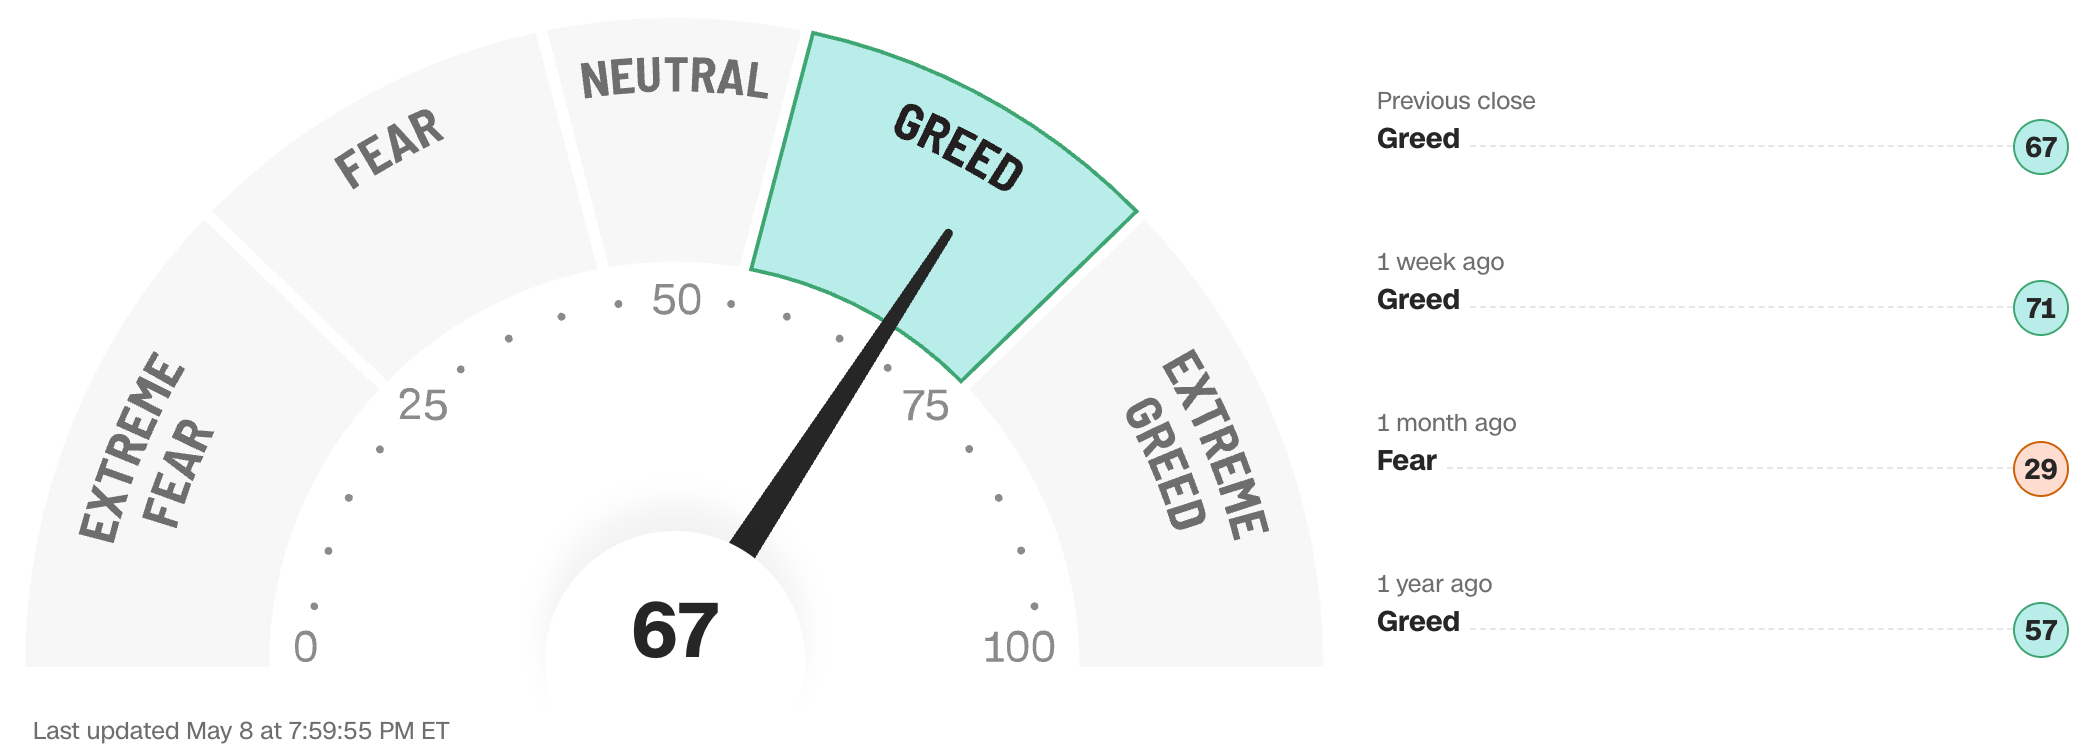
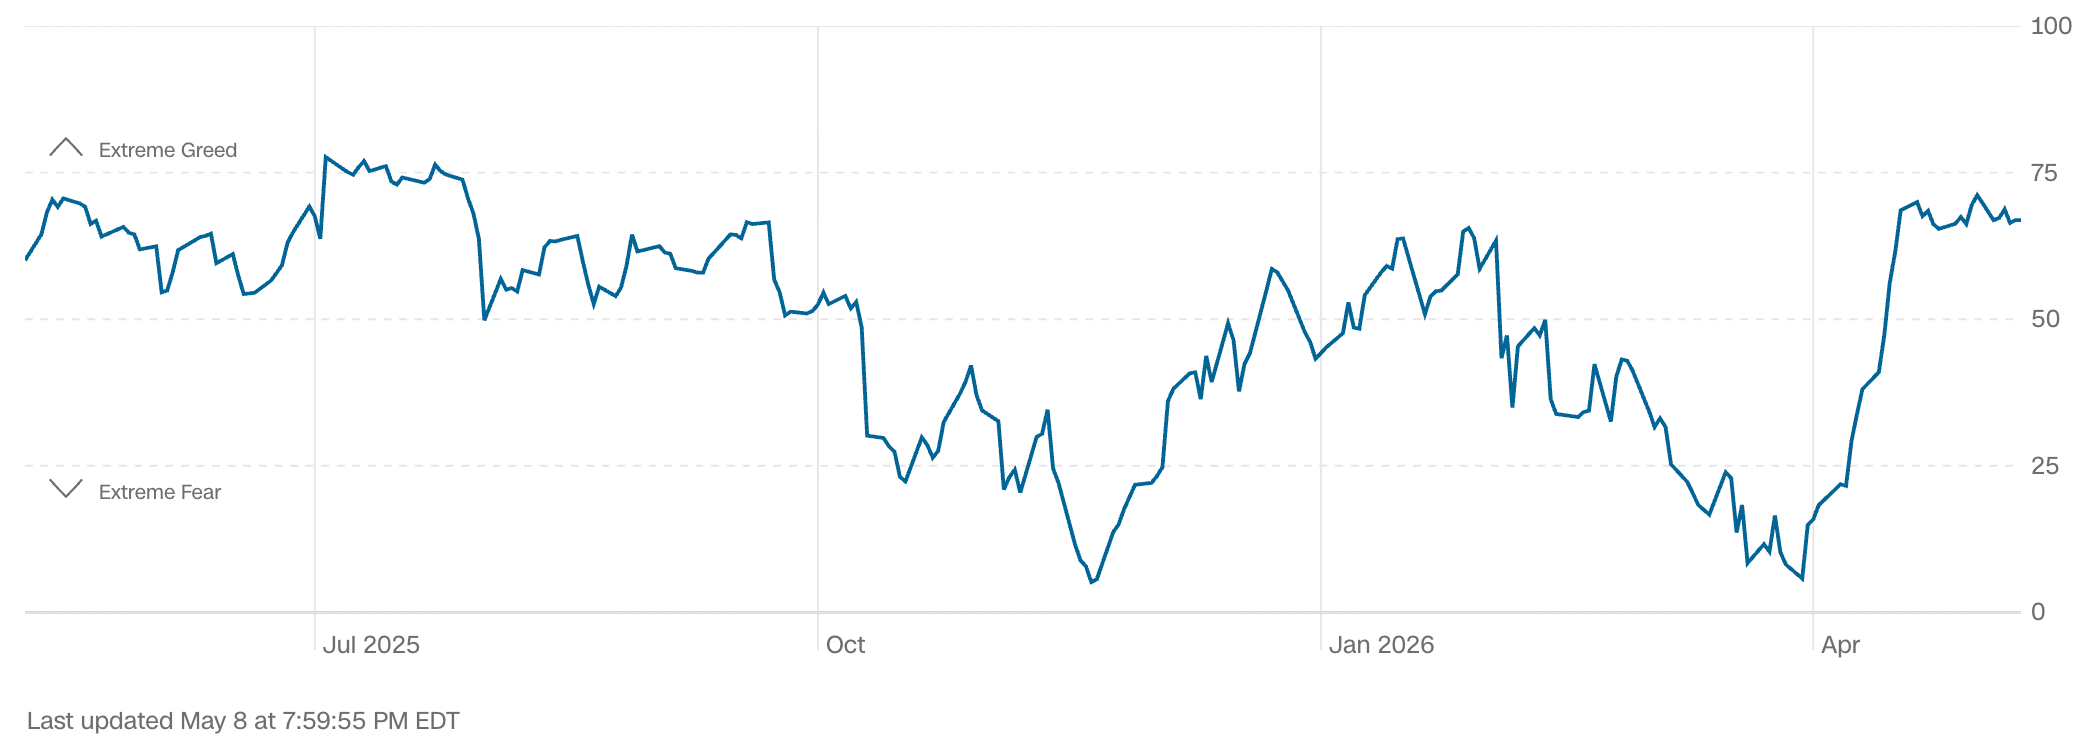
Data courtesy of CNN Business as of Friday’s market close.
The Fear & Greed Index from CNN Business can be used as an attempt to gauge whether or not stocks are fairly priced and to determine the mood of the market. It is a compilation of seven of the most important indicators that measure different aspects of stock market behavior. They are: market momentum, stock price strength, stock price breadth, put and call option ratio, junk bond demand, market volatility and safe haven demand.
Extreme Fear readings can lead to potential opportunities as investors may have driven prices “too low” from a possibly excessive risk-off negative sentiment.
Extreme Greed readings can be associated with possibly too-frothy prices and a sense of “FOMO” with investors chasing rallies in an excessively risk-on environment . This overcrowded positioning leaves the market potentially vulnerable to a sharp downward reversal at some point.
Anglia Advisors has updated its Privacy Policy. You can view the latest version here.
WWW.ANGLIAADVISORS.COM | SIMON@ANGLIAADVISORS.COM | CALL OR TEXT: (646) 286 0290 | FOLLOW ANGLIA ADVISORS ON INSTAGRAM
This material represents a highly opinionated, speculative assessment of the financial market environment based on assumptions and prevailing information and data at a specific point in time and is always subject to change at any time. Although the content is believed to be correct at the time of publication, no warranty of its accuracy or completeness is ever given. It is never to be interpreted as an attempt to forecast any future events, nor does it offer any kind of guarantee whatsoever of future results, circumstances or outcomes.
The material contained herein is not necessarily complete and is also wholly insufficient to be relied upon as research or investment advice or as a sole basis for any financial determinations, including investment decisions or making any kind of consumer choices, without further consultation with Anglia Advisors or other fully-qualified Registered Investment Advisor. The user assumes the entire risk of any decisions made or actions taken based in whole or in part on any of the information provided in this or any other Anglia Advisors published content.
Under no circumstances is any Anglia Advisors’ content ever intended to constitute tax, legal or medical advice and should never be taken as such. Neither the information contained nor any opinion expressed herein constitutes a solicitation for the purchase of any security or asset class. No formal client advice may be rendered by Anglia Advisors unless and until a properly-executed client engagement agreement is in place.
Posts may contain links or references to third party websites or may post data or graphics from them for the convenience and interest of readers. While Anglia Advisors might have reason to believe in the quality of the content provided on these sites, the firm has no control over, and is not in any way responsible for, the accuracy of such content nor for the security or privacy protocols that external sites may or may not employ. By making use of such links, the user assumes, in its entirety, any kind of risk associated with accessing them or making use of any information provided therein.
Those associated with Anglia Advisors, including clients with managed or advised investments, may maintain positions in securities and/or asset classes mentioned in this post.
If you enjoyed this post, why not share it with someone?


