


This was the week that Microsoft edged past Apple to reclaim the title of the world’s most valuable company. The software giant now has a valuation of $2.89 trillion, slightly ahead of Apple at $2.87 trillion.
The week also saw the US and UK launch joint airstrikes against rebel targets in Yemen after a spate of attacks on merchant vessels in the Red Sea. The rebels responded by vowing to continue their attacks. An absolutely vital commercial shipping artery becoming a war zone is pushing both oil and shipping costs higher, raising fears of a widespread knock-on effect on global inflation and, as such, the evolving situation is being monitored by markets.
Following the news that congressional leaders had apparently struck a bipartisan deal over the weekend on top-line spending levels for the current fiscal year, thereby lessening (but not entirely eliminating) the chances of any imminent government shutdown, markets reacted favorably on Monday and stock indexes shifted higher. Boeing and some airline stocks took a hit, however, after its 737 Max 9 planes were grounded for inspection following an incident the previous week.
A mostly sideways Tuesday followed, with light losses for the S&P 500 and light gains for tech stocks. One one hand, the World Bank’s growth forecasts for the U.S. and E.U. this year were upgraded, helping to offset a lower-revised outlook for the Chinese economy. On the other hand, some pretty wild, apocalyptic talk from Trump’s lawyers in a DC courtroom served to remind markets how much volatility is probably going be generated by domestic politics in this election year.
Wednesday was mostly uneventful with the important inflation data due out the following day and Q4 2023 earnings season kicking off the day after. Trader positioning in advance of these events was cautiously optimistic with most indexes creeping a little higher, although the recent Small Cap retreat continued. The day’s news flow was dominated by the anticipation and eventual confirmation of the SEC’s rather reluctant approval of multiple Bitcoin ETFs (see OTHER NEWS below).
When it came out on Thursday morning before the opening bell, the Consumer Price Index (CPI) measure of inflation showed that the pace of retail price increases actually picked up a little at the end of 2023. Overall headline CPI rose 0.2% from November to December and the 3.4% annualized rate was higher than the previous month’s 3.1%.
However, the more important Core CPI reading, which excludes energy and food costs, rose 0.3%, the same as for the prior month and is up 3.9% from a year ago, a slight decline from the 4.0% annualized rate of a month previously. The biggest contributors to inflation in December were increases in the prices of used cars, clothing and especially homeowners’ and auto insurance.
The stock market initially decided to interpret the report as another sign of a potential speed-bump for its hopes of imminent and frequent interest rate cuts and prices declined across the board. A late rebound, however, saw the indexes finish pretty flat on the day.
On Friday, there was somewhat more positive inflation news from the Producer Price Index (PPI) measure of wholesale inflation experienced by manufacturers which actually fell 0.1% for the month and ended 2023 up just 1.0% from a year earlier, as compared to 2022’s total increase of 6.4%.
Some of Wall Street’s biggest banks kicked off the Q4 2023 earnings season on Friday and a common theme seemed to be that last year may have been the peak for their biggest source of revenue, net interest income (the difference between what they pay to borrow money and earn to lend it). In keeping with the preceding few days, the stock market session was a bit of a yawn and prices eked out marginal gains, despite continued ongoing declines for stocks of any companies related to the airline industry.
It’s not a very complicated market right now. Unlike the past several years, there aren’t a lot of influences on stocks and bonds at the moment as there are really just three of them driving markets in the short term:
Fed policy expectations and resulting anticipated economic growth (hard landing/soft landing)
inflation
corporate earnings
In the near term, the stock market has an expectation problem and the early year cooling-down hasn’t been so much because something bad happened and instead just because the first data points of 2024 didn’t quite validate the extremely aggressive (and possibly unrealistic) market expectations for the year.
But just because the outlook isn’t perfect, it doesn’t mean it still can’t be good. It’s possible to be constructive on the rest of the year, but also feel that Wall Street needs to get over some short-term jitters. Some indigestion is probably to be expected following the kind of shocking rally in the S&P 500 index that we just experienced.
OTHER NEWS (BITCOIN ETF EDITION) ..
Green Light .. After a false start on Tuesday brought about by crypto hackers hijacking the U.S. Securities and Exchange Commission (SEC) X/Twitter account and putting out false information, the SEC did reluctantly vote on Wednesday to clear the way for the first U.S. exchange-traded funds (ETFs) that hold Bitcoin to be sold to the public, allowing mainstream investors to finally be able buy and sell the digital currency as easily and transparently as stocks and mutual funds in a fully regulated environment. This followed years of resistance from regulators based on concerns about rampant fraud, misrepresentation and manipulation in crypto markets (concerns that will not disappear following this SEC decision).
Until now, everyday investors who wanted to buy and sell digital currencies have had to either:
take their chances incurring hefty transaction fees trading on risky and user-unfriendly crypto exchanges (a good number of which were operated as criminal frauds with little or no asset protection for investors) and with limited confidence that their assets would not simply disappear or be stolen, or
purchase high-cost products that only approximately tracked the price of Bitcoin in much less direct ways, like through futures contracts, which are far from ideal.
All eleven ETF applications filed by asset managers including BlackRock, Fidelity Investments, ARK Investment Management, Invesco, WisdomTree, Bitwise Asset Management, Valkyrie and Grayscale Investments were green-lighted to list as early as the following day.
SEC chairman Gary Gensler, who openly admitted that his hand was forced in this decision by a recent court ruling, didn’t hold back when he was asked how the Bitcoin ETFs will compare to existing ETFs that track, say, the price of gold ..
“I’d note that the underlying assets in the metals ETFs have consumer and industrial uses, while in contrast Bitcoin is primarily just a speculative, volatile asset that’s also used for illicit activity including ransomware, money laundering, sanction evasion and terrorist financing.
While we approved the listing and trading of certain spot Bitcoin ETF shares today, we did not approve or endorse Bitcoin. Investors should remain cautious about the myriad risks associated with Bitcoin and any products whose value is tied to crypto.”
Ouch.
I will shortly be publishing an article on this platform about how these new Bitcoin ETFs work, what they mean for Bitcoin investment and what my advice would be when it comes to using these new products.
UNDER THE HOOD ..
The S&P 500 in 2024 has notably retraced back to where it was before the last Fed meeting, effectively erasing the gains earned since then. Key technical support levels have held, however, indicating that the first couple of weeks of the year have represented nothing more than a pause in the upward trajectory of stock prices that began in late October.
It would be helpful to see the S&P close at a new all-time closing high (currently 4,797 - so only 14 points away from Friday’s closing price), to confirm the uptrend. The early 2022 intra-day high of 4,819 will also be in focus.
It was interesting to note that NASDAQ volume surged from a two-year low in October 2023 to a nearly three-year high last week. A bull market needs the fuel of incoming new money, so this bodes well for future gains. It is important to recognize that major market declines, last witnessed early in 2022, are typically preceded by months of ongoing deterioration, not of renewed strength.
The percent of stocks above their moving averages (see below) remains high (healthy) and the percent of stocks 20% or more below their one year highs remains low (also healthy).
Through sustained and significant gains in key technical indicators over the course of several months, the long-term market outlook has stabilized and brightened. In this context, a potential short term market pullback need not yet be feared.
Anglia Advisors clients are welcome to reach out to me to discuss market conditions further.
THIS WEEK’S UPCOMING CALENDAR ..
U.S. stock and bond markets will be closed on Monday for Martin Luther King Day, but it will be a busy week of Q4 earnings reports once Wall Street returns. Goldman Sachs, Morgan Stanley, Charles Schwab, Prologis, Schlumberger, State Street and Travelers are among the highlights.
Retail Sales data and the monthly Consumer Sentiment survey come out this week as does information on the latest Housing Market Index and Existing Home Sales.
This week also sees the annual self-indulgent gathering of out-of-touch narcissists in Davos, delighting in the sounds of their own voices which will, as usual, generate lots of self-congratulatory backslapping and nothing of any use to normal human beings.
ARTICLE(S) OF THE WEEK ..
Two for the price of one this week, I think these two important articles are inter-linked.
Both sides of the coin. The bull case for stocks and the bear case outlined by the always insightful Barry Ritholtz. Take your pick. Or don’t.
“Anything can and will happen in the short run. The long run is where compounding happens. Success in the stock market is reserved for patient people.” If you are aged below 45 you need to read this.
LAST WEEK BY THE NUMBERS ..
Last week’s market color courtesy of finviz.com

Last week’s best performing U.S. sector: Technology (two biggest holdings: Microsoft, Apple) - up 4.4% for the week.
Last week’s worst performing U.S. sector: Energy (two biggest holdings: Exxon-Mobil, Chevron) - down 2.4% for the week.
SPY, the S&P 500 Large Cap ETF, is made up of the stocks of the 500 largest U.S. companies. Its price rose 1.7% last week, is up 0.3% so far this year and is now 0.2% below its all-time closing high (01/03/2022)
IWM, the Russell 2000 Small Cap ETF, is made up of the bottom two-thirds in terms of company size of the group of the 3,000 largest U.S. stocks. Its price fell 0.3% last week, is down 3.7% so far this year and is now 20.3% below its all-time closing high (11/05/2021)
DXY, the U.S. Dollar index, is an index that measures the value of the U.S. Dollar against a weighted basket of six other major currencies (the Euro, the Japanese Yen, the British Pound, the Canadian Dollar, the Swedish Krone and the Swiss Franc). It rose 0.2% last week, is up 1.05% so far this year and is up 13.2% over the last three years.
AVERAGE 30-YEAR FIXED MORTGAGE RATE ..
6.66 %
One week ago: 6.62%, one month ago: 6.95%, one year ago: 6.33%
Data courtesy of: FRED Economic Data, St. Louis Fed as of Thursday of last week.
FEAR & GREED INDEX ..
“Be fearful when others are greedy and be greedy when others are fearful.” Warren Buffet.
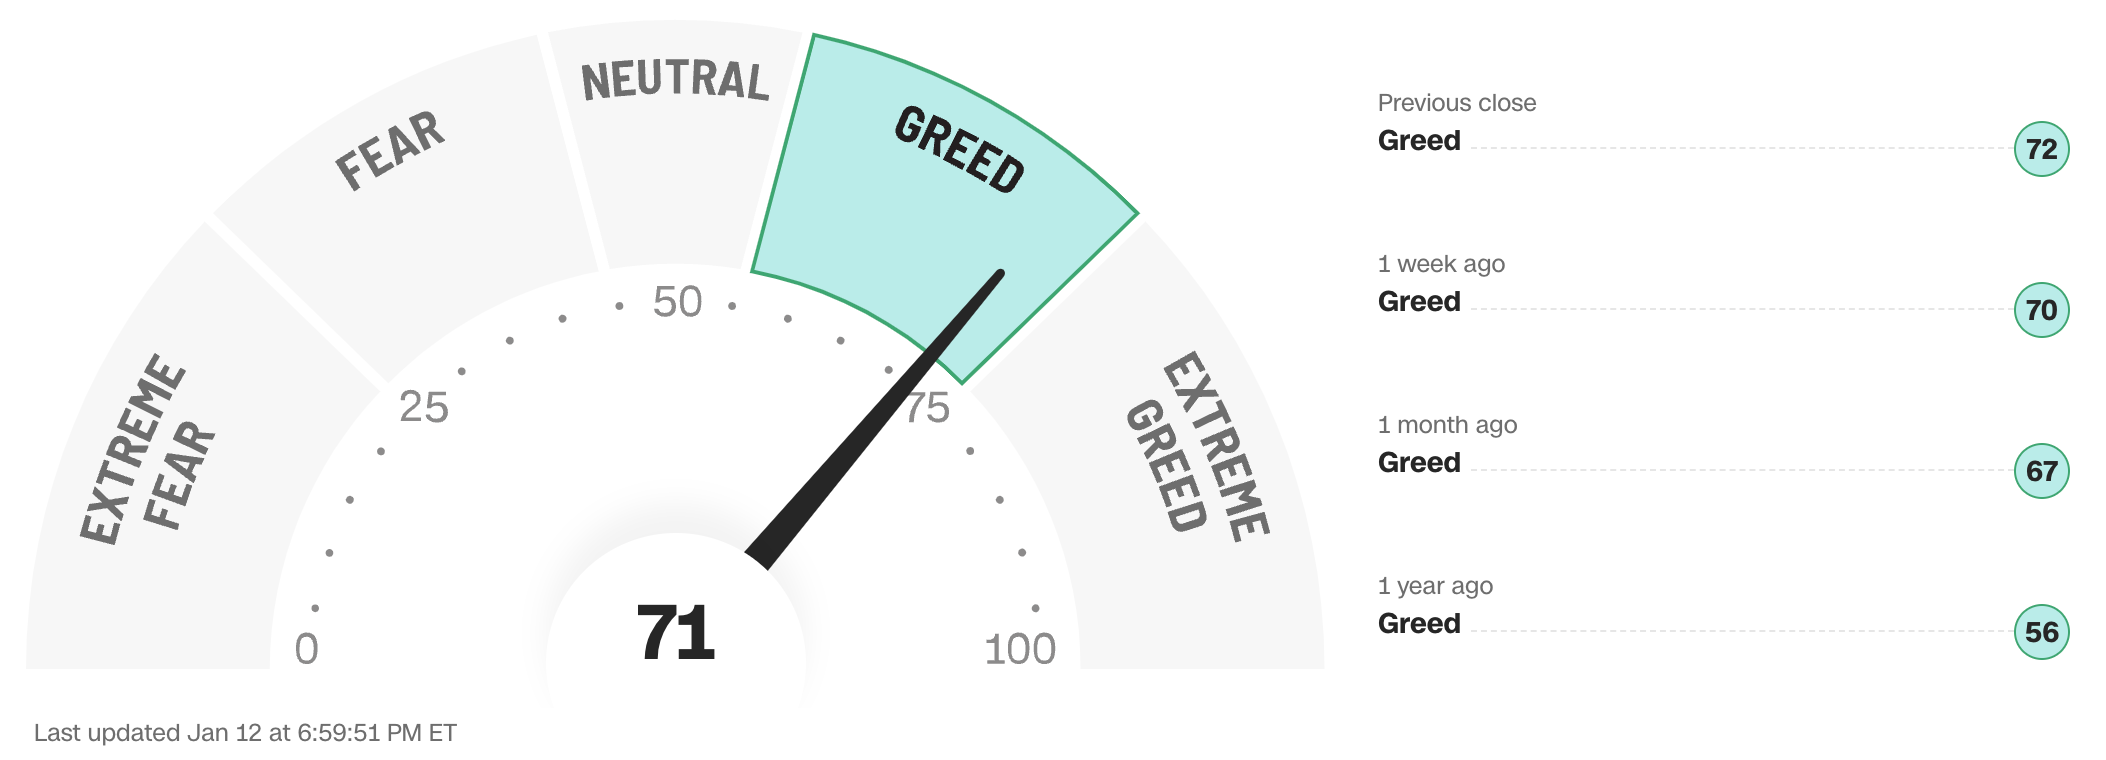
The Fear & Greed Index from CNN Business can be used as an attempt to gauge whether or not stocks are fairly priced and to determine the mood of the market. It is a compilation of seven different indicators that measure some aspect of stock market behavior. They are: market momentum, stock price strength, stock price breadth, put and call options, junk bond demand, market volatility and safe haven demand.
Extreme Fear readings can lead to potential opportunities as investors may have driven prices “too low” from a possibly excessive risk-off negative sentiment.
Extreme Greed readings can be associated with a sense of “FOMO” and investors chasing rallies in an excessively risk-on environment . This overcrowded positioning leaves the market potentially vulnerable to a sharp downward reversal at some point.
The “sweet spot” is considered to be in the lower-to-mid “Greed” zone.
Data courtesy of CNN Business.
% OF S&P 500 STOCKS TRADING ABOVE THEIR 50-DAY MOVING AVERAGE ..
82% (410 of the 500 largest stocks in the U.S. ended last week above their 50D MA and 90 were below)
One week ago: 87%, one month ago: 89%, one year ago: 76%
% OF S&P 500 STOCKS TRADING ABOVE THEIR 200-DAY MOVING AVERAGE ..
73% (369 of the 500 largest stocks in the U.S. ended last week above their 200D MA and 131 were below)
One week ago: 75%, one month ago: 72%, one year ago: 62%
Closely-watched measures of market breadth and participation, providing a real-time look at how many of the largest 500 publicly-traded stocks in the U.S. are trending higher or lower, as defined by whether the stock price is above or below their more sensitive 50-day (short term) and less sensitive 200-day (long term) moving averages which are among the most widely-followed of all stock market technical indicators.
The higher the reading, the better the deemed health of the overall market, with 50% considered to be a key pivot point.
WEEKLY US INVESTOR SENTIMENT (outlook for the upcoming 6 months) ..
↑Bullish: 49% (49% a week ago)
⬌ Neutral: 27% (28% a week ago)
↓Bearish: 24% (23% a week ago)
Net Bull-Bear spread: ↑Bullish by 25 (Bullish by 26 a week ago)
For context: Long term averages: Bullish: 38% — Neutral: 32% — Bearish: 30% — Net Bull-Bear spread: Bullish by 8
Survey participants are typically polled during the first half of the week.
Data courtesy of: American Association of Individual Investors (AAII).
FEDWATCH INTEREST RATE TOOL ..
Will interest rates be lower than they are now after the Fed’s next meeting (January 31st)?
Yes .. 5% probability (4% a week ago)
No .. 95% probability (96% a week ago)
Will interest rates be lower than they are now after the Fed’s following meeting (March 20th)?
Yes .. 81% probability (64% a week ago)
No .. 19% probability (36% a week ago)
Based on the Fed Funds rate (currently 5.375%). Calculated from Federal Funds futures prices as of Friday. Data courtesy of CME FedWatch Tool.
US TREASURY INTEREST RATE YIELD CURVE ..
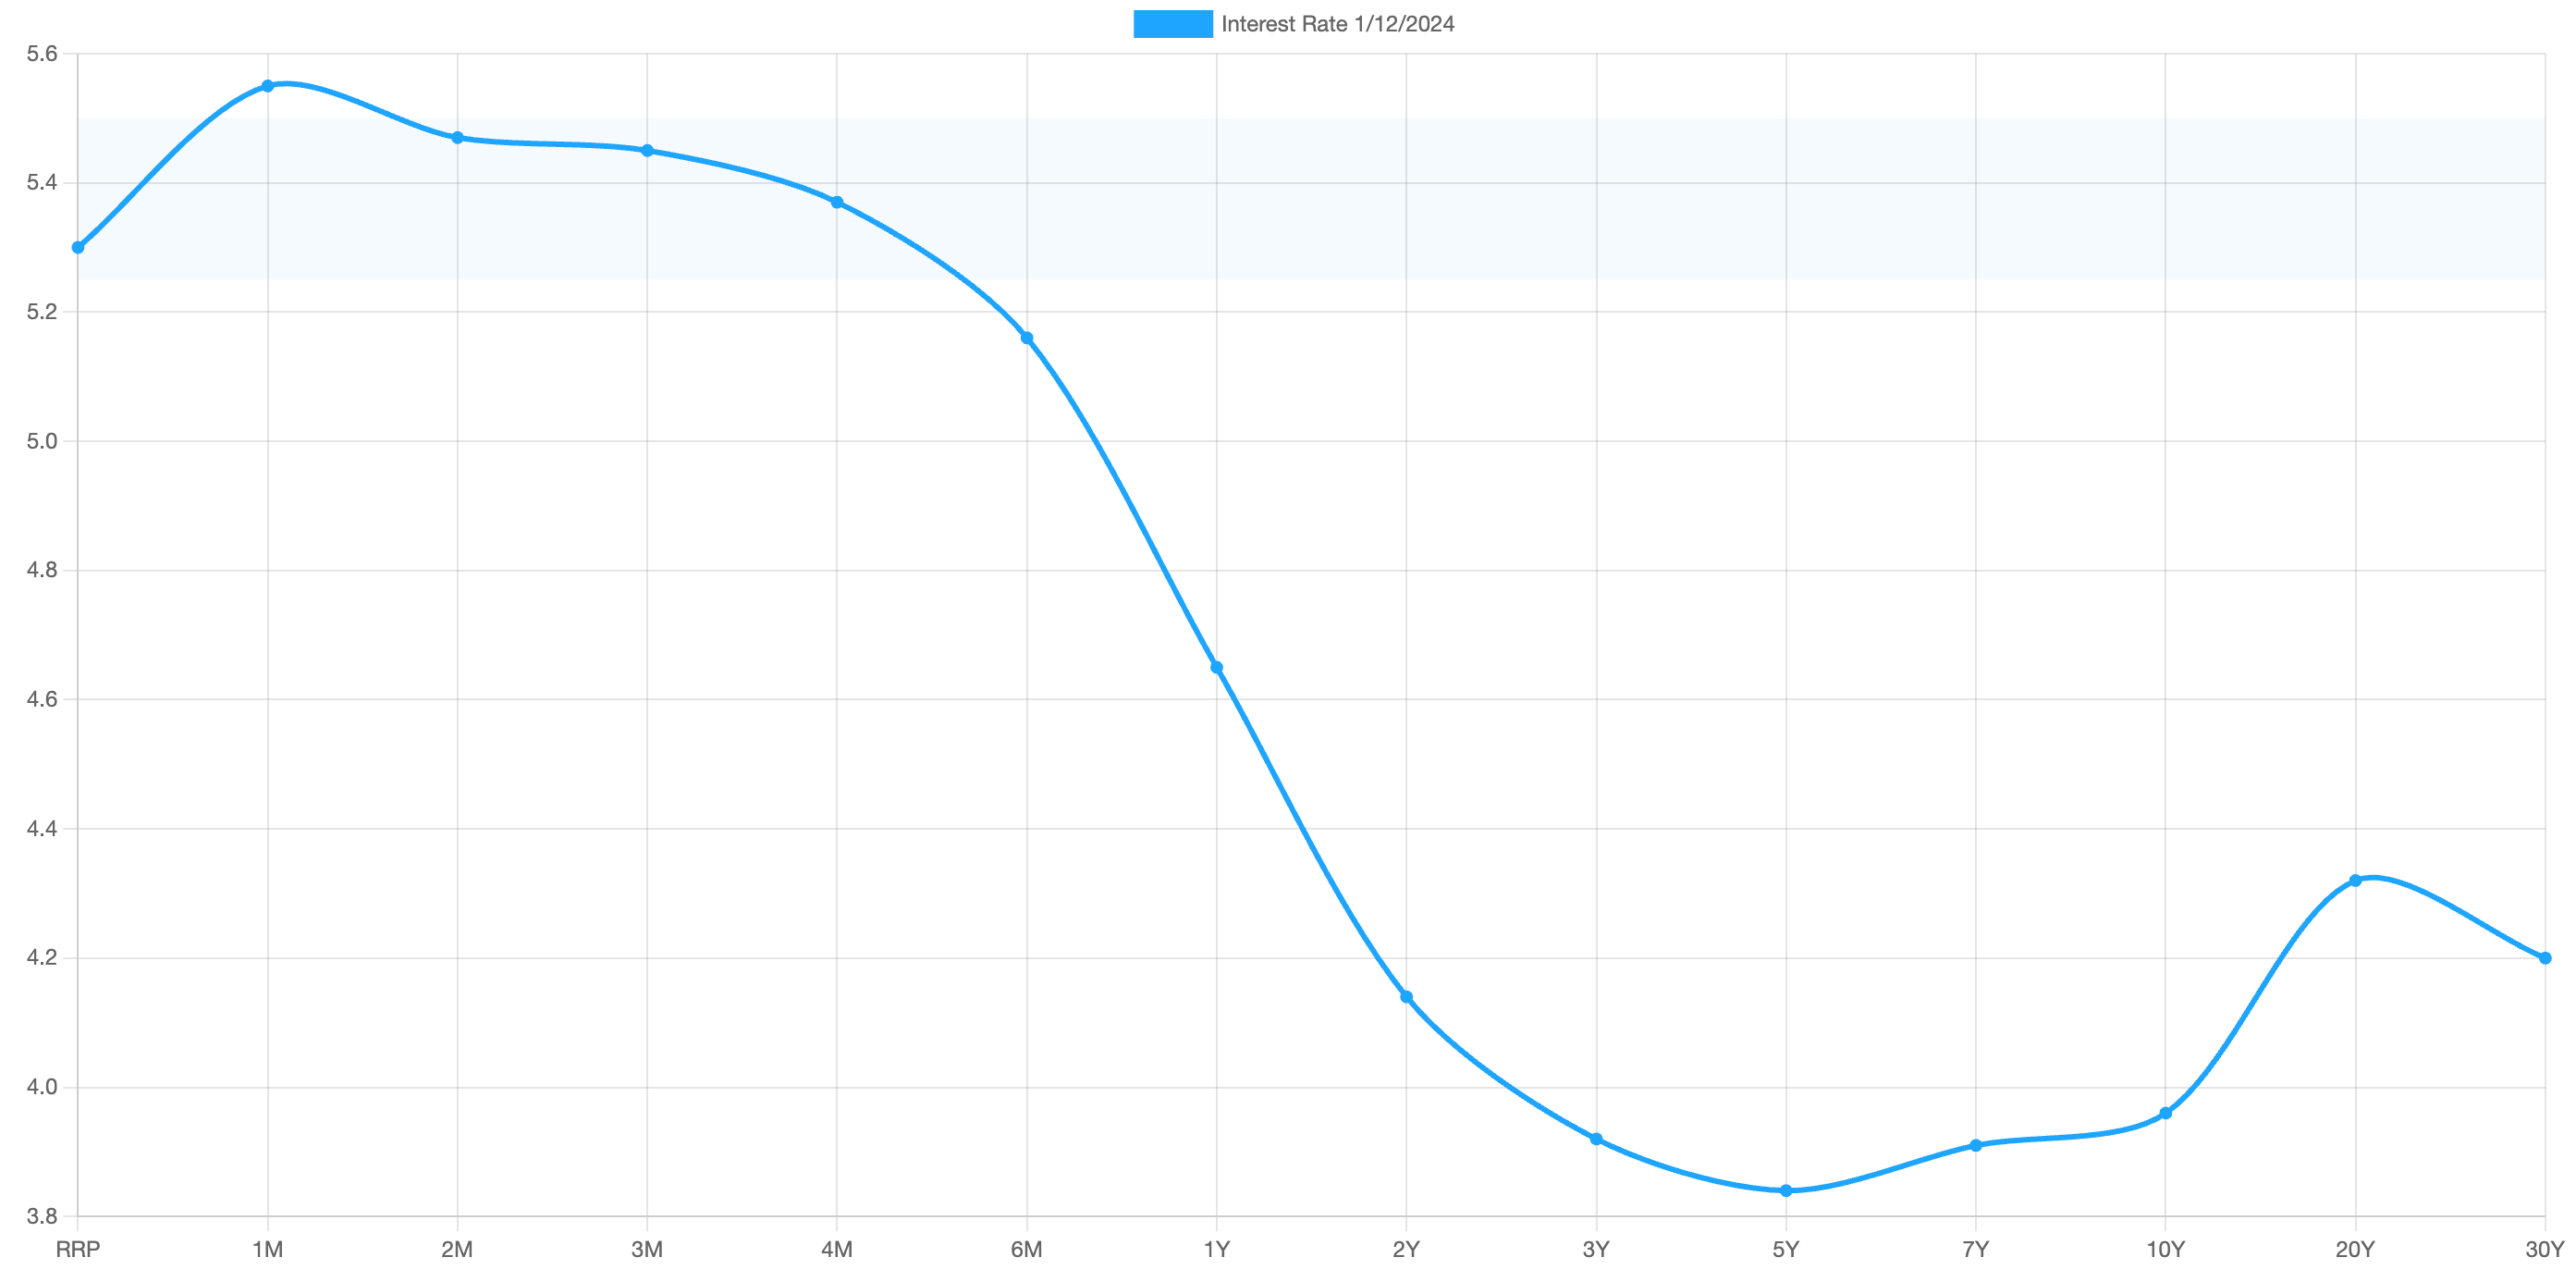
The highest rate on the yield curve (5.55%) is being paid for the 1-month duration and the lowest rate (3.84%) is for the 5-year.
The most closely-watched and commonly-used comparative measure of the spread between the 2-year and the 10-year fell from 0.35% to 0.18%, indicating a flattening in the inversion of the curve.
The interest rate yield curve remains unusually “inverted” (i.e. shorter term interest rates are generally higher than longer term ones). Based on the 2-year vs. 10-year spread, the curve has been inverted since July 2022.
Historically, an inverted yield curve is not the norm and has been regarded by many as a leading indicator of an impending recession, with shorter term risk deemed to be unusually higher than longer term. The steeper the inversion, the greater the deemed risk of recession.
Data courtesy of ustreasuryyieldcurve.com as of Friday. Lightly shaded area on the chart shows the current Federal Funds rate range.
WWW.ANGLIAADVISORS.COM | SIMON@ANGLIAADVISORS.COM | CALL OR TEXT: (929) 677 6774 | FOLLOW ANGLIA ADVISORS ON INSTAGRAM
This material represents a highly opinionated assessment of the financial market environment based on assumptions and prevailing data at a specific point in time and is always subject to change at any time. No warranty of its accuracy or completeness is given. It is never to be interpreted as an attempt to forecast any future events, nor does it offer any kind of guarantee of any future results, circumstances or outcomes.
The material contained herein is not necessarily complete and is wholly insufficient to be exclusively relied upon as research or investment advice or as a sole basis for any investment or other financial decisions. The user assumes the entire risk of any decisions made or actions taken based in whole or in part on any of the information provided in this or any Anglia Advisors communication of any kind. Under no circumstances is any of Anglia Advisors’ content ever intended to constitute tax, legal or medical advice and should never be taken as such. Neither the information contained or any opinion expressed herein constitutes a solicitation for the purchase of any security or asset class.
Posts may contain links or references to third party websites or may post data or graphics from them for the convenience and interest of readers. While Anglia Advisors may have reason to believe in the quality of the content provided on these sites, the firm has no control over, and is not in any way responsible for, the accuracy of such content nor for the security or privacy protocols that external sites may or may not employ. By making use of such links, the user assumes, in its entirety, any kind of risk associated with accessing them or making use of any information provided therein.
Those associated with Anglia Advisors, including clients with managed or advised investments, may maintain positions in securities and/or asset classes mentioned in this post.

If you enjoyed this post, why not share it with someone or encourage them to subscribe themselves?


