


Last week saw a pretty dismal month of April finally come to an end with most indexes suffering a >4% loss for the month, the first monthly setback of the year. But stocks enjoyed a second consecutive week of higher prices after a wild ride that navigated some big earnings reports, a Fed interest rate decision meeting and a Jobs Report.
The bulls remained in the driver's seat from the previous week on Monday as the recently-shaky stock prices of Apple and Tesla continued their recent recoveries and helped drag all the indexes modestly higher on the day, taking the S&P 500 to its highest level for a couple of weeks, ahead of a tsunami of Q1 earnings reports.
There was a tangible change of mood however on Tuesday as stocks seemed absolutely determined to move lower ahead of Fed chairman Jerome Powell’s press conference the next day which suddenly had the feel of a possible big downside catalyst. Any excuse would do and when the normally-overlooked data point of the Employment Cost Index came in a tad hotter than expected and the very flawed statistic of Consumer Confidence came in colder, this was all that was needed to trigger a big spike in Treasury yields and a major selloff in stocks that sent the indexes plunging.
Before markets opened on Wednesday, Amazon came out with a very robust earnings report, but Starbucks and CVS disappointed and their respective stock prices all responded accordingly. The market in general, however, basically did nothing all morning, holding its collective breath ahead of hearing from Powell and taking a largely as-expected Job Openings and Labor Turnover Survey (JOLTS) report in its stride.
There was of course no change made to the Fed Funds interest rate, everyone knew that was going to be the case. The press conference was interesting though, as Powell skillfully threaded the needle, remaining absolutely on message that there will be interest rate cuts coming at some point, it’s just a matter of when. While acknowledging that recent data had shown inflation stickiness to be a real thing and that this was hampering the Fed’s ability to cut interest rates right now, he scornfully laughed off the idea that the next move would be to raise rates.
Stocks and bonds initially lapped this all up and indexes exploded higher and bond yields fell hard as soon as Powell appeared to rule out a rate increase, with the S&P 500 jumping 1.2% in a matter of minutes. But stock prices then quickly reversed back lower to finish a smidge down on the day after seeming to recalibrate his message as actually having been; ok, we aren't about to raise interest rates, but we are still a long way from having enough confidence that inflation is under control to lower them anytime soon.
Wall Street’s mood swung back to positive on Thursday and stocks rose nicely with the rate hike boogeyman apparently dead. But there was a little caution in the air as there were still plenty of wildcards to be negotiated before the relative safety of the weekend, with earnings from Apple (AAPL) after the bell and a big Jobs Report the next day.
The Apple earnings report, the final one this season from the big guns, showed continued sales declines around the world and ongoing challenging conditions in China, but nothing was as bad as had been feared. This saw the stock price shoot higher in the after-market, helped by the announcement of a dividend increase and the biggest stock buyback in history.
Pre-market on Friday, we learned from the Jobs Report that payrolls rose 175k in April, somewhat below expectations but still very solid. The unemployment rate was 3.9%, a fraction above both estimates and the previous month and, importantly for inflation optimism, wage growth rose only 0.2% month-to-month, below the 0.3% prediction.
If Wall Street could have created a perfect jobs report in a laboratory, it would have looked just like this. Stocks screamed higher and Treasury yields plummeted, boosted by both the Apple data from the night before and the impeccable Jobs Report before taking something of a cold shower around lunchtime, but all the indexes still closed solidly higher on the day and back into the green for the week. Tuesday’s misery and pessimism suddenly seemed a million miles away, emphasizing the exhausting data-addicted rollercoaster nature of the markets right now.
The interest rate futures market swiftly pulled forward the most likely month for the first rate cut to September from December, with the probability of a second cut in 2024 now priced at about 50/50.
Wall Street seems unable to stay in the middle right now when it comes Fed expectations. It seems to constantly gyrate from the glass is completely full (six or seven interest rate cuts in 2024) to there’s nothing left in the glass at all (the next move is an interest rate increase) spending very little time anywhere in between and had convinced itself over the past couple of weeks that Powell could put rate hikes back on the table at this meeting, only to see him reject the idea out of hand.
OTHER NEWS ..
Finally! .. The term “Magnificent Seven” has been finally retired by analysts and the financial media as there’s overdue acceptance that Telsa (TSLA) ain’t exactly magnificent since, despite a recent rebound, over a third of the company’s value has evaporated just in 2024. This has resulted in Tesla’s rank by market capitalization now falling to #12.
So, for the moment, the elite group of largest U.S. companies is now being referred to as “The Big Six.” (MSFT, AAPL, GOOGL, AMZN, NVDA and META) Unlike the Mag-7, which was being dragged down by TSLA’s dismal performance, the Big Six are generally in well-defined multi-year uptrends.
Hero To (Almost) Zero .. Peloton (PTON), the poster child of a pandemic 2021 darling that then became a disastrous POS stock, fell to new all-time lows last week as a calamitous earnings report showed deepening losses, collapsing revenue and the number of both equipment purchasers and subscribers falling by the tens of thousands. The company announced the departure if its CEO, Barry McCarthy and a fifth round of layoffs, this time slashing 15% of the remaining global work force. The stock price has fallen 98.4% from its peak in July 2021.
Another One Bites The Dust .. Billionaire Changpeng Zhao (CZ to his crypto buddies and the formerly-fawning media), founder of the world’s biggest crypto exchange, Binance, was sentenced to four months in prison, a significantly lighter punishment than requested by prosecutors who hoped to send a message about rampant crime in the crypto industry. His incarceration means that both of the former top dogs of crypto world (CZ and SBF) are currently felons behind bars on fraud and other criminal convictions.
THIS WEEK’S UPCOMING CALENDAR ..
While there’ll still be plenty of earnings reports to feast on this week, things will be quieter on the economic data front.
Earnings releases will include Disney, Uber, AirBnb, BP, Occidental Petroleum, BioNTech, Warner Bros., Anheuser-Busch, Palantir Technologies, Tyson Foods, Ferrari, Honda, Roblox, Wynn Resorts and NRG Energy.
Economic data to watch includes the Federal Reserve's Consumer Credit Data and the University of Michigan's Consumer Sentiment Index
The Bank of England will announce a monetary-policy decision this week and is widely expected to keep its target interest rate unchanged.
ARTICLE OF THE WEEK ..
Got money to spend? How to best do that.
LAST WEEK BY THE NUMBERS ..
Last week’s market color courtesy of finviz.com
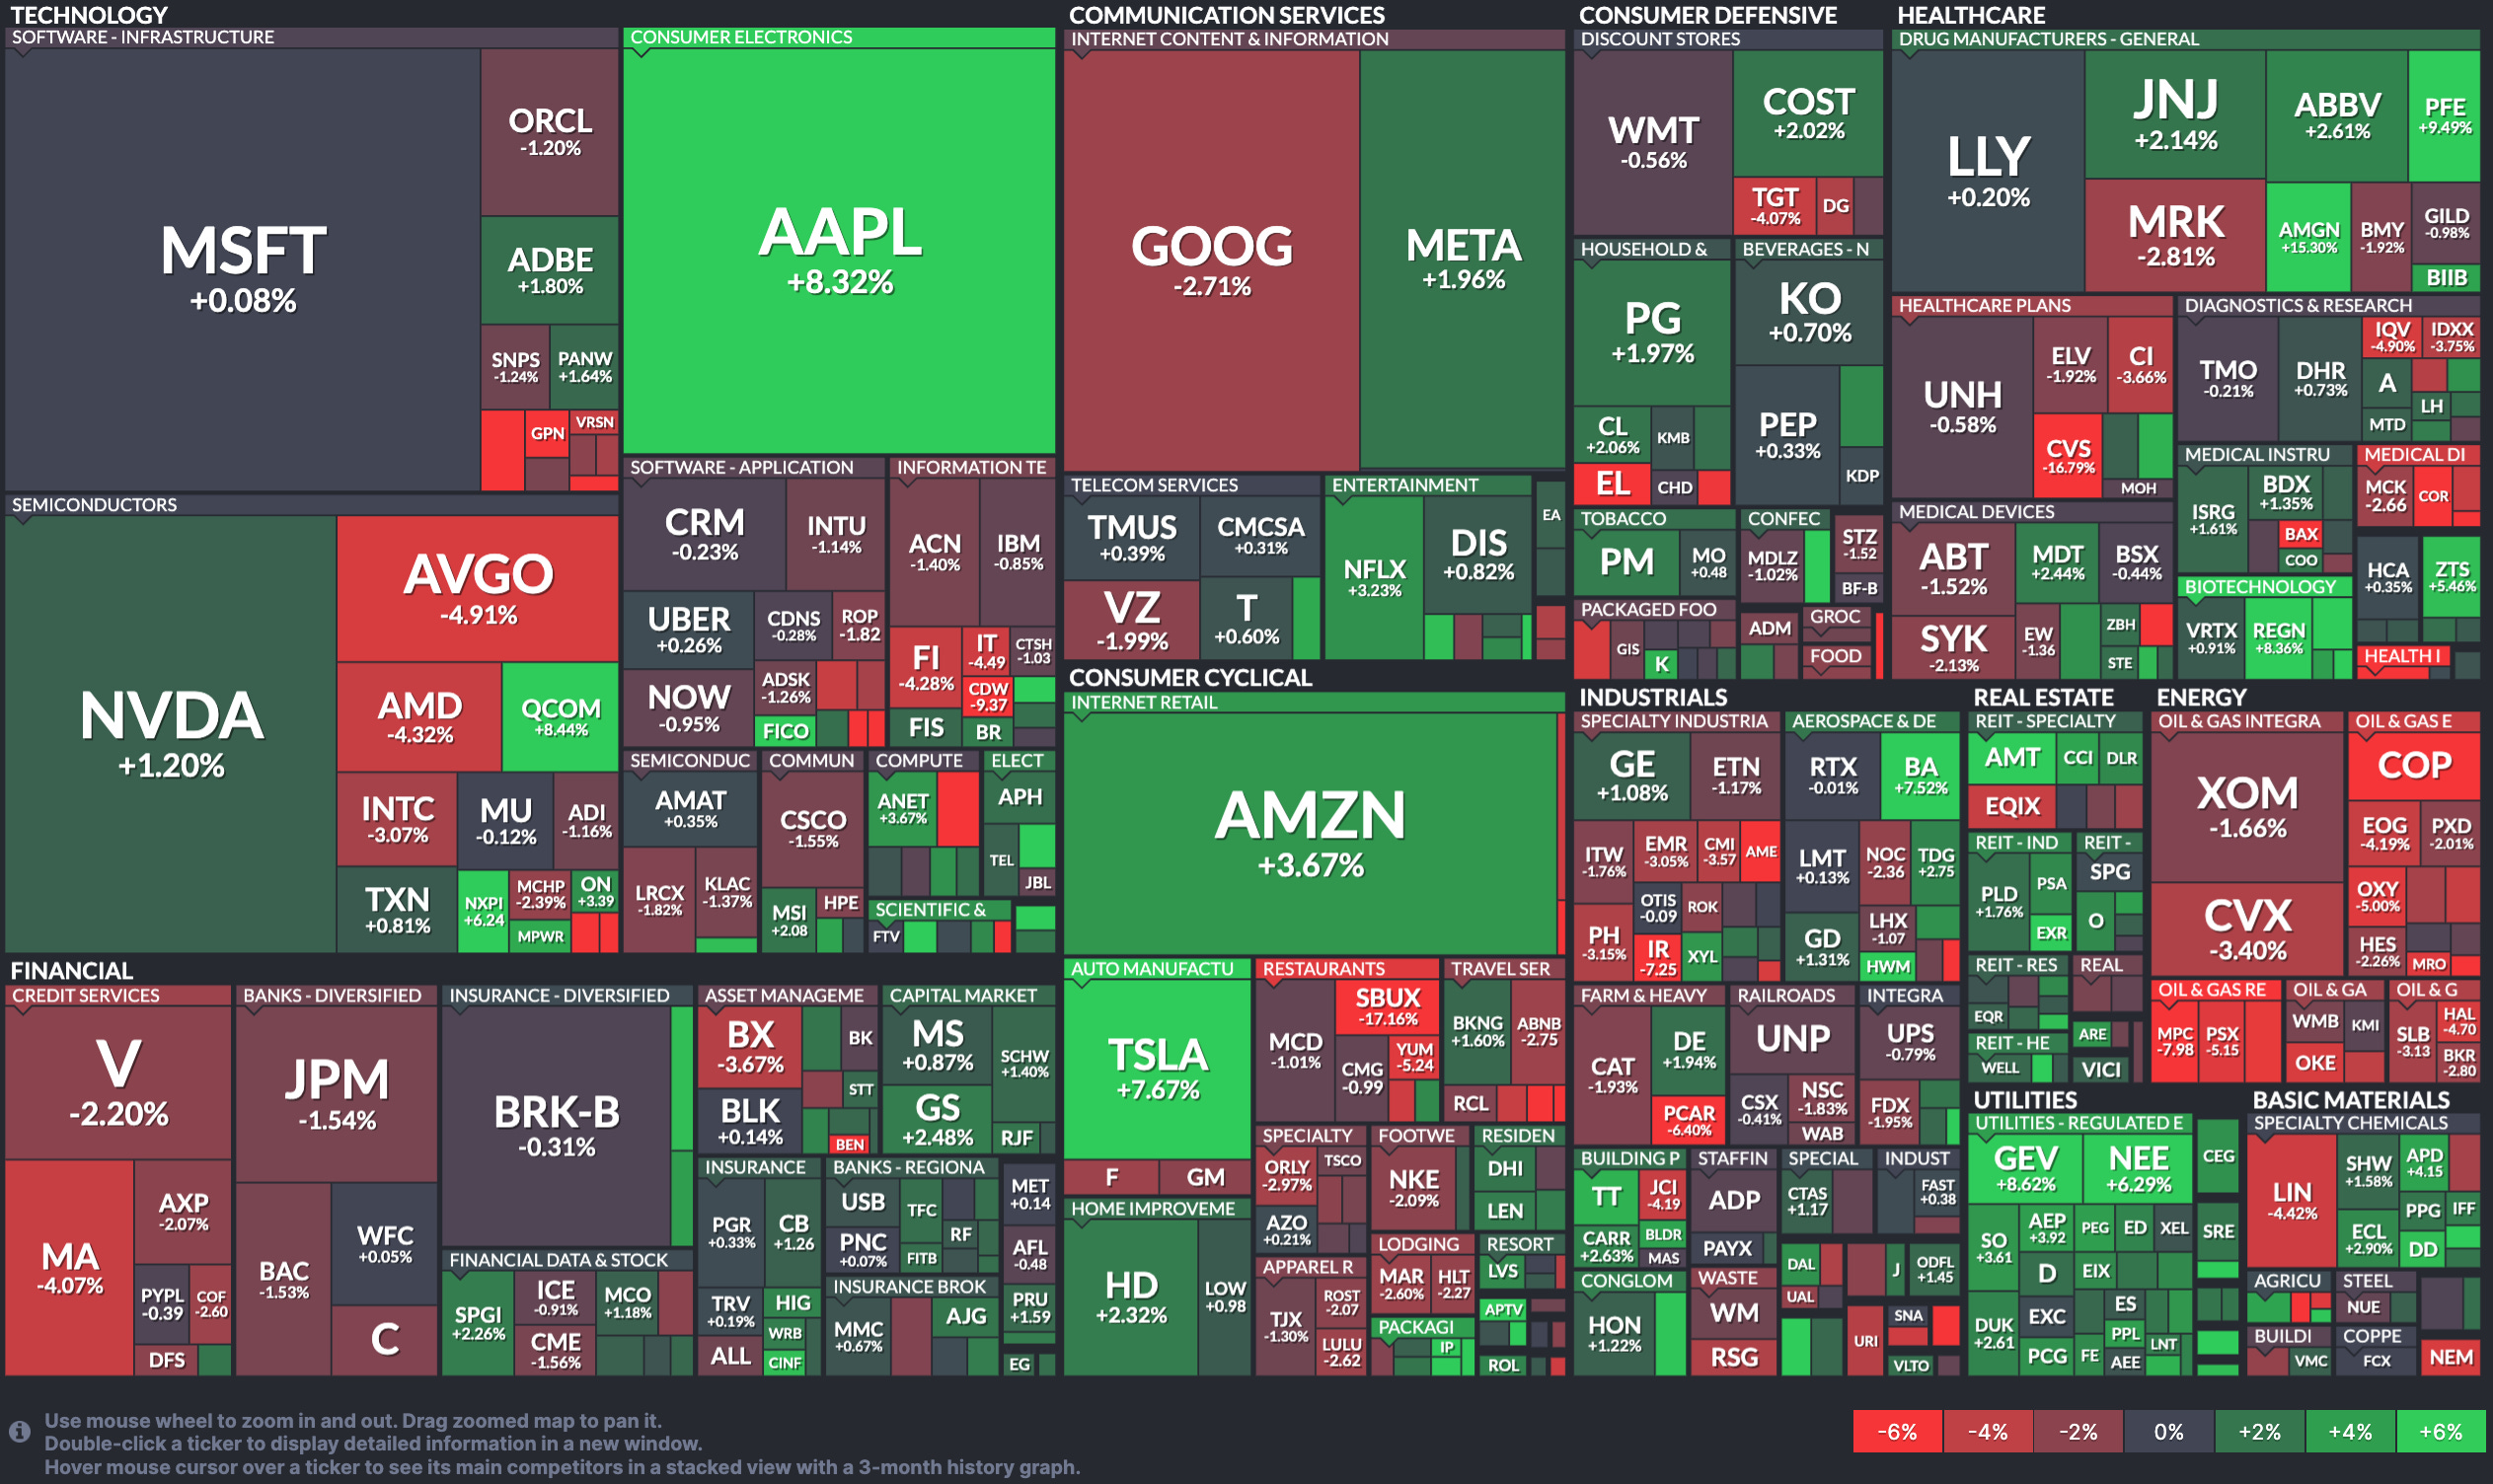
Last week’s best performing U.S. sector: Utilities (two biggest holdings: Next Era Energy, Southern Co.) - up 3.8% for the week.
Last week’s worst performing U.S. sector: Energy (two biggest holdings: Exxon-Mobil, Chevron) - down 3.3% for the week.
SPY, the S&P 500 Large Cap ETF, is made up of the stocks of the 500 largest U.S. companies. Its price rose 0.8% last week, is up 7.6% so far this year and ended the week 2.3% below its all-time record closing high (03/27/2024)
IWM, the Russell 2000 Small Cap ETF, is made up of the bottom two-thirds in terms of company size of the group of the 3,000 largest U.S. stocks. Its price rose 2.0% last week, is up 0.6% so far this year and ended the week 16.8% below its all-time record closing high (11/08/2021)
DXY, the U.S. Dollar index, is an index that measures the value of the U.S. Dollar against a weighted basket of six other major currencies (the Euro, the Japanese Yen, the British Pound, the Canadian Dollar, the Swedish Krone and the Swiss Franc). It was down 0.6% last week, is up 3.7% so far this year and is up 15.5% over the last three years.
AVERAGE 30-YEAR FIXED MORTGAGE RATE ..
7.22%
One week ago: 7.17%, one month ago: 6.82%, one year ago: 6.39%
Data courtesy of: FRED Economic Data, St. Louis Fed as of last Thursday.
FEAR & GREED INDEX ..
“Be fearful when others are greedy and be greedy when others are fearful.” Warren Buffet.

The Fear & Greed Index from CNN Business can be used as an attempt to gauge whether or not stocks are fairly priced and to determine the mood of the market. It is a compilation of seven of the most important indicators that measure different aspects of stock market behavior. They are: market momentum, stock price strength, stock price breadth, put and call option ratio, junk bond demand, market volatility and safe haven demand.
Extreme Fear readings can lead to potential opportunities as investors may have driven prices “too low” from a possibly excessive risk-off negative sentiment.
Extreme Greed readings can be associated with possibly too-frothy prices and a sense of “FOMO” with investors chasing rallies in an excessively risk-on environment . This overcrowded positioning leaves the market potentially vulnerable to a sharp downward reversal at some point.
A “sweet spot” is considered to be in the lower-to-mid “Greed” zone.
Data courtesy of CNN Business as of Friday’s market close.
FEDWATCH INTEREST RATE TOOL ..
Will interest rates be lower than they are now after the Fed’s next meeting on June 12th?
Yes .. 8% probability (11% a week ago)
No .. 92% probability (89% a week ago)
Will interest rates be lower than they are now after the Fed’s following meeting on July 31st?
Yes .. 37% probability (31% a week ago)
No .. 63% probability (69% a week ago)
Where is the Fed Funds interest rate most likely to be at the end of 2024?
4.875% (0.50% lower than where we are now, implying two rate cuts before the end of 2024)
One week ago: 5.125% (implying one rate cut), one month ago: 4.625% (implying three rate cuts)
All data based on the Fed Funds rate (currently 5.375%). Calculated from Federal Funds futures prices as of the market close on Friday. Data courtesy of CME FedWatch Tool.
The 50-day moving average of the S&P 500 remains above the 200-day. This is a continued indication of an ongoing technical uptrend.
% OF S&P 500 STOCKS TRADING ABOVE THEIR 50-DAY MOVING AVERAGE ..
42% (212 of the S&P 500 stocks ended last week above their 50D MA and 288 were below)
One week ago: 45%, one month ago: 72%, one year ago: 45%
% OF S&P 500 STOCKS TRADING ABOVE THEIR 200-DAY MOVING AVERAGE ..
72% (361 of the S&P 500 stocks ended last week above their 200D MA and 139 were below)
One week ago: 71%, one month ago: 77%, one year ago: 45%
Closely-watched measures of market breadth and participation, providing a real-time look at how many of the largest 500 publicly-traded stocks in the U.S. are trending higher or lower, as defined by whether the stock price is above or below their more sensitive 50-day (short term) and less sensitive 200-day (long term) moving averages which are among the most widely-followed of all stock market technical indicators.
The higher the reading, the better the deemed health of the overall market trend, with 50% considered to be a key pivot point. Readings above 90% or below 15% are extremely rare.
WEEKLY US INVESTOR SENTIMENT (outlook for the upcoming 6 months) ..
↑Bullish: 39% (32% a week ago)
⬌ Neutral: 29% (34% a week ago)
↓Bearish: 32% (34% a week ago)
Net Bull-Bear spread: ↑Bullish by 7 (Bearish by 2 a week ago)
For context: Long term averages: Bullish: 38% — Neutral: 32% — Bearish: 30% — Net Bull-Bear spread: Bullish by 8
Survey participants are typically polled during the first half of the week.
Data courtesy of: American Association of Individual Investors (AAII).
HIGH YIELD CREDIT SPREAD ..
3.16%
One week ago: 3.24%, one month ago: 3.12%, one year ago: 4.73%
This closely-watched spread is a strong indicator of the risk inherent in the professional marketplace and the extent to which such risk is growing or easing. The high-yield credit spread is the difference between the interest rates offered for riskier low-grade, high yield (“junk”) bonds and those for stable high-grade, lower yield bonds, including deemed risk-free government bonds, of similar maturity.
A reading that is high/increasing indicates that “junkier” bond issuers are being forced to move their yields higher to compensate for a greater risk of default and is considered to be a reflection of broadly deteriorating economic and market conditions which could well lead to lower stock prices.
A reading that is low/decreasing indicates a reduced necessity for higher yields. This reflects less prevailing market risk and more stable or improving conditions in the overall economy and for stock prices.
For context .. this reading was regularly below 3.00% for much of the 1990s, got as high as 10.59% after 9/11 and the subsequent Dotcom Crash of 2002, peaked at 21.82% in the Great Financial Crisis in December 2008 and spiked from 3.62% to 10.87% in the space of about a month during the February/March 2020 COVID crash. The historical average since 1996 is a little over 4.00%.
Data courtesy of: FRED Economic Data, St. Louis Fed as of Friday’s market close.
US TREASURY INTEREST RATE YIELD CURVE ..

The highest rate on the yield curve (5.51%) is being paid for the 1-month duration and the lowest rate (4.48%) is for the 5-year.
The most closely-watched and commonly-used comparative measure of the spread between the higher 2-year and the lower 10-year rose from 0.29% to 0.31%, indicating a steepening in the inversion of the curve last week.
The interest rate yield curve remains unusually “inverted” (i.e. shorter term interest rates are generally higher than longer term ones). Based on the 2-year vs. 10-year spread, the curve has been inverted since July 2022.
Historically, an inverted yield curve is not the norm and has been regarded by many as a leading indicator of an impending recession, with shorter term risk regarded to be unusually higher than longer term. The steeper the inversion, the greater the deemed risk of recession.
Data courtesy of ustreasuryyieldcurve.com as of Friday. The lightly shaded area on the chart shows the current Federal Funds rate range.
WWW.ANGLIAADVISORS.COM | SIMON@ANGLIAADVISORS.COM | CALL OR TEXT: (646) 286 0290 | FOLLOW ANGLIA ADVISORS ON INSTAGRAM
This material represents a highly opinionated assessment of the financial market environment based on assumptions and prevailing data at a specific point in time and is always subject to change at any time. Although the content is believed to be correct at the time of publication, no warranty of its accuracy or completeness is given. It is never to be interpreted as an attempt to forecast any future events, nor does it offer any kind of guarantee of any future results, circumstances or outcomes.
The material contained herein is not necessarily complete and is wholly insufficient to be exclusively relied upon as research or investment advice or as a sole basis for any investment or other financial decisions. The user assumes the entire risk of any decisions made or actions taken based in whole or in part on any of the information provided in this or any Anglia Advisors communication of any kind. Under no circumstances is any of Anglia Advisors’ content ever intended to constitute tax, legal or medical advice and should never be taken as such. Neither the information contained or any opinion expressed herein constitutes a solicitation for the purchase of any security or asset class.
Posts may contain links or references to third party websites or may post data or graphics from them for the convenience and interest of readers. While Anglia Advisors might have reason to believe in the quality of the content provided on these sites, the firm has no control over, and is not in any way responsible for, the accuracy of such content nor for the security or privacy protocols that external sites may or may not employ. By making use of such links, the user assumes, in its entirety, any kind of risk associated with accessing them or making use of any information provided therein.
Those associated with Anglia Advisors, including clients with managed or advised investments, may maintain positions in securities and/or asset classes mentioned in this post.

If you enjoyed this post, why not share it with someone or encourage them to subscribe themselves?


