


In the end it proved to be a rotten week for U.S. stocks. A geopolitical shadow hung over markets the whole time with American officials warning of an imminent Iranian reprisal for Israel’s recent deadly air strike against a consulate in Syria, which kept the price of oil very perky. Meanwhile domestically, the big news was more hot inflation data and a slowly-emerging troubling concern about the prospects for interest rate cuts in 2024.
JPMorgan Chase CEO Jamie Dimon used his annual letter to shareholders on Monday to add his voice to the quietly growing chorus of those warning that the Fed’s next move might not be an interest rate cut at all, but rather a rate increase. He listed factors including ongoing fiscal spending, increased U.S. remilitarization, restructuring of global trade, continued geopolitical unrest and the capital demands of a new green economy as inflationary factors that could feasibly result in interest rates in fact moving higher this year, contrary to the conventional wisdom that interest rate cuts are just around the corner.
Stock traders, however, appeared to be biding their time to start the week, preferring to focus more on the eclipse and swapping highly dramatic (!!) New York earthquake stories ahead of U.S. inflation data out later in the week and prices barely moved on what was the second-lowest trading volume day of the year so far.
Tuesday was no different, another lackluster trading session for stocks with indexes little changed for a second straight day. Market interest rates continued their relentless march higher with the 2 year, 5 year and 10 year Treasury yields all touching new highs for the year. This pushed bond prices lower.
Pre-market on Wednesday, the release of the Consumer Price Index (CPI) measure of retail inflation showed that stubborn upward price pressures persisted in March, appearing to slam the door shut on any lingering hopes of a Fed interest rate cut in either May or June, especially since the May CPI reading is scheduled to come out on the same day as the Fed's June decision. Even the probability of a cut in July was pretty much reduced to a toss-up (see FEDWATCH INTEREST RATE TOOL below).
March CPI rose 3.5% from a year earlier, higher than forecast and a meaningful pickup from February’s 3.2%. So-called Core prices (ex. food and energy) rose 3.8% from a year earlier, unchanged from the previous month but above expectations. This was the third consecutive hotter-than-anticipated inflation reading and reinforced the fact that, while inflation is not showing signs of rebounding, its decline has definitely stalled.
The stock market’s verdict was swift and brutal, it headed straight into free-fall right from the opening bell. The “zero-interest-rate-cut-in-2024-in-fact-expect-interest-rate-increases” theory of Jamie Dimon and friends suddenly did not seem so fanciful after all. Indeed, once ex-Treasury Secretary Larry Summers endorsed the theory on Bloomberg TV after seeing the inflation numbers, this particular elephant in the room suddenly started to become visible to everyone.
Those Treasury yields soared higher again, deeper into new 2024 record territory, sending bond prices spiraling even lower. Even the often-overly-optimistic futures market-driven expected total number of interest rate cuts in 2024 ticked down from three to two (remember, as recently as January, these same markets were assuming seven!).
The inflation picture got a bit more muddled on Thursday morning, when CPI’s cousin, the Producer Price Index (PPI) measure of wholesale inflation experienced by manufacturers, actually came in a touch softer than expected. This helped stop the bleeding to a certain extent as both stock and bond prices stabilized following the rout of the previous day, indeed the NASDAQ in particular had something of a healthy pop, helped by Amazon’s stock price hitting a new all-time high.
Friday was the official kick-off of the Q1 2024 earnings season and the traditional curtain-raiser of earnings and forecasts from some of the major banks could be described as mixed at best. With spiking fears of an imminent flare-up in the Middle East conflict and the ongoing intertwined inflation and interest rate concerns, stock markets swiftly resumed their sharp downward trajectory and by the close, Friday’s nosedive had proved to be even worse than Wednesday’s.
Although it was clearly responsible for a major selloff in stocks last week, I want to put forward the case that the March CPI number was not, of itself, quite the destructive negative game-changer that many seem to now be fearing.
Contrary to what you may be seeing on TikTok and on the more wacky fringes of Fox Business, we are not yet witnessing a rebound in inflation. Just that the decline has stalled. Annualized rates are heavily dependent on the base number from a year earlier and even the 0.4% monthly increase was actually 0.359% if taken out an extra decimal place meaning that it was in fact only one hundredth of one percent away from actually meeting the expectations of a 0.3% increase, which might well have elicited a less dramatic market response.
Higher interest rates and elevated inflation do not of themselves mean stock prices are in danger of falling. The keys are growth and earnings, which we need to watch very closely since the safety net of imminent interest rate cuts is now likely gone. If Q1 2024 earnings are strong and economic growth remains stable, then stocks can still move higher despite lofty market interest rates and limited or even no Fed rate cuts.
With “higher for longer” interest rates as a result of inflation’s stickiness, the dominance of tech will likely continue to fade, most probably making way for sectors like financials (Friday’s earnings notwithstanding), consumer defensive, healthcare and energy. This could lead to a more unified, less fragmented stock market that could be a rising tide that lifts all boats.
It’s entirely possible that last week’s experience will soon be either a) a rather forgettable speed-bump in a continuing upward march in stock prices or, b) the turning point that brought the October 2023-April 2024 rally to an end. Which it is will be determined by how earnings and economic growth shake out in the coming weeks.
OTHER NEWS ..
Front-Running? .. Unlike the Federal Reserve, the European Central Bank (ECB) seems quite happy to show that it is poised to kick off the global interest rate-cutting cycle among major economies very soon. It strongly hinted on Thursday that this would happen in June, which would likely front-run the Fed.
Air Contrast .. The share price of Boeing fell hard last week after a whistleblower claimed it took a number of shortcuts (including using Dawn dishwashing liquid as a lubricant for fitting a door) to speed up the assembly of the 787 Dreamliner and that the model is at severe risk of aging prematurely. The plane maker had earlier called such accusations “inaccurate” , but delivered the fewest aircraft in a quarter since mid-2021.
This is in stark contrast to the fortunes of one of the firm’s largest clients, Delta Air Lines whose forecast for this quarter blew past Wall Street’s estimates. It’s largely a function of well-heeled passengers willing to pay top fares rather than price-conscious flyers shopping for basic economy toward the rear of the plane. Revenue from the group of these more affluent flyers jumped 10% annualized last quarter, compared with 4% for the main cabin.
More Delinquency .. U.S. credit-card delinquency rates have hit a record level. Almost 3.5% of balances were at least 30 days past-due at the end of December, according to the Philadelphia Fed. That’s the highest figure since 2012. About 10% of borrowers now have an account balance that exceeds $5,200 and credit scores are getting worse.
The numbers signal added pressure on household finances in an era of swiftly increased interest rates. Only about one-third of cardholders pay their balance in full every month.
UNDER THE HOOD ..
The near-20% divergence between the best and worst performing sectors of 2024 (energy and utilities, respectively) is high by historical standards and the long overdue and regularly-predicted market pullback appears to be under way.
Shorter term indicators had made this almost a certainty with decreasing momentum after the extraordinary market trajectory since last October in Large Caps in particular. The short term pain may continue for a while yet, but primary trends in technical indicators, even the more sensitive intermediate-term ones, are continuing to reflect a healthy market environment.
Anglia Advisors clients are welcome to reach out to me to discuss market conditions further.
THIS WEEK’S UPCOMING CALENDAR ..
About one-in-ten S&P 500 companies will report results this week, as Q1 2024 earnings season begins to get going. The consensus forecast is currently for an aggregated 5% year-over-year per share earnings growth from the companies in the index.
Netflix, Goldman Sachs, Bank of America, Proctor and Gamble, Johnson & Johnson, American Express, Morgan Stanley, United Airlines, UnitedHealth Group, Charles Schwab, TSMC, Abbot Labs, ASML, Schlumberger and Prologis are among the standouts.
The main highlight on the economic calendar next week is Monday’s Retail Sales report for March. There will also be a swarm of data on the U.S. housing market.
ARTICLE OF THE WEEK ..
Home ownership affordability is at its worst levels since the 1980s. And it’s about a lot more than just higher mortgage rates.
LAST WEEK BY THE NUMBERS ..
Last week’s market color courtesy of finviz.com
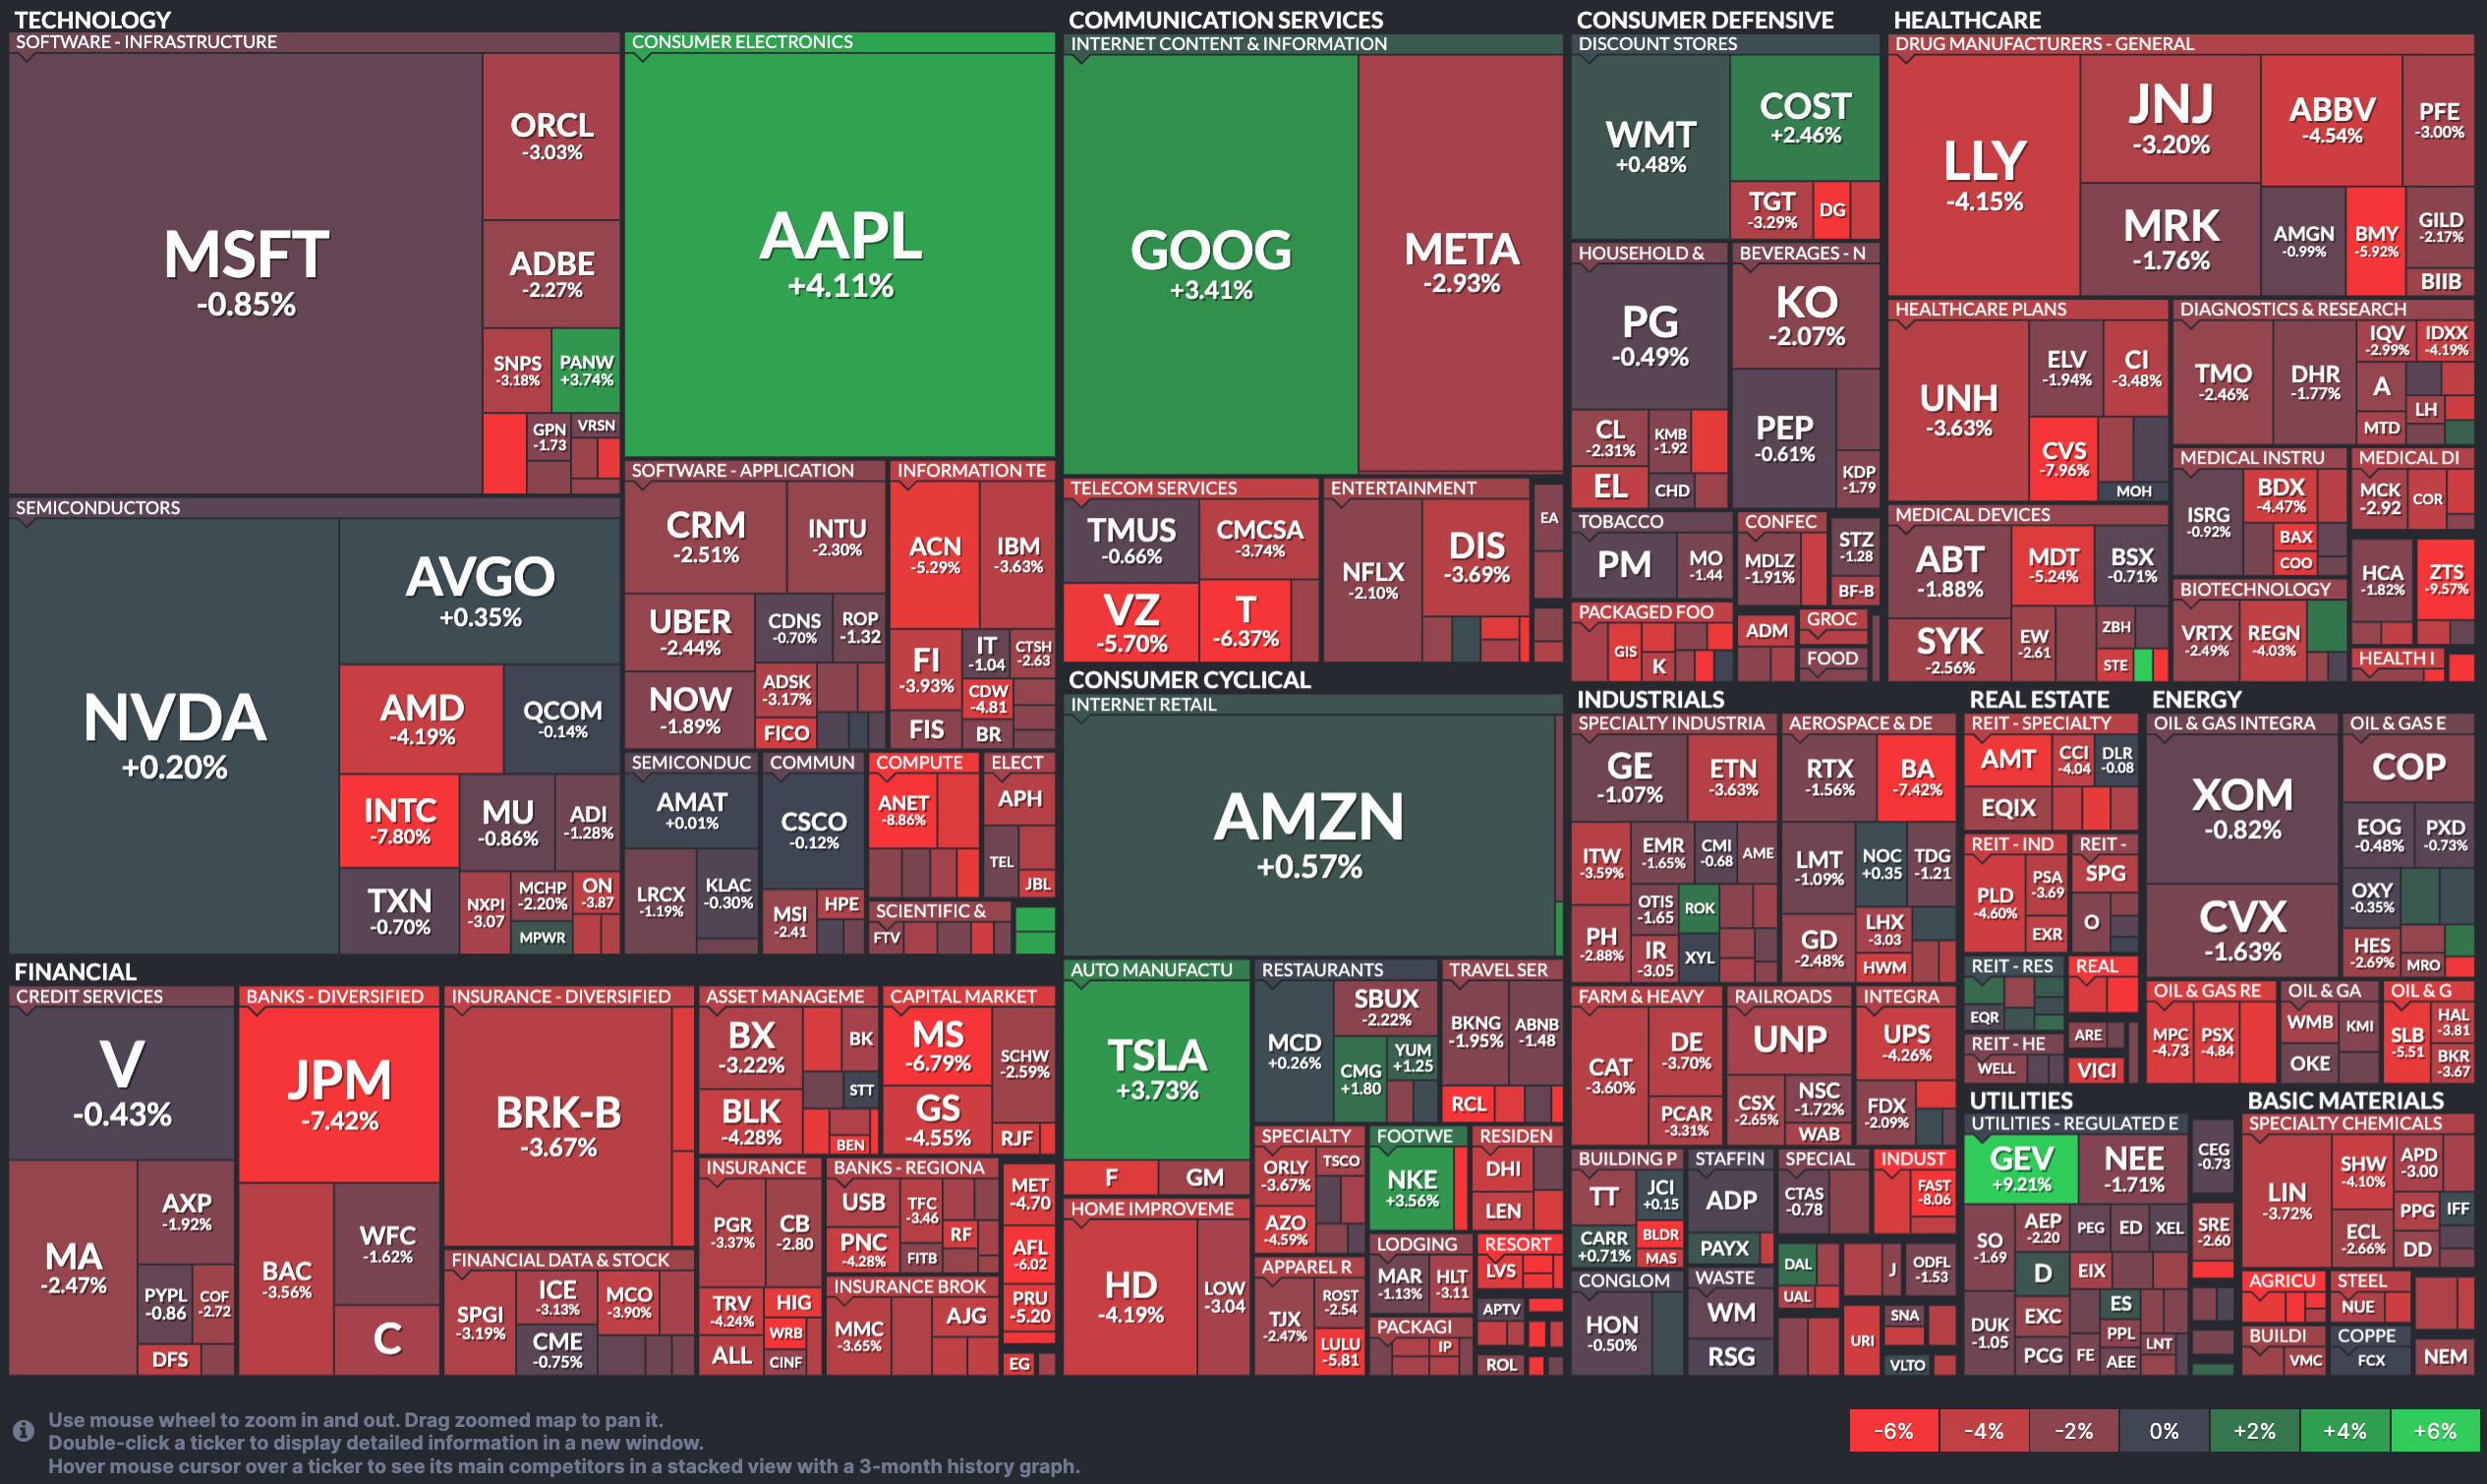
Last week’s best performing U.S. sector: Energy (two biggest holdings: Exxon-Mobil, Chevron) - down 0.5% for the week.
Last week’s worst performing U.S. sector: Financials (two biggest holdings: Berkshire Hathaway, JPMorgan Chase) - down 3.7% for the week.
SPY, the S&P 500 Large Cap ETF, is made up of the stocks of the 500 largest U.S. companies. Its price fell 1.6% last week, is up 7.5% so far this year and ended the week 2.3% below its all-time record closing high (03/28/2024)
IWM, the Russell 2000 Small Cap ETF, is made up of the bottom two-thirds in terms of company size of the group of the 3,000 largest U.S. stocks. Its price fell 3.1% last week, is down 1.0% so far this year and ended the week 18.1% below its all-time record closing high (11/08/2021)
DXY, the U.S. Dollar index, is an index that measures the value of the U.S. Dollar against a weighted basket of six other major currencies (the Euro, the Japanese Yen, the British Pound, the Canadian Dollar, the Swedish Krone and the Swiss Franc). It rose 1.8% last week, is up 4.6% so far this year and is up 15.1% over the last three years.
AVERAGE 30-YEAR FIXED MORTGAGE RATE ..
6.88%
One week ago: 6.82%, one month ago: 6.88%, one year ago: 6.27%
Data courtesy of: FRED Economic Data, St. Louis Fed as of last Thursday.
FEAR & GREED INDEX ..
“Be fearful when others are greedy and be greedy when others are fearful.” Warren Buffet.
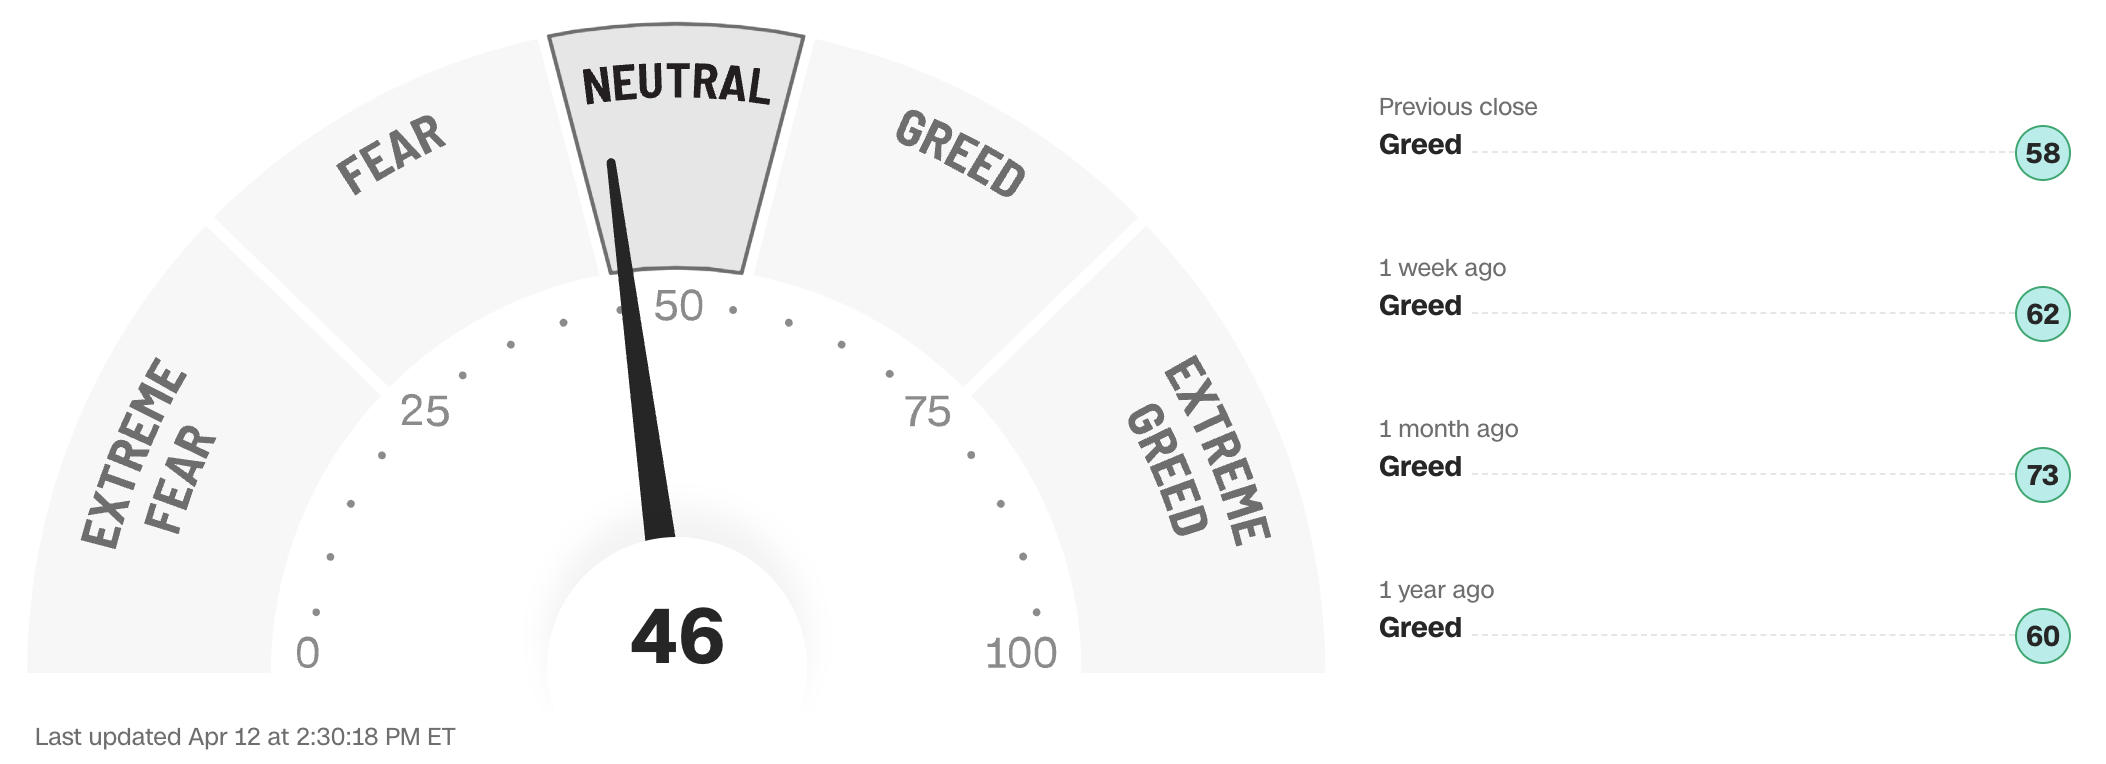
The Fear & Greed Index from CNN Business can be used as an attempt to gauge whether or not stocks are fairly priced and to determine the mood of the market. It is a compilation of seven of the most important indicators that measure different aspects of stock market behavior. They are: market momentum, stock price strength, stock price breadth, put and call option ratio, junk bond demand, market volatility and safe haven demand.
Extreme Fear readings can lead to potential opportunities as investors may have driven prices “too low” from a possibly excessive risk-off negative sentiment.
Extreme Greed readings can be associated with possibly too-frothy prices and a sense of “FOMO” with investors chasing rallies in an excessively risk-on environment . This overcrowded positioning leaves the market potentially vulnerable to a sharp downward reversal at some point.
A “sweet spot” is considered to be in the lower-to-mid “Greed” zone.
Data courtesy of CNN Business as of Friday’s market close.
The 50-day moving average of the S&P 500 remains above the 200-day. This is a continued indication of an ongoing technical uptrend.
% OF S&P 500 STOCKS TRADING ABOVE THEIR 50-DAY MOVING AVERAGE ..
40% (202 of the S&P 500 stocks ended last week above their 200D MA and 298 were below)
One week ago: 71%, one month ago: 76%, one year ago: 50%
% OF S&P 500 STOCKS TRADING ABOVE THEIR 200-DAY MOVING AVERAGE ..
69% (346 of the S&P 500 stocks ended last week above their 200D MA and 154 were below)
One week ago: 76%, one month ago: 78%, one year ago: 56%
Closely-watched measures of market breadth and participation, providing a real-time look at how many of the largest 500 publicly-traded stocks in the U.S. are trending higher or lower, as defined by whether the stock price is above or below their more sensitive 50-day (short term) and less sensitive 200-day (long term) moving averages which are among the most widely-followed of all stock market technical indicators.
The higher the reading, the better the deemed health of the overall market trend, with 50% considered to be a key pivot point. Readings above 90% or below 15% are extremely rare.
WEEKLY US INVESTOR SENTIMENT (outlook for the upcoming 6 months) ..
↑Bullish: 44% (47% a week ago)
⬌ Neutral: 33% (31% a week ago)
↓Bearish: 23% (22% a week ago)
Net Bull-Bear spread: ↑Bullish by 21 (Bullish by 25 a week ago)
For context: Long term averages: Bullish: 38% — Neutral: 32% — Bearish: 30% — Net Bull-Bear spread: Bullish by 8
Survey participants are typically polled during the first half of the week.
Data courtesy of: American Association of Individual Investors (AAII).
FEDWATCH INTEREST RATE TOOL ..
Will interest rates be lower than they are now following the Fed’s next meeting on May 1st?
Yes .. 1% probability (5% a week ago)
No .. 99% probability (95% a week ago)
Will interest rates be lower than they are now following the Fed’s following meeting on June 12th?
Yes .. 28% probability (53% a week ago)
No .. 72% probability (47% a week ago)
Where is the Fed Funds interest rate most likely to be at the end of 2024?
4.875% (0.50% lower than where we are now, implying two rate cuts of 0.25% each in 2024)
One week ago: 4.625% (implying three rate cuts), one month ago: 4.625% (implying three rate cuts)
All data based on the Fed Funds rate (currently 5.375%). Calculated from Federal Funds futures prices as of the market close on Friday. Data courtesy of CME FedWatch Tool.
HIGH YIELD CREDIT SPREAD ..
3.16%
One week ago: 3.24%, one month ago: 3.26%, one year ago: 4.62%
This closely-watched spread is a strong indicator of the risk inherent in the professional marketplace and the extent to which such risk is growing or easing. The high-yield credit spread is the difference between the interest rates offered for riskier low-grade, high yield (“junk”) bonds and those for stable high-grade, lower yield bonds, including deemed risk-free government bonds, of similar maturity.
A reading that is high/increasing indicates that “junkier” bond issuers are being forced to move their yields higher to compensate for a greater risk of default and is considered to be a reflection of broadly deteriorating economic and market conditions which could well lead to lower stock prices.
A reading that is low/decreasing indicates a reduced necessity for higher yields. This reflects less prevailing market risk and more stable or improving conditions in the overall economy and for stock prices.
For context .. this reading was regularly below 3.00% for much of the 1990s, got as high as 10.59% after 9/11 and the subsequent Dotcom Crash of 2002, peaked at 21.82% in the Great Financial Crisis in December 2008 and spiked from 3.62% to 10.87% in the space of about a month during the February/March 2020 COVID crash. The historical average since 1996 is a little over 4.00%.
Data courtesy of: FRED Economic Data, St. Louis Fed as of Friday’s market close.
US TREASURY INTEREST RATE YIELD CURVE ..

The highest rate on the yield curve (5.50%) is being paid for the 2-month duration and the lowest rate (4.50%) is for the 10-year.
The most closely-watched and commonly-used comparative measure of the spread between the higher 2-year and the lower 10-year rose from 0.34 to 0.38%, indicating a steepening in the inversion of the curve last week.
The interest rate yield curve remains unusually “inverted” (i.e. shorter term interest rates are generally higher than longer term ones). Based on the 2-year vs. 10-year spread, the curve has been inverted since July 2022.
Historically, an inverted yield curve is not the norm and has been regarded by many as a leading indicator of an impending recession, with shorter term risk regarded to be unusually higher than longer term. The steeper the inversion, the greater the deemed risk of recession.
Data courtesy of ustreasuryyieldcurve.com as of Friday. The lightly shaded area on the chart shows the current Federal Funds rate range.
WWW.ANGLIAADVISORS.COM | SIMON@ANGLIAADVISORS.COM | CALL OR TEXT: (646) 286 0290 | FOLLOW ANGLIA ADVISORS ON INSTAGRAM
This material represents a highly opinionated assessment of the financial market environment based on assumptions and prevailing data at a specific point in time and is always subject to change at any time. Although the content is believed to be correct at the time of publication, no warranty of its accuracy or completeness is given. It is never to be interpreted as an attempt to forecast any future events, nor does it offer any kind of guarantee of any future results, circumstances or outcomes.
The material contained herein is not necessarily complete and is wholly insufficient to be exclusively relied upon as research or investment advice or as a sole basis for any investment or other financial decisions. The user assumes the entire risk of any decisions made or actions taken based in whole or in part on any of the information provided in this or any Anglia Advisors communication of any kind. Under no circumstances is any of Anglia Advisors’ content ever intended to constitute tax, legal or medical advice and should never be taken as such. Neither the information contained or any opinion expressed herein constitutes a solicitation for the purchase of any security or asset class.
Posts may contain links or references to third party websites or may post data or graphics from them for the convenience and interest of readers. While Anglia Advisors might have reason to believe in the quality of the content provided on these sites, the firm has no control over, and is not in any way responsible for, the accuracy of such content nor for the security or privacy protocols that external sites may or may not employ. By making use of such links, the user assumes, in its entirety, any kind of risk associated with accessing them or making use of any information provided therein.
Those associated with Anglia Advisors, including clients with managed or advised investments, may maintain positions in securities and/or asset classes mentioned in this post.

If you enjoyed this post, why not share it with someone or encourage them to subscribe themselves?


