


Interest rate cuts are beginning to look like a mirage; the closer we seem to get to them the more they seem to recede into the distance. By the end of last week, the most likely Fed interest rate at the end of the year according to futures markets was 5.125% (see FEDWATCH INTEREST RATE TOOL below). With Fed Funds currently sitting at 5.375%, this now implies just one solitary Fed rate cut of 0.25% between here and New Year’s Eve.
As a result, stocks fell for the third straight week and tech-heavy NASDAQ stocks in particular were brutalized, suffering their biggest weekly decline in 17 months. The so-called “Magnificent Seven” stocks lost a total of over $950 billion in market value last week.
The great stock market rally of 2023-2024 is showing signs of possibly unraveling under pressure from growing uncertainty surrounding interest rates, economic growth and corporate earnings as well as geopolitical concerns and even the first faint signs of nervousness about the domestic election campaign.
Iran’s largely impotent retaliatory strike on Israel over the preceding weekend didn’t really move the needle much as far as markets were concerned on Monday. Oil prices actually shifted a little lower and stocks began the day meandering around aimlessly before suffering an afternoon collapse led by Big Tech after a hot Retail Sales report sent market interest rates ripping even higher, with the 2-Year Treasury yield breaking up through 5% and the 10-Year reaching its highest level since mid-November.
Mixed economic data overnight from China added to the jitters on Tuesday morning. Also, Fed chairman Jerome Powell seems to have pivoted to a much more cautious stance since his last public pronouncements in March. He essentially said at a moderated Q&A session in Washington that, due to steadfast inflation during Q1, a Fed policy of higher-for-longer interest rates has now become not only a possibility, but in fact the most likely path forward.
Despite this potential double-whammy, alongside Iran vowing to retaliate against any future Israeli retaliation to last weekend’s Iranian retaliation to Israel’s recent deadly attack on an Iranian consulate inside Syria, stocks took a perhaps surprisingly sober view of things and hardly moved, although less surprising was that there was was no respite from ever-increasing market interest rates/falling bond prices.
Stocks made a half-hearted effort to rebound early on Wednesday but soon gave up and looked pretty exhausted as prices sank again in another down-day for most names, led by weakness in Big Tech in general and Nvidia in particular, as some of the day’s earnings reports disappointed and traders seemed to be replaying Powell’s comments over and over in their minds and becoming more and more uneasy each time.
Earning reports released on Thursday looked a lot rosier but once again, stocks failed to hold on to early gains in the face of continuously rising market interest rates, finishing essentially flat-to-a-bit-lower for the day.
Investors woke on Friday to the news that Israel had attacked Iran. Upon closer inspection, however, it appeared that that strike had been just about as ineffectual as Iran’s attempt on Israel at the weekend. After a brief spike, oil prices moved lower, indicating a lack of excessive concern on the part of markets which seemed to feel, perhaps ironically, that the chances of an escalation were lower after the attack than they were before it.
Rather than a panicked response to more bombs dropping in the Middle East, Friday resembled just a standard recent financial market trading day, which meant that traders turned their focus back onto concerns about higher for longer interest rates and some mixed earnings reports, which resulted in another plunge in stock prices, with the tech-heavy NASDAQ-100 in particular getting pummeled (AI market darlings Nvidia and Super Micro Computer were the two worst performers, falling 10% and 23% respectively in a matter of hours), capping the index’s worst week since November 2022.
This also represented a sixth straight day of losses for the S&P 500 index, the longest such streak of the year, shedding about 4% of its value during that time and sinking back down below the psychologically-important 5000 level that it first surpassed to a very loud fanfare back in early February.
When markets decline like this, investors get nervous, even if it’s after such a fantastic run as we’ve experienced over essentially the past 15 months. But based on facts, the only thing that’s really changed in this market recently is that actual events and data haven’t lived up to what were unrealistically positive expectations, which is something I will say I have been warning about for a while.
The stock market was priced for perfection at 5200 in the S&P 500 but it has been forcefully reminded that the environment is not perfect and stocks declined accordingly. Positively, this pullback to below 5000 may have started the process of re-setting expectations to something a bit more realistic.
At these levels, the S&P 500 is starting to more appropriately reflect the fact that:
1) the outlook isn’t as good as markets previously thought, but
2) is still broadly positive, because the following statements remain generally true as we speak: Growth is solid, inflation is still declining (slowly and jerkily, but it’s still happening), the next move on interest rates is still most likely to be a cut and AI enthusiasm broadly continues.
Until those four statements aren’t true, dips like this are likely to be relatively shallow and short-lived and investors will most likely be ultimately rewarded for holding their nerve.
OTHER NEWS ..
In The Dark .. Netflix was once the “N” in the group of dominant so-called “FAANG stocks”, which were ultimately replaced by the “Magnificent Seven”, an elite club that Netflix was not invited to join. Things have looked up lately for the streaming service, though and last week the company announced that it had added 9.33 million new subscribers in Q1 2024, crushing the consensus prediction of 5.1 million.
However, Netflix accompanied this spectacularly good news with the shock announcement that, going forward, it plans to stop providing quarterly membership data and average revenue generated per member. That stunned analysts on the earnings call, since these have always been the metrics that investors used to judge the company’s investment-worthiness.
Wall Street does not like the sense that it is being kept in the dark and the initial reaction to the blowout earnings report was to punish the stock which fell almost 7%.
Sinking .. Existing home sales in March posted their biggest monthly drop in more than a year, the National Association of Realtors said Thursday. The 4.3% decrease from February in a >7.0% mortgage rate environment was the largest percentage decline on a monthly basis since November 2022.
Didn’t get into Harvard, Princeton or Yale? .. Your next best option isn’t necessarily the most “prestigious” college that accepted you. Right now, high school seniors are deciding where to enroll in college next year, a question that’s taken on added urgency recently. The cost of tuition is soaring – currently a four-year degree could easily cost a family more than a quarter of a million dollars – and good jobs are becoming harder to come by for college grads.
Bloomberg News analyzed hundreds of US colleges to determine the 10-year Return On Investment (ROI) of attending each school and found that in many cases public universities offer better returns than many elite private colleges. Here’s what they came up with for every university.
UNDER THE HOOD ..
Shorter term indicators continued breaking down last week. Recent observations of lackluster Demand and increasing Supply have given way to a corrective phase. Supply has gained momentum.
All three of the major technical gaps have now been filled as the index fell below the key 4,982 level on Friday. The Fear & Greed Index (see below) has collapsed from the mid 70s to the low 30s in a very short time, indicating that Fear has rapidly overtaken Greed as the primary emotion driving investor decision making.
Market breadth has also plunged with the percentage of S&P 500 stocks above their 50-day moving average tumbling from the 80s to the 40s.
Stocks have been trading well above fundamental fair value for months now, but the recent pullback has seen the S&P 500 favorably dip back towards more reasonable and rational valuation levels.
This week, we want to observe if the market reacts positively to what are now short-term oversold conditions. While a bounce does seem possible, we will still need proof of the resurgence of Demand before regaining full faith in the fact that the primary uptrend can continue.
Anglia Advisors clients are welcome to reach out to me to discuss market conditions further.
THIS WEEK’S UPCOMING CALENDAR ..
It will be a packed week of potentially game-changing Q1 earnings reports, with around 150 S&P 500 companies scheduled to report including some of the market’s Big Daddies and most intriguing names such as Microsoft, Alphabet, Meta, Boeing, Tesla, Visa, UPS, Exxon Mobil, Chevron, T-Mobile, Pepsi, Verizon, General Motors, GE, Intel, AT&T, Comcast, Chipotle, Lockheed Martin, Halliburton, Spotify, Nucor, SAP, Freeport-McMoRan, Newmont and Southwest Airlines.
Economic data will include the first advance estimate of Q1 2024 Gross Domestic Product (GDP). The consensus prediction is of an annualized rate of 2.2%.
Also out this week is the Personal Consumption Expenditures (PCE) report for March, which includes the Fed’s preferred inflation measure, the Core PCE price index which is expected to be up 2.7% from a year earlier, versus a 2.8% rise through February.
ARTICLE OF THE WEEK ..
WTF is going on with auto and property insurance costs?
LAST WEEK BY THE NUMBERS ..
Last week’s market color courtesy of finviz.com

Last week’s best performing U.S. sector: Utilities (two biggest holdings: NextEra Energy, Southern Co.) - up 1.9% for the week.
Last week’s worst performing U.S. sector: Technology (two biggest holdings: Microsoft, Apple) - down 6.5% for the week.
SPY, the S&P 500 Large Cap ETF, is made up of the stocks of the 500 largest U.S. companies. Its price fell 3.2% last week, is up 4.2% so far this year and ended the week 5.4% below its all-time record closing high (03/28/2024)
IWM, the Russell 2000 Small Cap ETF, is made up of the bottom two-thirds in terms of company size of the group of the 3,000 largest U.S. stocks. Its price fell 2.8% last week, is down 3.8% so far this year and ended the week 20.4% below its all-time record closing high (11/08/2021)
DXY, the U.S. Dollar index, is an index that measures the value of the U.S. Dollar against a weighted basket of six other major currencies (the Euro, the Japanese Yen, the British Pound, the Canadian Dollar, the Swedish Krone and the Swiss Franc). It fell 0.1% last week, is up 4.7% so far this year and is up 16.5% over the last three years.
AVERAGE 30-YEAR FIXED MORTGAGE RATE ..
7.10%
One week ago: 6.88%, one month ago: 6.87%, one year ago: 6.39%
Data courtesy of: FRED Economic Data, St. Louis Fed as of last Thursday.
FEAR & GREED INDEX ..
“Be fearful when others are greedy and be greedy when others are fearful.” Warren Buffet.

The Fear & Greed Index from CNN Business can be used as an attempt to gauge whether or not stocks are fairly priced and to determine the mood of the market. It is a compilation of seven of the most important indicators that measure different aspects of stock market behavior. They are: market momentum, stock price strength, stock price breadth, put and call option ratio, junk bond demand, market volatility and safe haven demand.
Extreme Fear readings can lead to potential opportunities as investors may have driven prices “too low” from a possibly excessive risk-off negative sentiment.
Extreme Greed readings can be associated with possibly too-frothy prices and a sense of “FOMO” with investors chasing rallies in an excessively risk-on environment . This overcrowded positioning leaves the market potentially vulnerable to a sharp downward reversal at some point.
A “sweet spot” is considered to be in the lower-to-mid “Greed” zone.
Data courtesy of CNN Business as of Friday’s market close.
The 50-day moving average of the S&P 500 remains above the 200-day. This is a continued indication of an ongoing technical uptrend.
% OF S&P 500 STOCKS TRADING ABOVE THEIR 50-DAY MOVING AVERAGE ..
34% (173 of the S&P 500 stocks ended last week above their 200D MA and 227 were below)
One week ago: 40%, one month ago: 77%, one year ago: 59%
% OF S&P 500 STOCKS TRADING ABOVE THEIR 200-DAY MOVING AVERAGE ..
68% (339 of the S&P 500 stocks ended last week above their 200D MA and 161 were below)
One week ago: 69%, one month ago: 77%, one year ago: 58%
Closely-watched measures of market breadth and participation, providing a real-time look at how many of the largest 500 publicly-traded stocks in the U.S. are trending higher or lower, as defined by whether the stock price is above or below their more sensitive 50-day (short term) and less sensitive 200-day (long term) moving averages which are among the most widely-followed of all stock market technical indicators.
The higher the reading, the better the deemed health of the overall market trend, with 50% considered to be a key pivot point. Readings above 90% or below 15% are extremely rare.
WEEKLY US INVESTOR SENTIMENT (outlook for the upcoming 6 months) ..
↑Bullish: 38% (44% a week ago)
⬌ Neutral: 28% (33% a week ago)
↓Bearish: 34% (23% a week ago)
Net Bull-Bear spread: ↑Bullish by 4 (Bullish by 21 a week ago)
For context: Long term averages: Bullish: 38% — Neutral: 32% — Bearish: 30% — Net Bull-Bear spread: Bullish by 8
Survey participants are typically polled during the first half of the week.
Data courtesy of: American Association of Individual Investors (AAII).
FEDWATCH INTEREST RATE TOOL ..
Will interest rates be lower than they are now following the Fed’s next meeting on May 1st?
Yes .. 4% probability (1% a week ago)
No .. 96% probability (99% a week ago)
Will interest rates be lower than they are now following the Fed’s following meeting on June 12th?
Yes .. 17% probability (28% a week ago)
No .. 83% probability (72% a week ago)
Where is the Fed Funds interest rate most likely to be at the end of 2024?
5.125% (0.25% lower than where we are now, implying one rate cut in 2024)
One week ago: 4.875% (implying two rate cuts), one month ago: 4.625% (implying three rate cuts)
All data based on the Fed Funds rate (currently 5.375%). Calculated from Federal Funds futures prices as of the market close on Friday. Data courtesy of CME FedWatch Tool.
HIGH YIELD CREDIT SPREAD ..
3.39%
One week ago: 3.16%, one month ago: 3.10%, one year ago: 4.41%
This closely-watched spread is a strong indicator of the risk inherent in the professional marketplace and the extent to which such risk is growing or easing. The high-yield credit spread is the difference between the interest rates offered for riskier low-grade, high yield (“junk”) bonds and those for stable high-grade, lower yield bonds, including deemed risk-free government bonds, of similar maturity.
A reading that is high/increasing indicates that “junkier” bond issuers are being forced to move their yields higher to compensate for a greater risk of default and is considered to be a reflection of broadly deteriorating economic and market conditions which could well lead to lower stock prices.
A reading that is low/decreasing indicates a reduced necessity for higher yields. This reflects less prevailing market risk and more stable or improving conditions in the overall economy and for stock prices.
For context .. this reading was regularly below 3.00% for much of the 1990s, got as high as 10.59% after 9/11 and the subsequent Dotcom Crash of 2002, peaked at 21.82% in the Great Financial Crisis in December 2008 and spiked from 3.62% to 10.87% in the space of about a month during the February/March 2020 COVID crash. The historical average since 1996 is a little over 4.00%.
Data courtesy of: FRED Economic Data, St. Louis Fed as of Friday’s market close.
US TREASURY INTEREST RATE YIELD CURVE ..
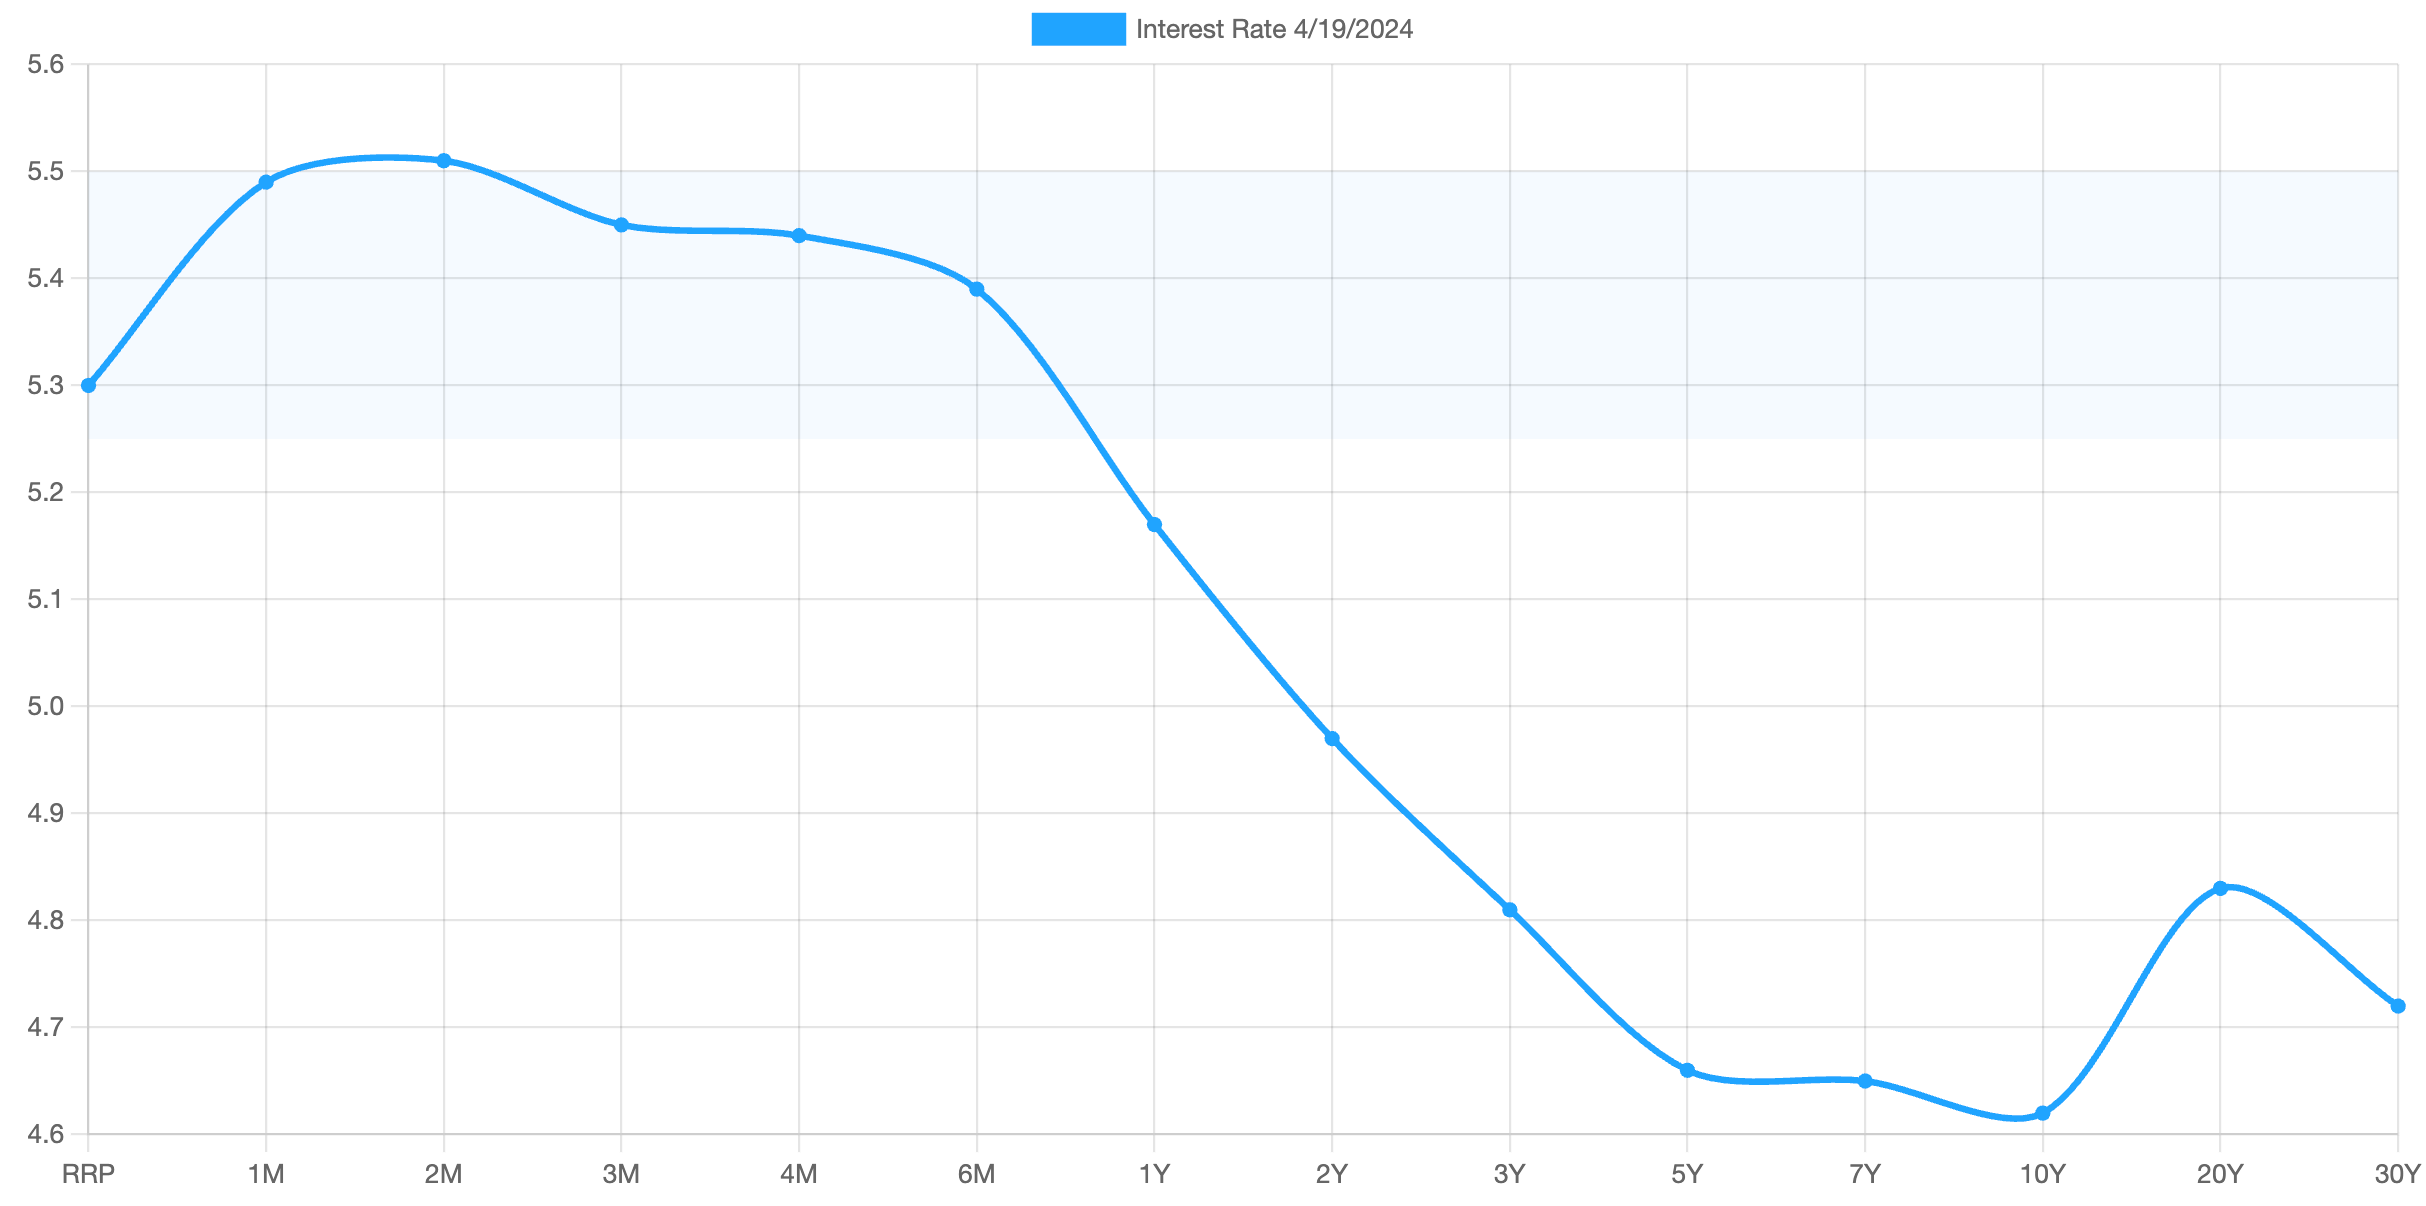
The highest rate on the yield curve (5.51%) is being paid for the 2-month duration and the lowest rate (4.62%) is for the 10-year.
The most closely-watched and commonly-used comparative measure of the spread between the higher 2-year and the lower 10-year fell from 0.38 to 0.35%, indicating a flattening in the inversion of the curve last week.
The interest rate yield curve remains unusually “inverted” (i.e. shorter term interest rates are generally higher than longer term ones). Based on the 2-year vs. 10-year spread, the curve has been inverted since July 2022.
Historically, an inverted yield curve is not the norm and has been regarded by many as a leading indicator of an impending recession, with shorter term risk regarded to be unusually higher than longer term. The steeper the inversion, the greater the deemed risk of recession.
Data courtesy of ustreasuryyieldcurve.com as of Friday. The lightly shaded area on the chart shows the current Federal Funds rate range.
WWW.ANGLIAADVISORS.COM | SIMON@ANGLIAADVISORS.COM | CALL OR TEXT: (646) 286 0290 | FOLLOW ANGLIA ADVISORS ON INSTAGRAM
This material represents a highly opinionated assessment of the financial market environment based on assumptions and prevailing data at a specific point in time and is always subject to change at any time. Although the content is believed to be correct at the time of publication, no warranty of its accuracy or completeness is given. It is never to be interpreted as an attempt to forecast any future events, nor does it offer any kind of guarantee of any future results, circumstances or outcomes.
The material contained herein is not necessarily complete and is wholly insufficient to be exclusively relied upon as research or investment advice or as a sole basis for any investment or other financial decisions. The user assumes the entire risk of any decisions made or actions taken based in whole or in part on any of the information provided in this or any Anglia Advisors communication of any kind. Under no circumstances is any of Anglia Advisors’ content ever intended to constitute tax, legal or medical advice and should never be taken as such. Neither the information contained or any opinion expressed herein constitutes a solicitation for the purchase of any security or asset class.
Posts may contain links or references to third party websites or may post data or graphics from them for the convenience and interest of readers. While Anglia Advisors might have reason to believe in the quality of the content provided on these sites, the firm has no control over, and is not in any way responsible for, the accuracy of such content nor for the security or privacy protocols that external sites may or may not employ. By making use of such links, the user assumes, in its entirety, any kind of risk associated with accessing them or making use of any information provided therein.
Those associated with Anglia Advisors, including clients with managed or advised investments, may maintain positions in securities and/or asset classes mentioned in this post.

If you enjoyed this post, why not share it with someone or encourage them to subscribe themselves?


