


It was a jittery week for stocks during which data was released that confirmed that the American consumer may be putting the brakes on spending and that the rate of inflation is decelerating at a slower pace. Markets chose to focus on the fact that stickier inflation likely means higher for longer when it comes to interest rates and that drove stock prices lower for the second week in a row.
After a quiet weekend on the newswires and with CPI and PPI inflation due out later in the week with the potential to impact interest rate cut expectations and perhaps remembering how last month’s surprise CPI print tripped everyone up, stock markets took a wait-and-see attitude on Monday, the fourth anniversary of the official declaration of the COVID pandemic, and prices were barely changed.
On Tuesday the Consumer Price Index (CPI) measure of retail inflation emphasized this continued stickiness. Both the core and headline readings rose 0.4% in February, which was slightly up from the previous month and higher than estimates, for a marginally lower year-on-year rate of 3.8% for the important core number. Prices particularly jumped for used cars, air travel and clothes. This buried the hope that the surprisingly high January figure had been some kind of seasonal one-off blip in an otherwise steady downward march in the rate of inflation.
The near-certainty required by the Fed that 2% inflation is around the corner before embarking on meaningful rate-cutting clearly remains elusive, but Wall Street seems to have finally made its peace with this fact and, led by the tech sector, stocks moved higher on the day with the S&P 500 closing back in record high territory for the 17th time this year on the back of a “it could have been worse” mentality for CPI.
The wait-and-see approach resumed on Wednesday with CPI’s wholesale cousin, PPI, due out the following day to give the Fed a second look at the state of inflation and its last before this week’s interest rate-setting meeting. Stocks spent the day hugging the unchanged line on lighter than usual trading volume.
On Thursday morning, the Producer Price Index (PPI) measure of wholesale inflation experienced by manufacturers came in hot as well, up 0.6% in February for an annualized 1.6% rate, the highest in six months and double what had been forecast. We also learned that Retail Sales somewhat rebounded in February, up 0.6% for the month, but this increase was below estimates. It also only helped in part to reverse a significant downwardly-revised 1.1% fall in January.
The twin disappointments of inflation data and slowing consumer demand proved disheartening to Wall Street as it gives the Fed continued cover for its delay in cutting interest rates and ignited the conversation around a first cut now being in July instead of June (the market-driven probability of an interest rate cut in June swiftly collapsed from 90% to 59% last week). The most popular market-projected number of interest rate cuts in 2024 fell last week to three, finally bringing it into line with what the Fed has been saying for months (see FEDWATCH INTEREST RATE TOOL below).
Remember, only a matter of weeks ago there was an almost-universal assumption that the rate cutting process would begin in March and that there would be at the very least six rate cuts in 2024. Those expectations are distant memories now and stock prices slumped on Thursday and then continued falling on Friday, which was also a so-called “triple-witching” day when the expiry of a huge pile of derivatives and futures contracts amplify price swings. All this dragged the indexes into lightly negative territory for the week.
Is there some calmness ahead for markets? Above 5100 in the S&P 500 index, all the positives (Goldilocks economic data, summer interest rate cuts, still-falling inflation) are now mostly already priced in, unlike when the index was at, say, 4000. So, while the simple reinforcement of those concepts may help support the market and justify these levels, it’s unlikely to - of itself - drive things materially higher from here, particularly as economic momentum slows.
Yet as discussed before, meaningful downward movement is going to require something actually bad to happen to scare off the dip-buyers. An example would be if the evidence becomes strong that inflation isn’t slowing anymore, that economic growth is struggling or that the Fed definitely won’t cut in the summer. None is this is being indicated right now, Last week’s mildly disappointing CPI and PPI reports certainly did not qualify as such a development.
So without a big catalyst of some kind, things could well just stay relatively rangebound for a while, simply churning while we wait for the next big trigger to tip the scale one way or another.
OTHER NEWS .. (SOCIAL MEDIA EDITION)
And So It Begins .. The U.S. presidential election is just eight months away, a highly unpopular - but now confirmed - rematch between Trump and Biden. From now on, when either candidate mentions publicly-traded companies, investors need to pay attention.
On Monday morning, Trump said in an interview, "I consider Facebook to be an enemy of the people." Meta/Facebook stock promptly fell more than 4%, having run up about 40% this year and hit an all-time high just days earlier. The stock's decline served as perhaps the first reminder this cycle to investors that election risk really is a thing.
Historically, elections have been generally good news for U.S. stocks. The S&P 500 is rarely more buoyant than when a sitting president is up for reelection - in the ten prior instances of this since 1952, the index has never finished down that year, with the average return standing at 12.2%, a premium of over 2% on a typical year.
However, the sheer unpredictability of what will come out of the mouths of these two old men, as well as the ease with which they can both shamelessly U-turn on previously-held positions whenever it suits them (Trump and TikTok being the latest example), makes this election year particularly intriguing on Wall Street.
Clock Ticking For TikTok? .. The U.S. House of Representatives passed a bill on Wednesday that would require China's ByteDance to divest TikTok or face a ban of the social media app in the U.S., impacting 170 million users who spend an average of 97 minutes per day on the app (much more than is spent on any other social media platform - users spend less than an hour a day on average on Instagram, Snapchat or Facebook, for example).
The absurdly-named Protecting Americans from Foreign Adversary Controlled Applications Act prohibits “distributing, maintaining, or providing internet hosting services for a foreign adversary controlled application (e.g., TikTok)." The bill was introduced by House Republicans who said the app could pose a national security threat due to its ties to ByteDance, TikTok's Chinese parent company, citing concerns China's government could potentially require it to share data. After passing with bipartisan support, the bill moved to the Senate, where its progress could potentially be slowed down somewhat by increased scrutiny and more probing questions about the possible unintended consequences of the legislation.
The regulation could also apply to other social media companies that are "controlled by a foreign adversary and [have] been determined by the President to present a significant threat to national security," but is currently targeting only ByteDance and TikTok by name.
UNDER THE HOOD ..
Market breadth, uptrend participation, and Demand intensity continue to broaden, despite the indexes hitting some speed-bumps over the last couple of weeks. Buying power has been in an uptrend since mid-January and continues to dominate Selling pressure, which is locked in a sideways range.
Since the start of 2024, the S&P 500 index has essentially been been closely tracking an up-trending straight line with remarkably little divergence and there is currently no real reason for investors focused on the intermediate and longer term to deviate from their course of action of systematically buying stocks.
The shorter term outlook is less clear, however, with some signs of fading Demand momentum although Supply has still yet to awaken.
Anglia Advisors clients are welcome to reach out to me to discuss market conditions further.
THIS WEEK’S UPCOMING CALENDAR ..
This week’s Fed rate setting meeting which concludes on Wednesday will be a triple-header consisting of the policy announcement (universally expected to be no change in interest rates), chairman Jerome Powell’s press conference and a new quarterly economic projection, aka the “Dot Plot” with the committee members expectations for interest rate changes stretching into the future which will be scrutinized by economists, analysts, pundits and nerds like me within an inch of its life. The data on the economy and inflation have generally been stronger than expected since the last Dot Plot release back in December.
On Tuesday, the Bank of Japan issues its own policy decision and is expected to make its first interest rate increase since 2007.
Highlights on the earnings calendar this week include results from Fedex, Nike, General Mills, Darden Restaurants and Micron Technologies.
ARTICLE OF THE WEEK ..
It’s tough to figure out exactly how to interpret the recent run-up in the price of Bitcoin. This is the best attempt I have seen.
LAST WEEK BY THE NUMBERS ..
Last week’s market color courtesy of finviz.com

Last week’s best performing U.S. sector: Energy (two biggest holdings: Exxon-Mobil, Chevron) - up 4.0% for the week.
Last week’s worst performing U.S. sector: Real Estate (two biggest holdings: Prologis, American Tower) - down 2.6% for the week.
SPY, the S&P 500 Large Cap ETF, is made up of the stocks of the 500 largest U.S. companies. Its price fell 0.4% last week, is up 7.3% so far this year and ended the week 1.3% below its all-time closing record high (03/12/2024)
IWM, the Russell 2000 Small Cap ETF, is made up of the bottom two-thirds in terms of company size of the group of the 3,000 largest U.S. stocks. Its price fell 2.2% last week, is up 0.9% so far this year and ended the week 16.6% below its all-time closing record high (11/08/2021)
DXY, the U.S. Dollar index, is an index that measures the value of the U.S. Dollar against a weighted basket of six other major currencies (the Euro, the Japanese Yen, the British Pound, the Canadian Dollar, the Swedish Krone and the Swiss Franc). It rose 0.6% last week, is up 2.0% so far this year and is up 12.7% over the last three years.
AVERAGE 30-YEAR FIXED MORTGAGE RATE ..
6.74%
One week ago: 6.88%, one month ago: 6.77%, one year ago: 6.60%
Data courtesy of: FRED Economic Data, St. Louis Fed as of last Thursday.
FEAR & GREED INDEX ..
“Be fearful when others are greedy and be greedy when others are fearful.” Warren Buffet.
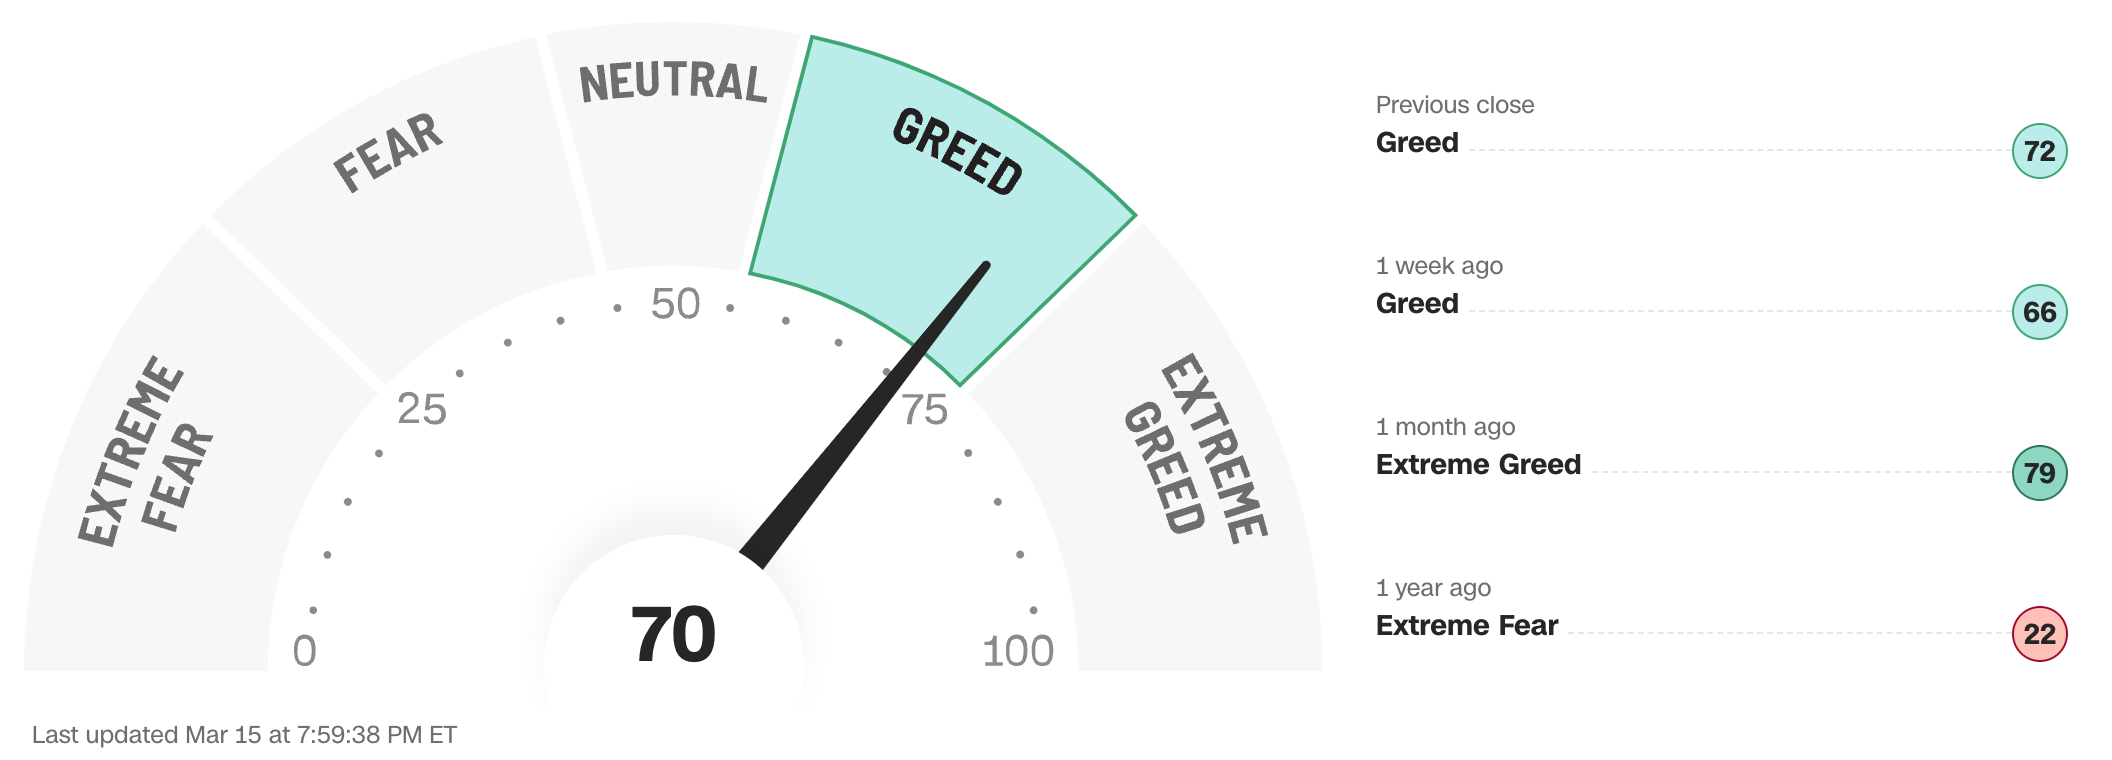
The Fear & Greed Index from CNN Business can be used as an attempt to gauge whether or not stocks are fairly priced and to determine the mood of the market. It is a compilation of seven of the most important indicators that measure different aspects of stock market behavior. They are: market momentum, stock price strength, stock price breadth, put and call option ratio, junk bond demand, market volatility and safe haven demand.
Extreme Fear readings can lead to potential opportunities as investors may have driven prices “too low” from a possibly excessive risk-off negative sentiment.
Extreme Greed readings can be associated with possibly too-frothy prices and a sense of “FOMO” with investors chasing rallies in an excessively risk-on environment . This overcrowded positioning leaves the market potentially vulnerable to a sharp downward reversal at some point.
The “sweet spot” is considered to be in the lower-to-mid “Greed” zone.
Data courtesy of CNN Business as of Friday’s market close.
The 50-day moving average of the S&P 500 remains above the 200-day. This is a continued indication of an ongoing technical uptrend.
% OF S&P 500 STOCKS TRADING ABOVE THEIR 50-DAY MOVING AVERAGE ..
70% (348 of the 500 largest stocks in the U.S. ended last week above their 50D MA and 152 were below)
One week ago: 76%, one month ago: 55%, one year ago: 18%
% OF S&P 500 STOCKS TRADING ABOVE THEIR 200-DAY MOVING AVERAGE ..
75% (377 of the 500 largest stocks in the U.S. ended last week above their 200D MA and 123 were below)
One week ago: 76%, one month ago: 71%, one year ago: 37%
Closely-watched measures of market breadth and participation, providing a real-time look at how many of the largest 500 publicly-traded stocks in the U.S. are trending higher or lower, as defined by whether the stock price is above or below their more sensitive 50-day (short term) and less sensitive 200-day (long term) moving averages which are among the most widely-followed of all stock market technical indicators.
The higher the reading, the better the deemed health of the overall market trend, with 50% considered to be a key pivot point. Readings above 90% or below 15% are extremely rare.
WEEKLY US INVESTOR SENTIMENT (outlook for the upcoming 6 months) ..
↑Bullish: 46% (52% a week ago)
⬌ Neutral: 32% (26% a week ago)
↓Bearish: 22% (22% a week ago)
Net Bull-Bear spread: ↑Bullish by 24 (Bullish by 30 a week ago)
For context: Long term averages: Bullish: 38% — Neutral: 32% — Bearish: 30% — Net Bull-Bear spread: Bullish by 8
Survey participants are typically polled during the first half of the week.
Data courtesy of: American Association of Individual Investors (AAII).
FEDWATCH INTEREST RATE TOOL ..
Will interest rates be lower than they are now following the Fed’s next meeting on March 20th?
Yes .. 2% probability (4% a week ago)
No .. 98% probability (96% a week ago)
Will interest rates be lower than they are now following the Fed’s following meeting on May 1st?
Yes .. 6% probability (24% a week ago)
No .. 94% probability (76% a week ago)
Where is the Fed Funds interest rate most likely to be at the end of 2024?
4.625% (0.75% lower than where we are now, implying three rate cuts of 0.25% each in 2024)
One week ago: 4.375% (implying four rate cuts), one month ago: 4.125% (implying five rate cuts)
All data based on the Fed Funds rate (currently 5.375%). Calculated from Federal Funds futures prices as of the market close on Friday. Data courtesy of CME FedWatch Tool.
HIGH YIELD CREDIT SPREAD ..
3.15%
One week ago: 3.26%, one month ago: 3.34%, one year ago: 4.09%
This closely-watched spread is a strong indicator of the risk inherent in the professional marketplace and the extent to which such risk is growing or easing. The high-yield credit spread is the difference between the interest rates offered for riskier low-grade, high yield (“junk”) bonds and those for stable high-grade, lower yield bonds, including deemed risk-free government bonds, of similar maturity.
A reading that is high/increasing indicates that “junkier” bond issuers are being forced to move their yields higher to compensate for a greater risk of default and is considered to be a reflection of broadly deteriorating economic and market conditions which could well lead to lower stock prices.
A reading that is low/decreasing indicates a reduced necessity for higher yields. This reflects less prevailing market risk and more stable or improving conditions in the overall economy and for stock prices.
For context .. this reading was regularly below 3.00% for much of the 1990s, got as high as 10.59% after 9/11 and the subsequent Dotcom Crash of 2002, peaked at 21.82% in the Great Financial Crisis in December 2008 and spiked from 3.62% to 10.87% in just a month during the March 2020 COVID crash. The historical average since 1996 is a little over 4.00%.
Data courtesy of: FRED Economic Data, St. Louis Fed as of Friday’s market close.
US TREASURY INTEREST RATE YIELD CURVE ..

The highest rate on the yield curve (5.52%) is being paid for the 1-month duration and the lowest rate (4.31%) is for the 10-year.
The most closely-watched and commonly-used comparative measure of the spread between the higher 2-year and the lower 10-year rose from 0.39% to 0.41%, indicating a steepening in the inversion of the curve.
The interest rate yield curve remains unusually “inverted” (i.e. shorter term interest rates are generally higher than longer term ones). Based on the 2-year vs. 10-year spread, the curve has been inverted since July 2022.
Historically, an inverted yield curve is not the norm and has been regarded by many as a leading indicator of an impending recession, with shorter term risk regarded to be unusually higher than longer term. The steeper the inversion, the greater the deemed risk of recession.
Data courtesy of ustreasuryyieldcurve.com as of Friday. The lightly shaded area on the chart shows the current Federal Funds rate range.
WWW.ANGLIAADVISORS.COM | SIMON@ANGLIAADVISORS.COM | CALL OR TEXT: (929) 677 6774 | FOLLOW ANGLIA ADVISORS ON INSTAGRAM
This material represents a highly opinionated assessment of the financial market environment based on assumptions and prevailing data at a specific point in time and is always subject to change at any time. Although the content is believed to be correct at the time of publication, no warranty of its accuracy or completeness is given. It is never to be interpreted as an attempt to forecast any future events, nor does it offer any kind of guarantee of any future results, circumstances or outcomes.
The material contained herein is not necessarily complete and is wholly insufficient to be exclusively relied upon as research or investment advice or as a sole basis for any investment or other financial decisions. The user assumes the entire risk of any decisions made or actions taken based in whole or in part on any of the information provided in this or any Anglia Advisors communication of any kind. Under no circumstances is any of Anglia Advisors’ content ever intended to constitute tax, legal or medical advice and should never be taken as such. Neither the information contained or any opinion expressed herein constitutes a solicitation for the purchase of any security or asset class.
Posts may contain links or references to third party websites or may post data or graphics from them for the convenience and interest of readers. While Anglia Advisors might have reason to believe in the quality of the content provided on these sites, the firm has no control over, and is not in any way responsible for, the accuracy of such content nor for the security or privacy protocols that external sites may or may not employ. By making use of such links, the user assumes, in its entirety, any kind of risk associated with accessing them or making use of any information provided therein.
Those associated with Anglia Advisors, including clients with managed or advised investments, may maintain positions in securities and/or asset classes mentioned in this post.

If you enjoyed this post, why not share it with someone or encourage them to subscribe themselves?


