


The happy clappy days of late 2023 already seemed like a bit of a distant memory at times last week. This was the worst four-day start to a calendar year across all stock and bond asset classes since Shakira indicated that she was available whenever, wherever in 2002.
The chance to enjoy a second long weekend in a row seemed to have sobered Wall Street traders up a bit. Upon re-entering the arena on Tuesday, they appeared to have reined in some of their more outlandishly optimistic interest rate cut expectations and the market kicked off 2024 by battering 2023’s winners.
In fact, the NASDAQ had its third worst opening day this century as limits on semiconductor exports to China and questions about iPhone demand particularly weighed on tech stocks during the session.
Things didn’t get much better on Wednesday when we learned that the number of available jobs in the U.S. decreased pretty much in line with expectations to 8.79 million, the lowest level since early 2021, according to the Job Openings and Labor Turnover Survey (JOLTS).
The superstar stocks of 2023 were further punished by profit-takers as the publication of the minutes from the last Federal Reserve rate-setting meeting failed to show any hint of interest rate cuts being planned for the first part of 2024. Indeed the minutes showed that officials “reaffirmed that it would be appropriate for policy to remain at a restrictive stance for some time until inflation was clearly moving down sustainably”.
That’s Fed-speak for “Easy, tiger!” aimed at those who are anticipating an absolute orgy of interest rate cuts this year. The futures market probability of interest rates being lower than they are now after the Fed’s March meeting quickly plummeted from 87% the previous Friday to 65% by Wednesday’s close (see FEDWATCH INTEREST RATE TOOL below).
Things stabilized a bit on Thursday morning as attention began to turn toward the consequential Jobs Report the following day. But prices drifted lower again in the afternoon for a third straight day of declines to start 2024 with NASDAQ stocks and Small Caps once again being hit hardest.
When the Jobs Report dropped on Friday morning, it further undermined the case for imminent interest rate cuts. It indicated that the road to 2% inflation may be longer and bumpier than markets were anticipating. 216k jobs were added last month, way higher than analysts had predicted. Unemployment remained stuck at 3.7% as the labor force shrank. Year-on-year wage gains are now at 4.1% vs. the 3.9% analyst estimate and far above the 3.5% that the Fed believes is consistent with its 2% inflation target.
Instead of freaking out, however, stock markets rather uncharacteristically chose a more nuanced and balanced response to the report, recognizing that while the continued high employment levels and wage growth do pose risks in the form of an inflation rebound potential and the resulting possible deferral of those long-awaited interest rate cuts, the report also paints a rosy picture of an economy in good health and one in which corporate earnings may flourish and stocks finally enjoyed their first up-day of 2024, albeit a pretty modest one.
As I have repeatedly emphasized, the market’s assumptions coming into 2024 were aggressively optimistic and it is how events unfold versus these high expectations that will determine how stocks and bonds trade in Q1, which is why every major economic data point (jobs, GDP, inflation and retail sales) is important right now because 1) they’ll directly influence rate cut expectations but also 2) because of the implications for soft vs. hard landing.
If the economy is going to slow in a disturbing manner, we will likely see evidence of it during this first quarter via 1) the data and 2) Fed-speak (especially following the January meeting) from central bank officials. If rate cut expectations are significantly dialed back, that’s going to be a real problem for stocks.
Earnings season is looming with results starting next Friday. If reports in aggregate disappoint - particularly when it comes to the big dogs of the market - that will be another headwind.
And finally, brace for politics. It will become a larger and larger influence on markets as the year goes on. For Q1 2024, as well as risk of an imminent politically-motivated government shutdown (see OTHER NEWS below), the first Republican primary is almost upon us. Trump could have the nomination secured by Super Tuesday (March 5th), although his legal difficulties will likely not be resolved by then.
None of these issues will for sure derail any stock rally in 2024 even with such rich valuations, indeed there are a lot of reasons to think that stocks could very well end up having an exceptional year. But we all need to be aware that there is certainly potential for some meaningful bumps in the road along the way resulting from all this stuff and possibly other as-yet-unknown factors that could always emerge.
OTHER NEWS ..
Silly Stat .. I’m not one for drawing big conclusions from small samples, but here goes anyway .. According to Barron’s; since 1950, there have been 28 instances in which the S&P 500 has lost ground over the first four trading days of the year. On average over those 28 occasions, the index has still managed to finish the year in positive territory, up by 1.6%, but that figure badly trails the S&P 500's typical performance; in all years since 1950, the index has gained an average of 9.3%. The good news? Past performance, as they say, is no guarantee of future results.
Not Looking Good On The Shutdown Front .. President Biden’s top budget official said that she is now very concerned the US government will partially shut down later this month with the lights fully going out in February as Congress and the White House remain deadlocked over border security and spending levels. “I’m typically optimistic. Don’t mark me down as optimistic this morning,” Shalanda Young, director of the Office of Management and Budget, said on Friday.
Financial markets seem to be remarkably unconcerned about this issue at this point, although I suspect that may change soon if there’s no progress. Conventional wisdom says to not worry too much about these skirmishes as politicians will always find some sort of fudge or compromise at the last minute to kick the can further down the road, just as they did twice in 2023.
But this time it may just be different. The chances of a January 20th shutdown are high because, caving to pressure from the crackpots on the Burn-It-All-Down wing of his party, new Republican Speaker Mike Johnson has expressly vowed not to pass any more stop-gap pending bills this time. It remains to be seen if he is a man of his word.
Happy New Year Elon - not! .. The turning of the page on the calendar has done nothing to signal an upturn in the fortunes of beleaguered billionaire Elon Musk.
First, a Fidelity valuation put X/Twitter as being worth 72% less now than on the day Musk massively overpaid for it. And that’s before any real effect has been felt of the very public advice he gave that his advertisers should “go fuck themselves” following their boycott in response to their ads on the platform being placed next to the proliferation of Nazi-style posts and other violent hate speech found all over the platform and Musk’s open endorsement of anti-semitic sentiments.
Even one of the very biggest “white whales” of social media influencers and online personalities, MrBeast, has now dropped X/Twitter as a platform, essentially saying that it was an irrelevance and that his presence there was simply not worth his time and effort any more.
Last Tuesday, we learned that Tesla has officially lost its title as the world's top seller of electric cars. BYD, a Chinese automaker, delivered 526,409 cars in Q4 2023, comfortably surpassing Tesla's 484,507.
It was then announced on Friday that the company has had to recall all of the 1.6m vehicles that it has ever sold in China due to problems with the driver-assistance system that have increased the risk to passenger safety.
UNDER THE HOOD ..
Technical measures of Supply and Demand, breadth and participation, demand intensity and momentum have all moved to multi-month (and in some cases multi-year) highs of late. This is not just true in the U.S. by the way, stock markets are at new highs all around the world. It is extremely rare for the stocks to hit a top, turn around and begin to decline at a time when all these indicators are so robust.
Even at the end of a difficult week, an astonishing 437 of the S&P 500 stocks are still trading above their 50-day moving average and 375 above their 200-day (see below).
In an environment at the beginning of the year where there is typically a lot of market “noise”, there is little evidence so far of Demand becoming more selective, let alone any highly-motivated selling of anything beyond 2023’s big winners.
This is the flip side of what we saw in the first half of 2023 when the indexes moving higher was a little misleading as the trajectory was being driven by a small number of champion names. Now, the index declines of early 2024 are similarly misleading in that they, too, are being primarily driven by the downward price movements of pretty much that same small cohort of big name stocks.
We just need to wait for markets to shake off its early-year sillies and for a proper pattern to establish itself. Shouldn’t be long now.
Anglia Advisors clients are welcome to reach out to me to discuss market conditions further.
THIS WEEK’S UPCOMING CALENDAR ..
After a slow start, the news flow intensifies later this week with crucial inflation data followed by the unofficial kickoff of the Q4 2023 earnings season.
On Thursday, the Consumer Price Index (CPI) measure of retail inflation for December will be released and will be closely watched for the latest inflation trends, especially with a (diminishing) number of traders still betting that the Federal Reserve will begin cutting interest rates as early as at its March meeting.
On Friday, big U.S. banks take on their traditional role at the front of the earnings season pack. Bank of America, JPMorgan and Wells Fargo will be among the big names reporting their Q4 2023 results.
ARTICLE OF THE WEEK ..
How to completely optimize your vacation days in 2024.
LAST WEEK BY THE NUMBERS ..
Last week’s market color courtesy of finviz.com

Last week’s best performing U.S. sector: Healthcare (two biggest holdings: United Health Group, Eli Lilly) - up 2.3% for the week.
Last week’s worst performing U.S. sector: Technology (two biggest holdings: Apple, Microsoft) - down 4.6% for the week.
SPY, the S&P 500 Large Cap ETF, is made up of the stocks of the 500 largest U.S. companies. It fell 1.4% last week and is now 2.1% below its all-time closing high (01/03/2022)
IWM, the Russell 2000 Small Cap ETF, is made up of the bottom two-thirds in terms of company size of the group of the 3,000 largest U.S. stocks. It fell 3.6% last week and is now 20.3% below its all-time closing high (11/05/2021)
DXY, the U.S. Dollar index, is an index that measures the value of the U.S. Dollar against a weighted basket of six other major currencies (the Euro, the Japanese Yen, the British Pound, the Canadian Dollar, the Swedish Krone and the Swiss Franc). It rose 1.04% last week to 102.4
The proprietary Lowry's measure for U.S. stock market Buying Power fell by 11 points last week to 164 and that of U.S. stock market Selling Pressure rose by 9 points to 116 over the course of the week.
AVERAGE 30-YEAR FIXED MORTGAGE RATE ..
6.62 %
One week ago: 6.61%, one month ago: 7.03%, one year ago: 6.48%
Data courtesy of: FRED Economic Data, St. Louis Fed as of Thursday of last week.
FEAR & GREED INDEX ..
“Be fearful when others are greedy and be greedy when others are fearful.” Warren Buffet.
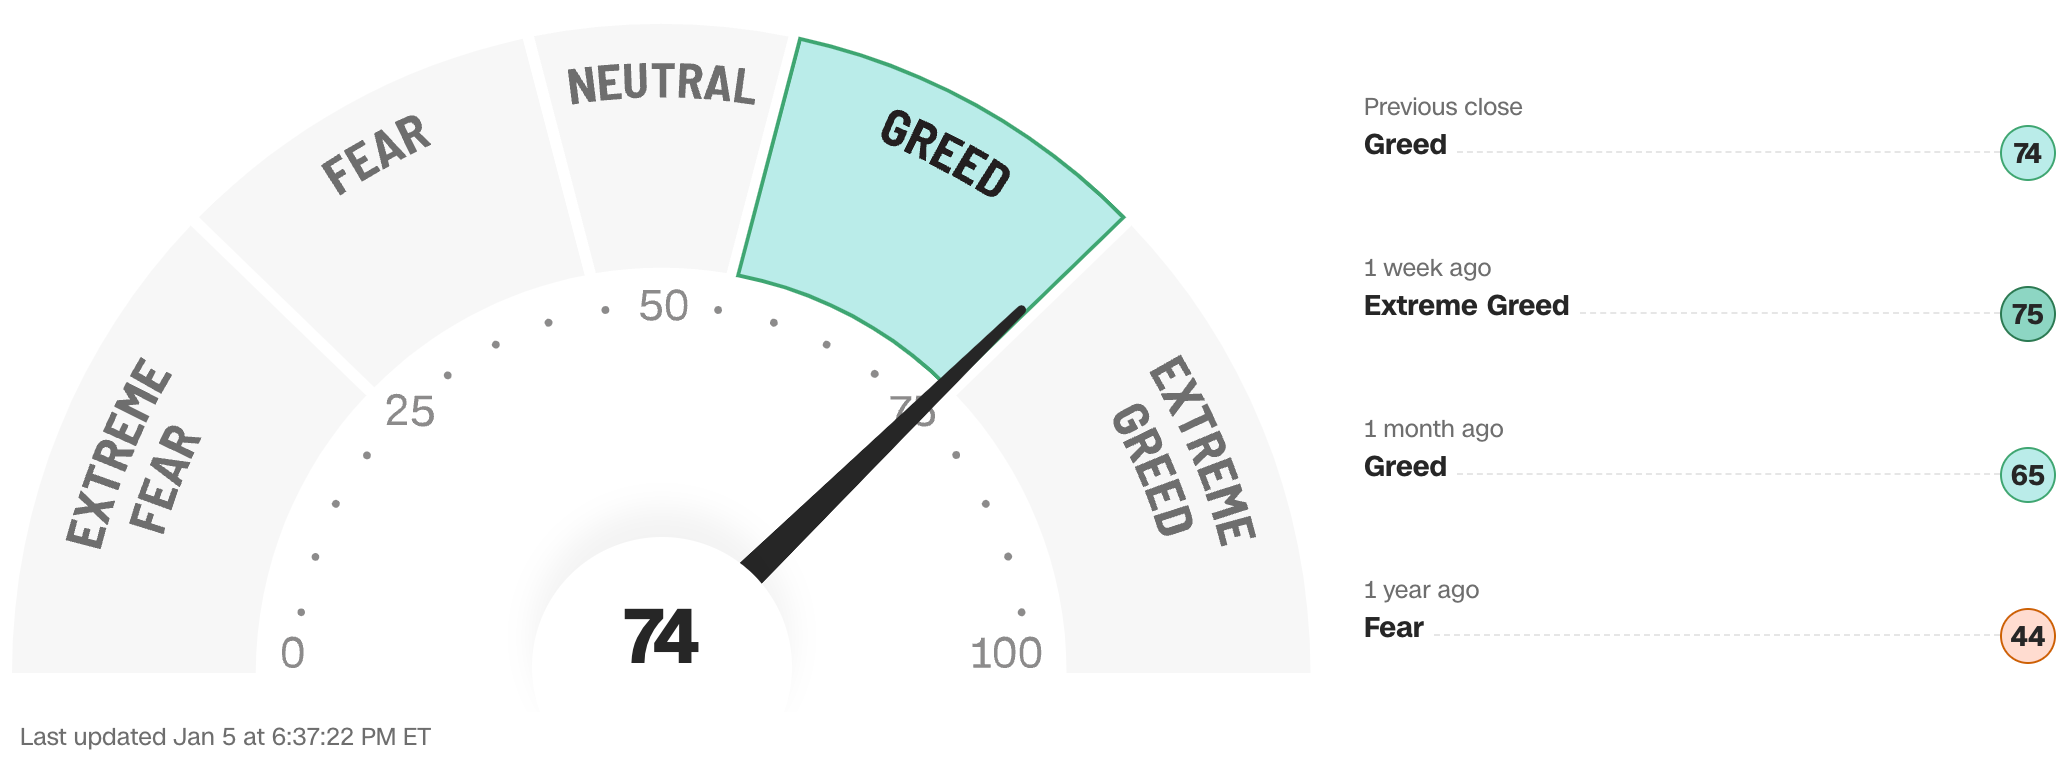
The Fear & Greed Index from CNN Business can be used as an attempt to gauge whether or not stocks are fairly priced and to determine the mood of the market. It is a compilation of seven different indicators that measure some aspect of stock market behavior. They are: market momentum, stock price strength, stock price breadth, put and call options, junk bond demand, market volatility and safe haven demand.
Extreme Fear readings can lead to potential opportunities as investors may have driven prices “too low” from a possibly excessive risk-off negative sentiment.
Extreme Greed readings can be associated with a sense of “FOMO” and investors chasing rallies in an excessively risk-on environment . This overcrowded positioning leaves the market potentially vulnerable to a sharp downward reversal at some point.
The “sweet spot” is considered to be in the lower-to-mid “Greed” zone.
Data courtesy of CNN Business.
% OF S&P 500 STOCKS TRADING ABOVE THEIR 50-DAY MOVING AVERAGE ..
87% (437 of the 500 largest stocks in the U.S. ended last week above their 50d MA and 63 were below)
One week ago: 89%, one month ago: 80%, one year ago: 42%
% OF S&P 500 STOCKS TRADING ABOVE THEIR 200-DAY MOVING AVERAGE ..
75% (375 of the 500 largest stocks in the U.S. ended last week above their 200d MA and 125 were below)
One week ago: 75%, one month ago: 61%, one year ago: 47%
Closely-watched measures of market breadth and participation, providing a real-time look at how many of the largest 500 publicly-traded stocks in the U.S. are trending higher or lower, as defined by whether the stock price is above or below their 50-day (short term) and 200-day (long term) moving averages which are among the most widely-followed of all stock market technical indicators.
The higher the reading, the better the deemed health of the overall market, with 50% considered to be a key pivot point.
WEEKLY US INVESTOR SENTIMENT (outlook for the upcoming 6 months) ..
↑Bullish: 49% (46% a week ago)
⬌ Neutral: 28% (29% a week ago)
↓Bearish: 23% (25% a week ago)
Net Bull-Bear spread: ↑Bullish by 26 (Bullish by 21 a week ago)
For context: Long term averages: Bullish: 38% — Neutral: 32% — Bearish: 30% — Net Bull-Bear spread: Bullish by 8
Survey participants are typically polled during the first half of the week.
Data courtesy of: American Association of Individual Investors (AAII).
FEDWATCH INTEREST RATE TOOL ..
Will interest rates be lower than they are now after the Fed’s next meeting (January 31st)?
Yes .. 6% probability (17% a week ago)
No .. 94% probability (83% a week ago)
Will interest rates be lower than they are now after the Fed’s following meeting (March 20th)?
Yes .. 64% probability (87% a week ago)
No .. 36% probability (13% a week ago)
Based on the Fed Funds rate (currently 5.375%). Calculated from Federal Funds futures prices as of Friday. Data courtesy of CME FedWatch Tool.
US TREASURY INTEREST RATE YIELD CURVE ..

The highest rate on the yield curve (5.54%) is being paid for the 1-month duration and the lowest rate (4.02%) is for the 5-year.
The most closely-watched and commonly-used comparative measure of the spread between the 2-year and the 10-year remained unchanged at 0.35%.
The interest rate yield curve remains unusually “inverted” (i.e. shorter term interest rates are generally higher than longer term ones). Based on the 2-year vs. 10-year spread, the curve has been inverted since July 2022.
Historically, an inverted yield curve is not the norm and has been regarded by many as a leading indicator of an impending recession, with shorter term risk deemed to be unusually higher than longer term. The steeper the inversion, the greater the deemed risk of recession.
Data courtesy of ustreasuryyieldcurve.com as of Friday. Lightly shaded area on the chart shows the current Federal Funds rate range.
WWW.ANGLIAADVISORS.COM | SIMON@ANGLIAADVISORS.COM | CALL OR TEXT: (929) 677 6774 | FOLLOW ANGLIA ADVISORS ON INSTAGRAM
This material represents a highly opinionated assessment of the financial market environment based on assumptions and prevailing data at a specific point in time and is always subject to change at any time. No warranty of its accuracy or completeness is given. It is never to be interpreted as an attempt to forecast any future events, nor does it offer any kind of guarantee of any future results, circumstances or outcomes.
The material contained herein is not necessarily complete and is wholly insufficient to be exclusively relied upon as research or investment advice or as a sole basis for any investment or other financial decisions. The user assumes the entire risk of any decisions made or actions taken based in whole or in part on any of the information provided in this or any Anglia Advisors communication of any kind. Under no circumstances is any of Anglia Advisors’ content ever intended to constitute tax, legal or medical advice and should never be taken as such. Neither the information contained or any opinion expressed herein constitutes a solicitation for the purchase of any security or asset class.
Posts may contain links or references to third party websites or may post data or graphics from them for the convenience and interest of readers. While Anglia Advisors may have reason to believe in the quality of the content provided on these sites, the firm has no control over, and is not in any way responsible for, the accuracy of such content nor for the security or privacy protocols that external sites may or may not employ. By making use of such links, the user assumes, in its entirety, any kind of risk associated with accessing them or making use of any information provided therein.
Those associated with Anglia Advisors, including clients with managed or advised investments, may maintain positions in securities and/or asset classes mentioned in this post.

If you enjoyed this post, why not share it with someone or encourage them to subscribe themselves?


