


A Fed week began on Monday with financial markets pretty much on hold. While there was zero probability of an interest rate cut announcement, the Wednesday March meeting of the interest rate-setting committee was still set to include the “Dot Plot & Statement of Economic Projections”; members’ quarterly estimates of where they believe interest rates, inflation and economic growth are heading in the coming months and years. This was bound to make interesting reading in the current uncertain market conditions.
Retail sales data before the open showed an increase in February but less of a rebound from a poor January than had been expected. However, markets mostly took the day off, chilling out ahead of Wednesday’s Fed meeting. Stocks drifted aimlessly around the unchanged line before a bit of a late surge saw the indexes all finish Monday in the green on what was a thankfully drama-free day on the tariff front.
Geopolitics, however, were in motion. Mass death returned to Gaza as the ceasefire unravelled. Trump and Putin began to cozily plot the carve-up of Ukraine. Germany’s parliament voted in historic constitutional changes to allow heavily increased defense spending, massively impacting the economy of Europe’s largest nation.
Stocks opened sharply lower on Tuesday after the respite of two days of gains since the S&P 500 entered a correction. Tech/AI got slaughtered again on the sense that all this stuff is quite simply overpriced right now as a result of an unjustified level of euphoria over the last two years. Tesla’s catastrophic price crash just since New Year’s Day approached 50% after nine straight weeks of declines (another Cybertruck recall and increasing product and showroom vandalism around the world isn’t helping) and Nvidia’s slump in only the last month got to close to 20%. Meta/Facebook had previously been the lone Magnificent Seven stock to escape the carnage of 2025 but it, too, finally went negative for the year on Tuesday. It was another wretched session for the indexes, especially the NASDAQ.
Wednesday was Fed Day and stocks drifted a little higher in advance of the release of the Dot Plot as well as the interpretation of the tone of the Fed’s statement and chairman Powell’s 2:30pm ET press conference.
As expected, the Fed did nothing on interest rates but the Dot Plot implied expectations of two cuts over the rest of 2025 with more to follow in 2026. It marked up inflation forecasts while marking down estimates of economic growth, giving off a strong whiff of stagflation risk.
Powell pretty much admitted in the press conference that the central bank is flying blind right now given the mountain of policy uncertainty that it is up against and that the Dot Plot projections should be viewed as rapidly moving targets.
The stock market continued its march upwards with a sense that stagflation was a (big) problem for another day, but for now Wall Street was just going to enjoy the fact that interest rate cuts are still on the table for this year and next. Interest rates dropped and the indexes all closed nicely higher.
Thursday began with an as-expected Weekly Jobless Claims number and the Bank of England leaving local interest rates unchanged. Trump slammed Powell for not cutting rates and again threatened the sacred independence of the Fed. Stocks flip-flopped between gains and losses over the course of the session but ended up virtually unchanged.
Friday was a “triple witching” day. Wall Street braced for potentially elevated volatility in what is already something of a tinderbox environment. Stocks rolled over again at the open on fears of the approaching dreaded April 2nd expected orgy of tariff impositions which the president once again touted as “Liberation Day” , but recovered slowly after lunch and the derivatives-driven last minute activity inched the indexes just about into the green for both the session and the week.
It’s becoming clear that, given current policy uncertainty, nothing really “bad” has to happen for stocks to plunge like they did on Tuesday. The burden of proof in this market sits firmly with the bulls.
Market bets that enriched investors heading into this year have been mired in a world of pain recently. It’s the case with Big Tech shares, crypto, the US Dollar and the most revered investment strategy of them all: Buy The Dip. The result has been a nightmare stretch for retail bottom-fishers diving back into last year’s winners after a decline.
I happen to agree with a narrative that emerged last week among some analysts that stock markets, particularly tech/AI names, may to some extent be using tariff chaos as a bit of an excuse or smokescreen for orchestrating a pullback from very, very high valuations.
If you are not yet a client of Anglia Advisors and would like to explore becoming one, please feel free to reach out for a complimentary no-obligation discovery call with me.
ARTICLE OF THE WEEK ..
Continuing my series of recommended articles on how to approach market corrections like this, “A sane take in a sea of panic” from Ritholtz’s wonderful Callie Cox is great way to think about things right now.
.. AND I QUOTE:
“The trouble with tariffs, to be succinct, is that they raise prices, slow economic growth, cut profits, increase unemployment, worsen inequality, diminish productivity and increase global tensions. Other than that, they’re fine.”
Dr. David Kelly, JP Morgan Chief Global Strategist and Head of Global Market Insights Strategy.
LAST WEEK BY THE NUMBERS:
Last week’s market color courtesy of finviz.com
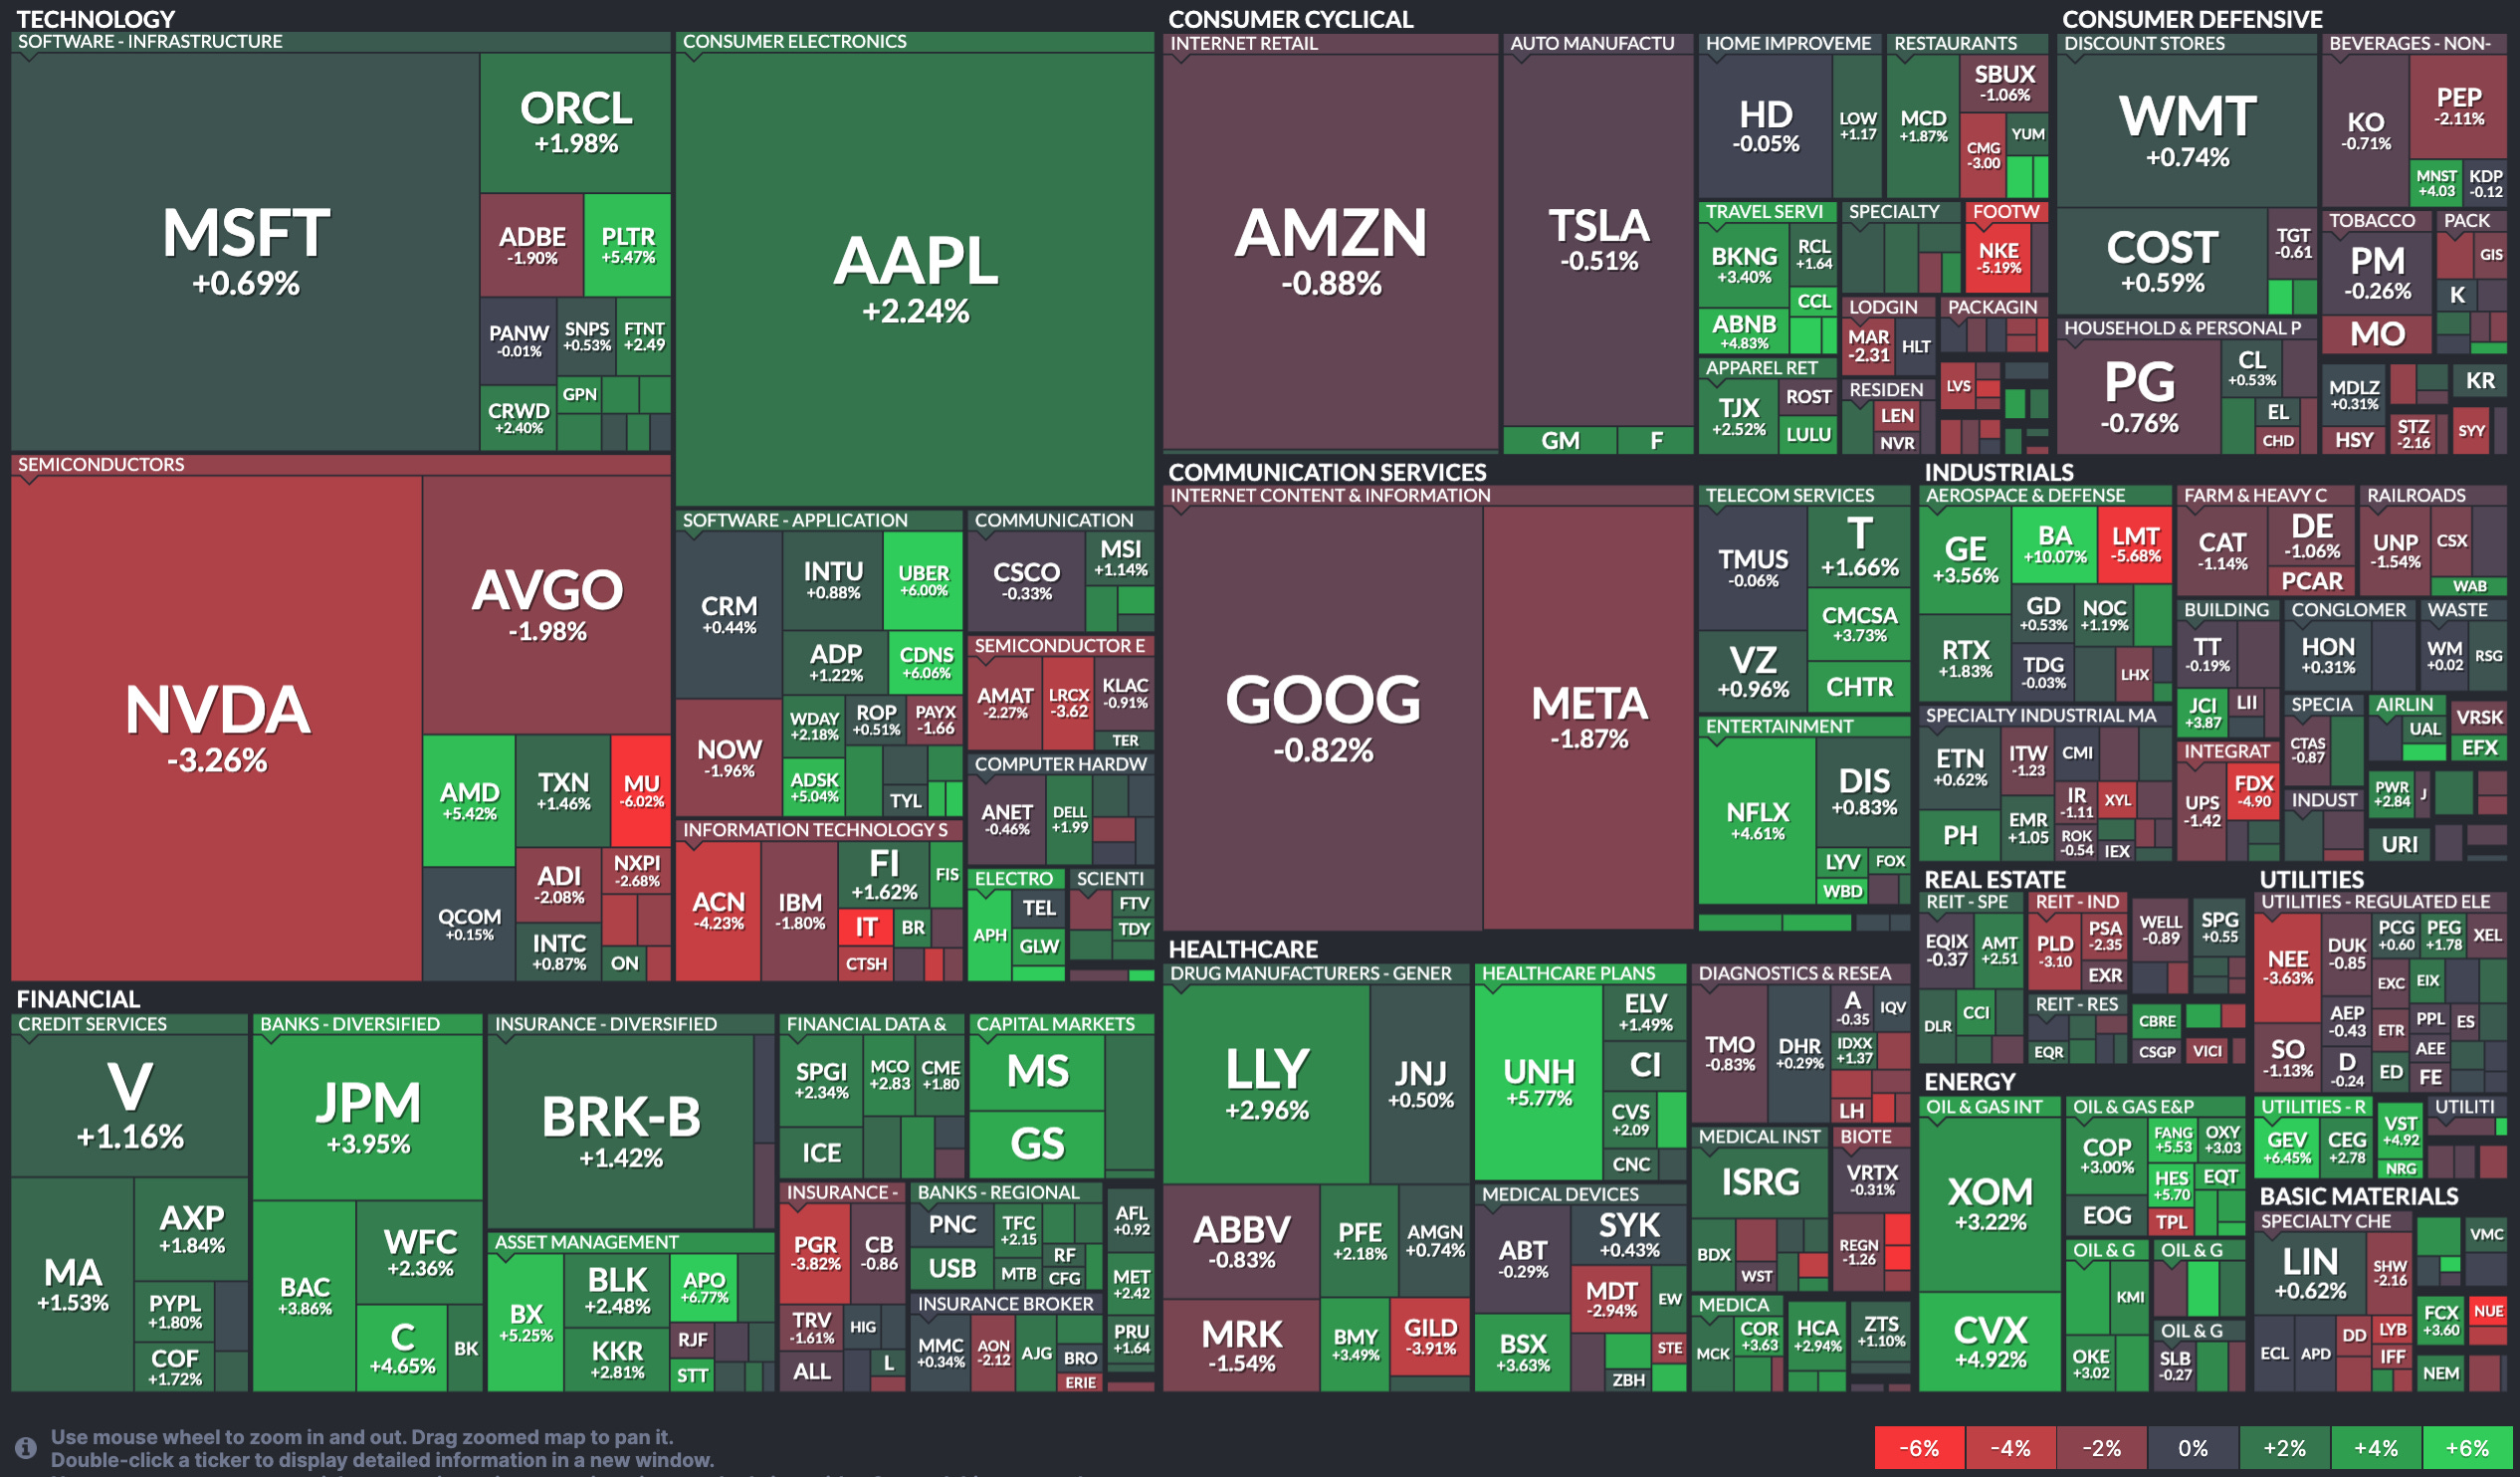
Last week’s best performing U.S. sector: Energy (two biggest holdings: Exxon Mobil, Chevron) for the second week in a row ⬆︎ 3.3% for the week
Last week’s worst performing U.S. sector: Consumer Defensive (two biggest holdings: Costco, Procter & Gamble) ⬇︎ 0.3% for the week
SPY, the S&P 500 Large Cap ETF, tracks the S&P 500 index, made up of 500 stocks from a universe of the largest U.S. companies. Its price rose 0.4% last week, is down 3.8% so far this year and ended the week 8.0% below its all-time record closing high (02/19/2025).
IWM, the Russell 2000 Small Cap ETF, tracks the Russell 2000 index, made up of the bottom two-thirds in terms of company size of a universe of 3,000 of the largest U.S. stocks. Its price rose 0.6% last week, is down 7.8% so far this year and ended the week 16.0% below its all-time record closing high (11/08/2021).
INTEREST RATES:
FED FUNDS * ⬌ 4.33% (unchanged)
PRIME RATE ** ⬌ 7.50% (unchanged)
3 MONTH TREASURY ⬌ 4.33% (4.33% a week ago)
2 YEAR TREASURY ⬇︎ 3.94% (4.02% a week ago)
10 YEAR TREASURY *** ⬇︎ 4.25% (4.31% a week ago)
20 YEAR TREASURY ⬇︎ 4.60% (4.65% a week ago)
30 YEAR TREASURY ⬇︎ 4.59% (4.62% a week ago)
Treasury data courtesy of ustreasuryyieldcurve.com as of the market close on Friday.
* Decided upon by the Federal Reserve. Used as a basis for interbank loans and for determining high yield savings rates.
** Used as a basis for determining many consumer loan rates such as credit cards, home equity and auto.
*** Used as a basis for determining mortgage rates.
AVERAGE 30-YEAR FIXED MORTGAGE RATE:
⬆︎ 6.67%
One week ago: 6.65%, one month ago: 6.85%, one year ago: 6.87%
Data courtesy of: FRED Economic Data, St. Louis Fed as of last Thursday.
FEDWATCH INTEREST RATE TOOL:
Where will the Fed Funds interest rate be after the next rate-setting meeting on May 7th?
Unchanged from now .. ⬆︎ 86% probability (72% a week ago)
0.25% lower than now .. ⬇︎ 14% probability (28% a week ago)
What is the most commonly-expected number of remaining 0.25% Fed interest rate cuts in 2025?
⬌ 3 (unchanged from a week ago)
All data based on the Fed Funds interest rate (currently 4.33%). Calculated from Federal Funds futures prices as of the market close on Friday. Data courtesy of CME FedWatch Tool.
FEAR & GREED INDEX:
“Be fearful when others are greedy and be greedy when others are fearful.” Warren Buffet.

The Fear & Greed Index from CNN Business can be used as an attempt to gauge whether or not stocks are fairly priced and to determine the mood of the market. It is a compilation of seven of the most important indicators that measure different aspects of stock market behavior. They are: market momentum, stock price strength, stock price breadth, put and call option ratio, junk bond demand, market volatility and safe haven demand.
Extreme Fear readings can lead to potential opportunities as investors may have driven prices “too low” from a possibly excessive risk-off negative sentiment.
Extreme Greed readings can be associated with possibly too-frothy prices and a sense of “FOMO” with investors chasing rallies in an excessively risk-on environment . This overcrowded positioning leaves the market potentially vulnerable to a sharp downward reversal at some point.
A “sweet spot” is considered to be in the lower-to-mid “Greed” zone.
Data courtesy of CNN Business as of Friday’s market close.
WWW.ANGLIAADVISORS.COM | SIMON@ANGLIAADVISORS.COM | CALL OR TEXT: (646) 286 0290 | FOLLOW ANGLIA ADVISORS ON INSTAGRAM
This material represents a highly opinionated assessment of the financial market environment based on assumptions and prevailing information and data at a specific point in time and is always subject to change at any time. Although the content is believed to be correct at the time of publication, no warranty of its accuracy or completeness is given. It is never to be interpreted as an attempt to forecast any future events, nor does it offer any kind of guarantee of any future results, circumstances or outcomes.
The material contained herein is not necessarily complete and is also wholly insufficient to be exclusively relied upon as research or investment advice or as a sole basis for any financial decisions, including investment decisions or making any kind of consumer choices, without further consultation with Anglia Advisors or other qualified Registered Investment Advisor. The user assumes the entire risk of any decisions made or actions taken based in whole or in part on any of the information provided in this or any Anglia Advisors communication of any kind.
Under no circumstances is any of Anglia Advisors’ content ever intended to constitute tax, legal or medical advice and should never be taken as such. Neither the information contained or any opinion expressed herein constitutes a solicitation for the purchase of any security or asset class. No client advice may be rendered by Anglia Advisors unless or until a properly-executed Client Engagement Agreement is in place.
Posts may contain links or references to third party websites or may post data or graphics from them for the convenience and interest of readers. While Anglia Advisors might have reason to believe in the quality of the content provided on these sites, the firm has no control over, and is not in any way responsible for, the accuracy of such content nor for the security or privacy protocols that external sites may or may not employ. By making use of such links, the user assumes, in its entirety, any kind of risk associated with accessing them or making use of any information provided therein.
Those associated with Anglia Advisors, including clients with managed or advised investments, may maintain positions in securities and/or asset classes mentioned in this post.

If you enjoyed this post, why not share it with someone or encourage them to subscribe themselves?


