


[Note: this report was put together before Saturday evening’s US airstrikes on Iran]
Financial markets were spoiled for choice about what to focus on at the kick-off of a holiday-shortened week - geopolitics, energy and shipping prices, tariffs and trade, a G-7 meeting in Canada, the tax and spending bill and multiple central bank interest rate-setting meetings around the world including at the Fed along with the publication of its quarterly dot plot.
The previous Friday’s risk-off narrative that had been triggered by Israel’s attack on Iran moderated at the opening bell on Monday as oil prices retreated somewhat from their spike. The Bank of Japan held interest rates steady. Stocks shifted nicely higher and by the closing bell, the S&P 500 had recovered almost all of Friday’s losses.
After the market close, Trump raised the geopolitical temperature by calling for the evacuation of Tehran. He refused to sign on to a statement agreed upon by the rest of the G-7 leaders that did no more than call for a de-escalation of the conflict and then, just as he did in 2018, he promptly walked out of the meeting early and went home. No coherent explanation was given for his premature departure.
A renewed sense of anxiety returned to markets on Tuesday following Trump’s antics and oil prices resumed their march higher. Stocks bumped nervously along just below the unchanged line for a while until Trump started posting again, this time a demand for Iran’s “UNCONDITIONAL SURRENDER!”, raising fears that the US might soon weigh in militarily. Stock indexes took a dive to finish the day quite a bit lower.
Fed Day dawned on Wednesday with zero prospects of an interest rate cut but a lot of attention on the dot plot and on what chairman Powell’s tone was going to be like in the press conference.
Stocks were very perky in advance of the 2pm ET announcement which came in as expected with no rate cut and dot plot forecasts of imminent lower economic growth and higher inflation and unemployment (stagflation, anyone?). The median expected number of further 0.25% cuts in 2025 remained unchanged at two, matching that of futures markets (see FEDWATCH INTEREST RATE TOOL below).
Right after being publicly labelled as “a stupid person” by the president, Powell as usual danced expertly around the landmines that the financial press pack tried to lay for him in the press conference and Wall Street took away very little, other than the sense that this is a central bank that is in absolutely no rush to cut interest rates. But we all knew that anyway. The earlier rally fizzled out and both stocks and bonds finished the day unchanged.
US markets were closed on Thursday. Across the pond, the Bank of England became the third major central bank of the week to leave interest rates unchanged but its Swiss equivalent cut its local rates to zero. The Israel/Iran war rumbled on and death and destruction also continued in Ukraine and Gaza with no resolution in sight. Oil prices kept on climbing, heading for a third straight week of gains.
Wall Street traders returned to their posts for something of a potential dead duck of a session on Friday (although it was a triple witching day), still trying to game out where things were heading in the highly unpredictable arenas of the Middle East, the White House, Congress and the bond market.
The indexes meandered sideways ahead of another potentially impactful weekend of news and the now fully-anticipated spontaneous flare-ups from within the White House, with the S&P 500 ending both the session and the week just fractionally lower, a touch south of the 6000 level.
On its surface, the Israel/Iran clash is potentially extremely negative for markets as it risks plunging the Middle East into a regional war if more countries get involved and raises the risk that Iran attacks US assets in the region.
However, the market reaction has been benign with the S&P 500 only about 1% lower than where it was the day before Israel launched its attack and many are asking, why doesn’t Wall Street care more about this?
I think there are a couple of answers. First, Iran’s military capabilities have apparently been materially degraded by both the attacks and years of sanctions, likely limiting their effectiveness. Second, the barometer of geopolitical risk to markets is the price of oil and Iran is no longer a major global oil player. Given likely OPEC production increases and Saudi Arabia’s dominance, the conflict in its current state is unlikely to keep oil prices elevated for very long.
When added to the other unknowns (tariffs and trade, inflation, interest rates, economic growth etc.), the conflict in its present condition may make stock rallies a bit harder to manufacture in the near term but is likely not, by itself, enough to cause a significant and sustainable correction.
However, if either of those assumptions change and a broader war does break out and/or oil prices sustainably hold at a higher level, then the market will begin to care a lot more about this crisis and it could then start to prove negative for stocks in a more intense and enduring way (see .. AND I QUOTE .. below).
If you are not yet a client of Anglia Advisors and would like to explore becoming one, please feel free to reach out to arrange a complimentary no-obligation discovery call with me.
ARTICLE(S) OF THE WEEK ..
Copenhagen, Denmark is the best place in the world to live and the best restaurant in the world is in Lima, Peru.
.. AND I QUOTE ..
“Geopolitical risk is not an investable thesis unless you are a very short term trader”
Alicia Levine, Bank of New York Head of Investment Strategy
LAST WEEK BY THE NUMBERS:
Last week’s market color courtesy of finviz.com

Last week’s best performing US sector: Energy (two biggest holdings: Exxon-Mobil, Chevron) for the second week in a row ⬆︎ 2.9% for the week
Last week’s worst performing US sector: Healthcare (two biggest holdings: Eli Lilly, Johnson and Johnson) ⬇︎ 3.1% for the week
SPY, the S&P 500 Large Cap ETF, tracks the S&P 500 index, made up of 500 stocks from a universe of the largest U.S. companies. Its price fell 0.5% last week, is up 1.4% so far this year and ended the week 3.0% below its all-time record closing high (02/19/2025).
IWM, the Russell 2000 Small Cap ETF, tracks the Russell 2000 index, made up of the bottom two-thirds in terms of company size of a universe of 3,000 of the largest U.S. stocks. Its price rose 0.1% last week, is down 5.3% so far this year and ended the week 13.7% below its all-time record closing high (11/08/2021).
INTEREST RATES:
FED FUNDS * ⬌ 4.33% (unchanged)
PRIME RATE ** ⬌ 7.50% (unchanged)
3 MONTH TREASURY ⬇︎ 4.39% (4.45% a week ago)
2 YEAR TREASURY ⬇︎ 3.90% (3.96% a week ago)
5 YEAR TREASURY ⬇︎ 3.96% (4.02% a week ago)
10 YEAR TREASURY *** ⬇︎ 4.38% (4.41% a week ago)
20 YEAR TREASURY ⬇︎ 4.90% (4.93% a week ago)
30 YEAR TREASURY ⬇︎ 4.89% (4.90% a week ago)
Treasury data courtesy of ustreasuryyieldcurve.com as of the market close on Friday.
* Decided upon by the Federal Reserve. Used as a basis for interbank loans and for determining high yield savings rates.
** Wall Street Journal Prime rate. Used as a basis for determining many consumer loan rates such as credit cards, personal loans, home equity, securities-based lending and auto loans.
*** Used as a basis for determining mortgage rates.
AVERAGE 30-YEAR FIXED MORTGAGE RATE:
⬇︎ 6.81%
One week ago: 6.84%, one month ago: 6.84%, one year ago: 6.87%
Data courtesy of: FRED Economic Data, St. Louis Fed as of last Thursday.
FEDWATCH INTEREST RATE TOOL:
Where will the Fed Funds interest rate be after the next rate-setting meeting on July 30th?
Unchanged from now .. ⬆︎ 83% probability (77% a week ago)
0.25% lower than now .. ⬆︎ 17% probability (23% a week ago)
What is the most commonly-expected number of remaining 0.25% Fed Funds interest rate cuts in 2025?
⬌ 2 (unchanged from a week ago)
All data based on the Fed Funds interest rate (currently 4.33%). Calculated from Federal Funds futures prices as of the market close on Friday. Data courtesy of CME FedWatch Tool.
FEAR & GREED INDEX:
“Be fearful when others are greedy and be greedy when others are fearful.” Warren Buffet.
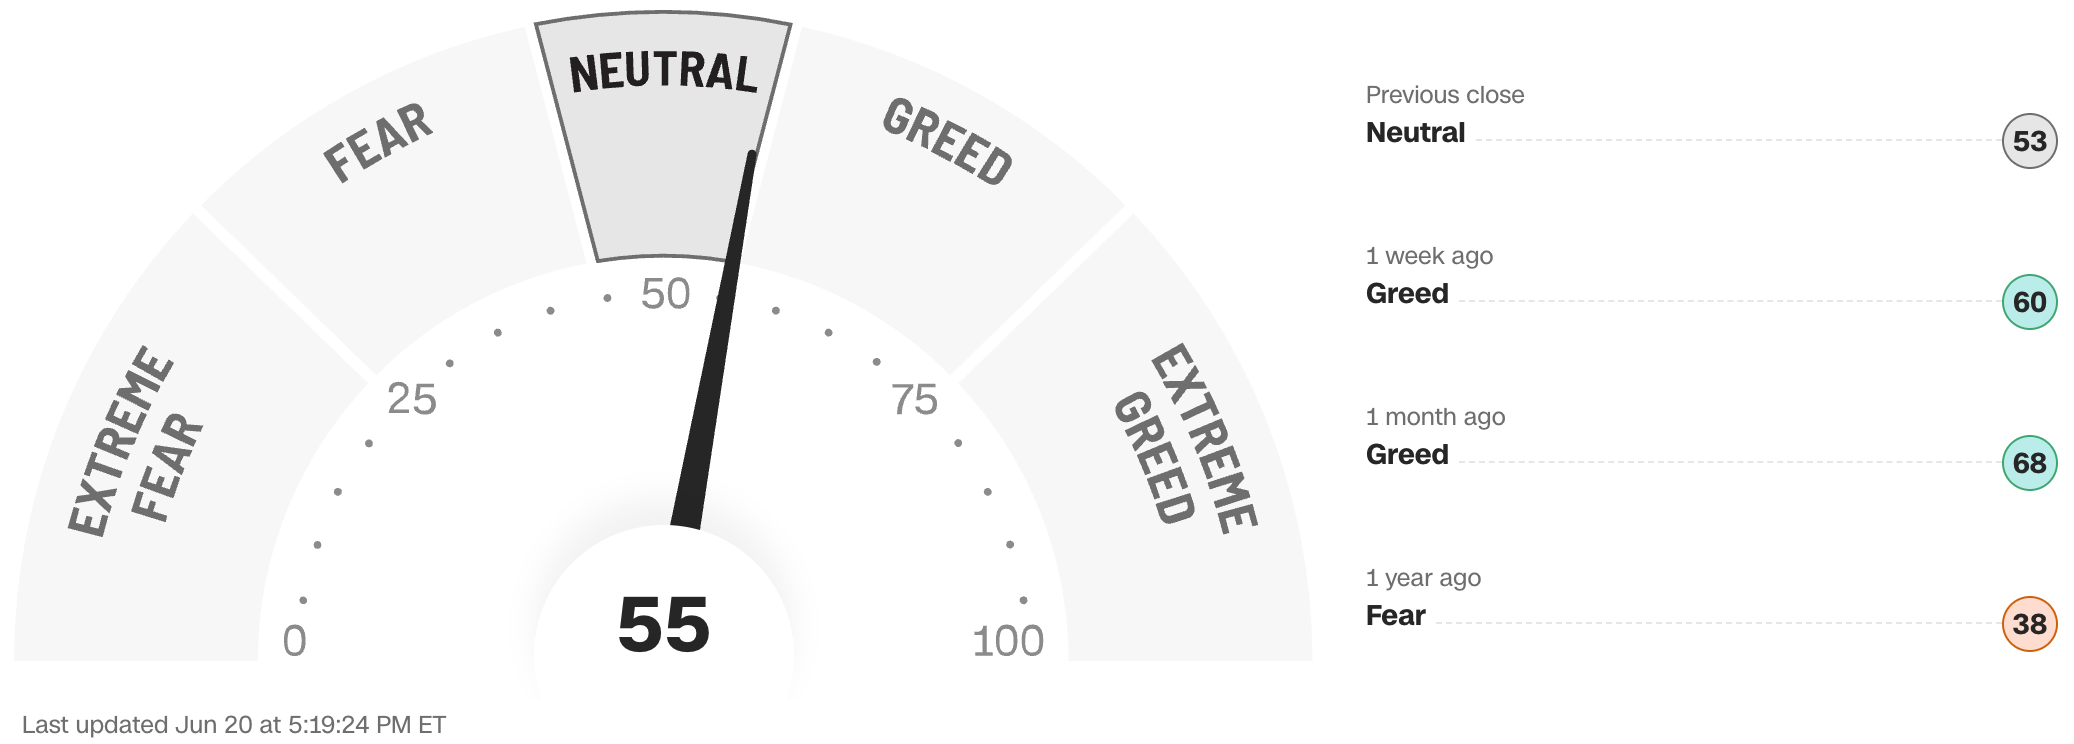
The Fear & Greed Index from CNN Business can be used as an attempt to gauge whether or not stocks are fairly priced and to determine the mood of the market. It is a compilation of seven of the most important indicators that measure different aspects of stock market behavior. They are: market momentum, stock price strength, stock price breadth, put and call option ratio, junk bond demand, market volatility and safe haven demand.
Extreme Fear readings can lead to potential opportunities as investors may have driven prices “too low” from a possibly excessive risk-off negative sentiment.
Extreme Greed readings can be associated with possibly too-frothy prices and a sense of “FOMO” with investors chasing rallies in an excessively risk-on environment . This overcrowded positioning leaves the market potentially vulnerable to a sharp downward reversal at some point.
A “sweet spot” is considered to be in the lower-to-mid “Greed” zone.
Data courtesy of CNN Business as of Friday’s market close.
WWW.ANGLIAADVISORS.COM | SIMON@ANGLIAADVISORS.COM | CALL OR TEXT: (646) 286 0290 | FOLLOW ANGLIA ADVISORS ON INSTAGRAM
This material represents a highly opinionated assessment of the financial market environment based on assumptions and prevailing information and data at a specific point in time and is always subject to change at any time. Although the content is believed to be correct at the time of publication, no warranty of its accuracy or completeness is given. It is never to be interpreted as an attempt to forecast any future events, nor does it offer any kind of guarantee of any future results, circumstances or outcomes.
The material contained herein is not necessarily complete and is also wholly insufficient to be exclusively relied upon as research or investment advice or as a sole basis for any financial decisions, including investment decisions or making any kind of consumer choices, without further consultation with Anglia Advisors or other qualified Registered Investment Advisor. The user assumes the entire risk of any decisions made or actions taken based in whole or in part on any of the information provided in this or any other Anglia Advisors published content.
Under no circumstances is any of Anglia Advisors’ content ever intended to constitute tax, legal or medical advice and should never be taken as such. Neither the information contained or any opinion expressed herein constitutes a solicitation for the purchase of any security or asset class. No client advice may be rendered by Anglia Advisors unless and until a properly-executed Client Engagement Agreement is in place.
Posts may contain links or references to third party websites or may post data or graphics from them for the convenience and interest of readers. While Anglia Advisors might have reason to believe in the quality of the content provided on these sites, the firm has no control over, and is not in any way responsible for, the accuracy of such content nor for the security or privacy protocols that external sites may or may not employ. By making use of such links, the user assumes, in its entirety, any kind of risk associated with accessing them or making use of any information provided therein.
Those associated with Anglia Advisors, including clients with managed or advised investments, may maintain positions in securities and/or asset classes mentioned in this post.

If you enjoyed this post, why not share it with someone?


