


To the surprise of absolutely no-one on Sunday, Trump backed down on his threat of a massive June 1st blanket 50% tariff on the European Union. The supposed effective date is now July 9th, which is the same day that the current pause on the April 2nd tariffs is set to expire.
The deferral of this particular tariff risk injected some optimism into European markets while the US and the UK both enjoyed a holiday on Monday. A potentially busy shortened trading week on Wall Street began on a very positive note on Tuesday with stocks snapping back hard after a four day slide on hopes that US/EU fast-track trade talks may be on the cards following the tariff deferral.
The stock rally accelerated on the back of the late-morning release of consumer sentiment data showing that a lot of the doom and gloom from last month’s reading had evaporated due to Trump’s subsequent multiple walk-backs since so-called “Liberation Day” and recession fears have subsided. The indexes closed solidly higher. Interest rates moved sharply lower with the 30 year Treasury rate back below 5.0%.
The last major event of Q1 earnings season, Nvidia’s report, was scheduled for Wednesday after the close. Stocks and bonds opened steady but drifted gently lower into the close with traders unwilling to place any big bets ahead of the Nvidia news.
When it came out the news was pretty good. Revenues and earnings were somewhat higher than expected, although significant problems in China were identified. But the biggest story of the evening was still to come.
Hours later, the US Court of International Trade ruled that Trump had overstepped the limits of his presidential powers with his emergency decree and that most of the administration’s global tariffs were illegal (you can read a detailed explanation of the court ruling here). Asian stocks and US stock index futures exploded higher on the dramatic news.
Within minutes, the decision was appealed by the administration and by the time Wall Street opened on Thursday, the euphoria had died down as the realization dawned that the administration probably has other tariff pathways and this development actually has the potential to inject even further uncertainty and turn up the trade noise volume. But any bad news for tariffs is always good news for markets and there was still some green on the screen at the open.
The rally faded though as a hold was put on the ruling by an appeals court and the second estimate of Q1 Gross Domestic Product (GDP) confirmed the findings of first one; that US economic growth has gone negative for the first time since 2022. This indicated that the discernible gap between the still-broadly-positive hard data (official economic numbers) and the dismally despondent soft data (sentiment readings) may be narrowing. The indexes finished the session with only fractional gains.
The final trading day of the month on Friday began with a pre-market release of the key Personal Consumption Expenditures (PCE) annualized inflation reading of 2.1%, right on the cusp of the Fed’s 2% target. But Trump started barking wildly contradictory stuff about China (detail-free as usual) and it was this that led to a slightly weaker session for stocks although it brought to an end what was a positive week and the S&P 500 experienced its strongest May since 1990, rising by more than 6%. The NASDAQ showed a monthly gain of nearly 10%.
It's true that the theatrical, game-show aspects of continual tariff pauses and the (clearly exaggerated) narrative of potentially promising bilateral trade talks all over the place have created a steady drip of good news for financial markets.
Wall Street even has a name for it now, “the TACO trade” .. Trump Always Chickens Out. This is based on the idea that the president makes an outlandish and significant tariff proposal on a major US trading partner (China, the EU, Mexico, Canada etc.) providing shock and awe but then swiftly backtracks and either delays the implementation or exempts enough goods so that the tariff becomes toothless.
We got more of this after the close on Friday when out of nowhere he announced a doubling of steel tariffs at a rally in Pittsburgh attended primarily by .. US steel workers. Who knows if we will ever see that? Wall Street has no idea but is pretty much past worrying about it, given the TACO concept.
This buy-after-every-tariff-announcement trading strategy has worked so well lately that some market professionals even seem to think it means we can largely dismiss tariff threats going forward and that any associated selloff is just an opportunity to BTFD. Trump’s policy aspirations are also getting upended in courtrooms up and down the country.
But I don’t think it’s as simple as that and that the TACO trade ignores the fact that the train has probably already left the station in terms of the fundamental changes and shifting alliances that are taking place in global markets as a result of US trade policy and clumsy, belligerent international diplomacy.
Attention New York and Brooklyn readers:
I will be part of an in-person panel speaking in Brooklyn tomorrow (June 2nd) called “Get Your Act Together”, talking about protecting the value of your assets, navigating family dynamics and legacy considerations as you or your parents age.
It’s still not too late to sign up. I’d love to see you there! RSVP at the link above.
If you are not yet a client of Anglia Advisors and would like to explore becoming one, please feel free to reach out to arrange a complimentary no-obligation discovery call with me.
ARTICLE OF THE WEEK ..
“You can’t invest in what is, because the market trades on what could be. Trust the process, not your gut.”
Callie Cox’s five mind-blowing market facts that will make you a better investor.
.. AND I QUOTE ..
"It's not just about tech any more. That sector led global equities for a decade and a half, and now we're starting to get a wider spread. By diversifying, investors will get a better return."
Peter Oppenheimer, Chief global equity strategist, Goldman Sachs
LAST WEEK BY THE NUMBERS:
Last week’s market color courtesy of finviz.com
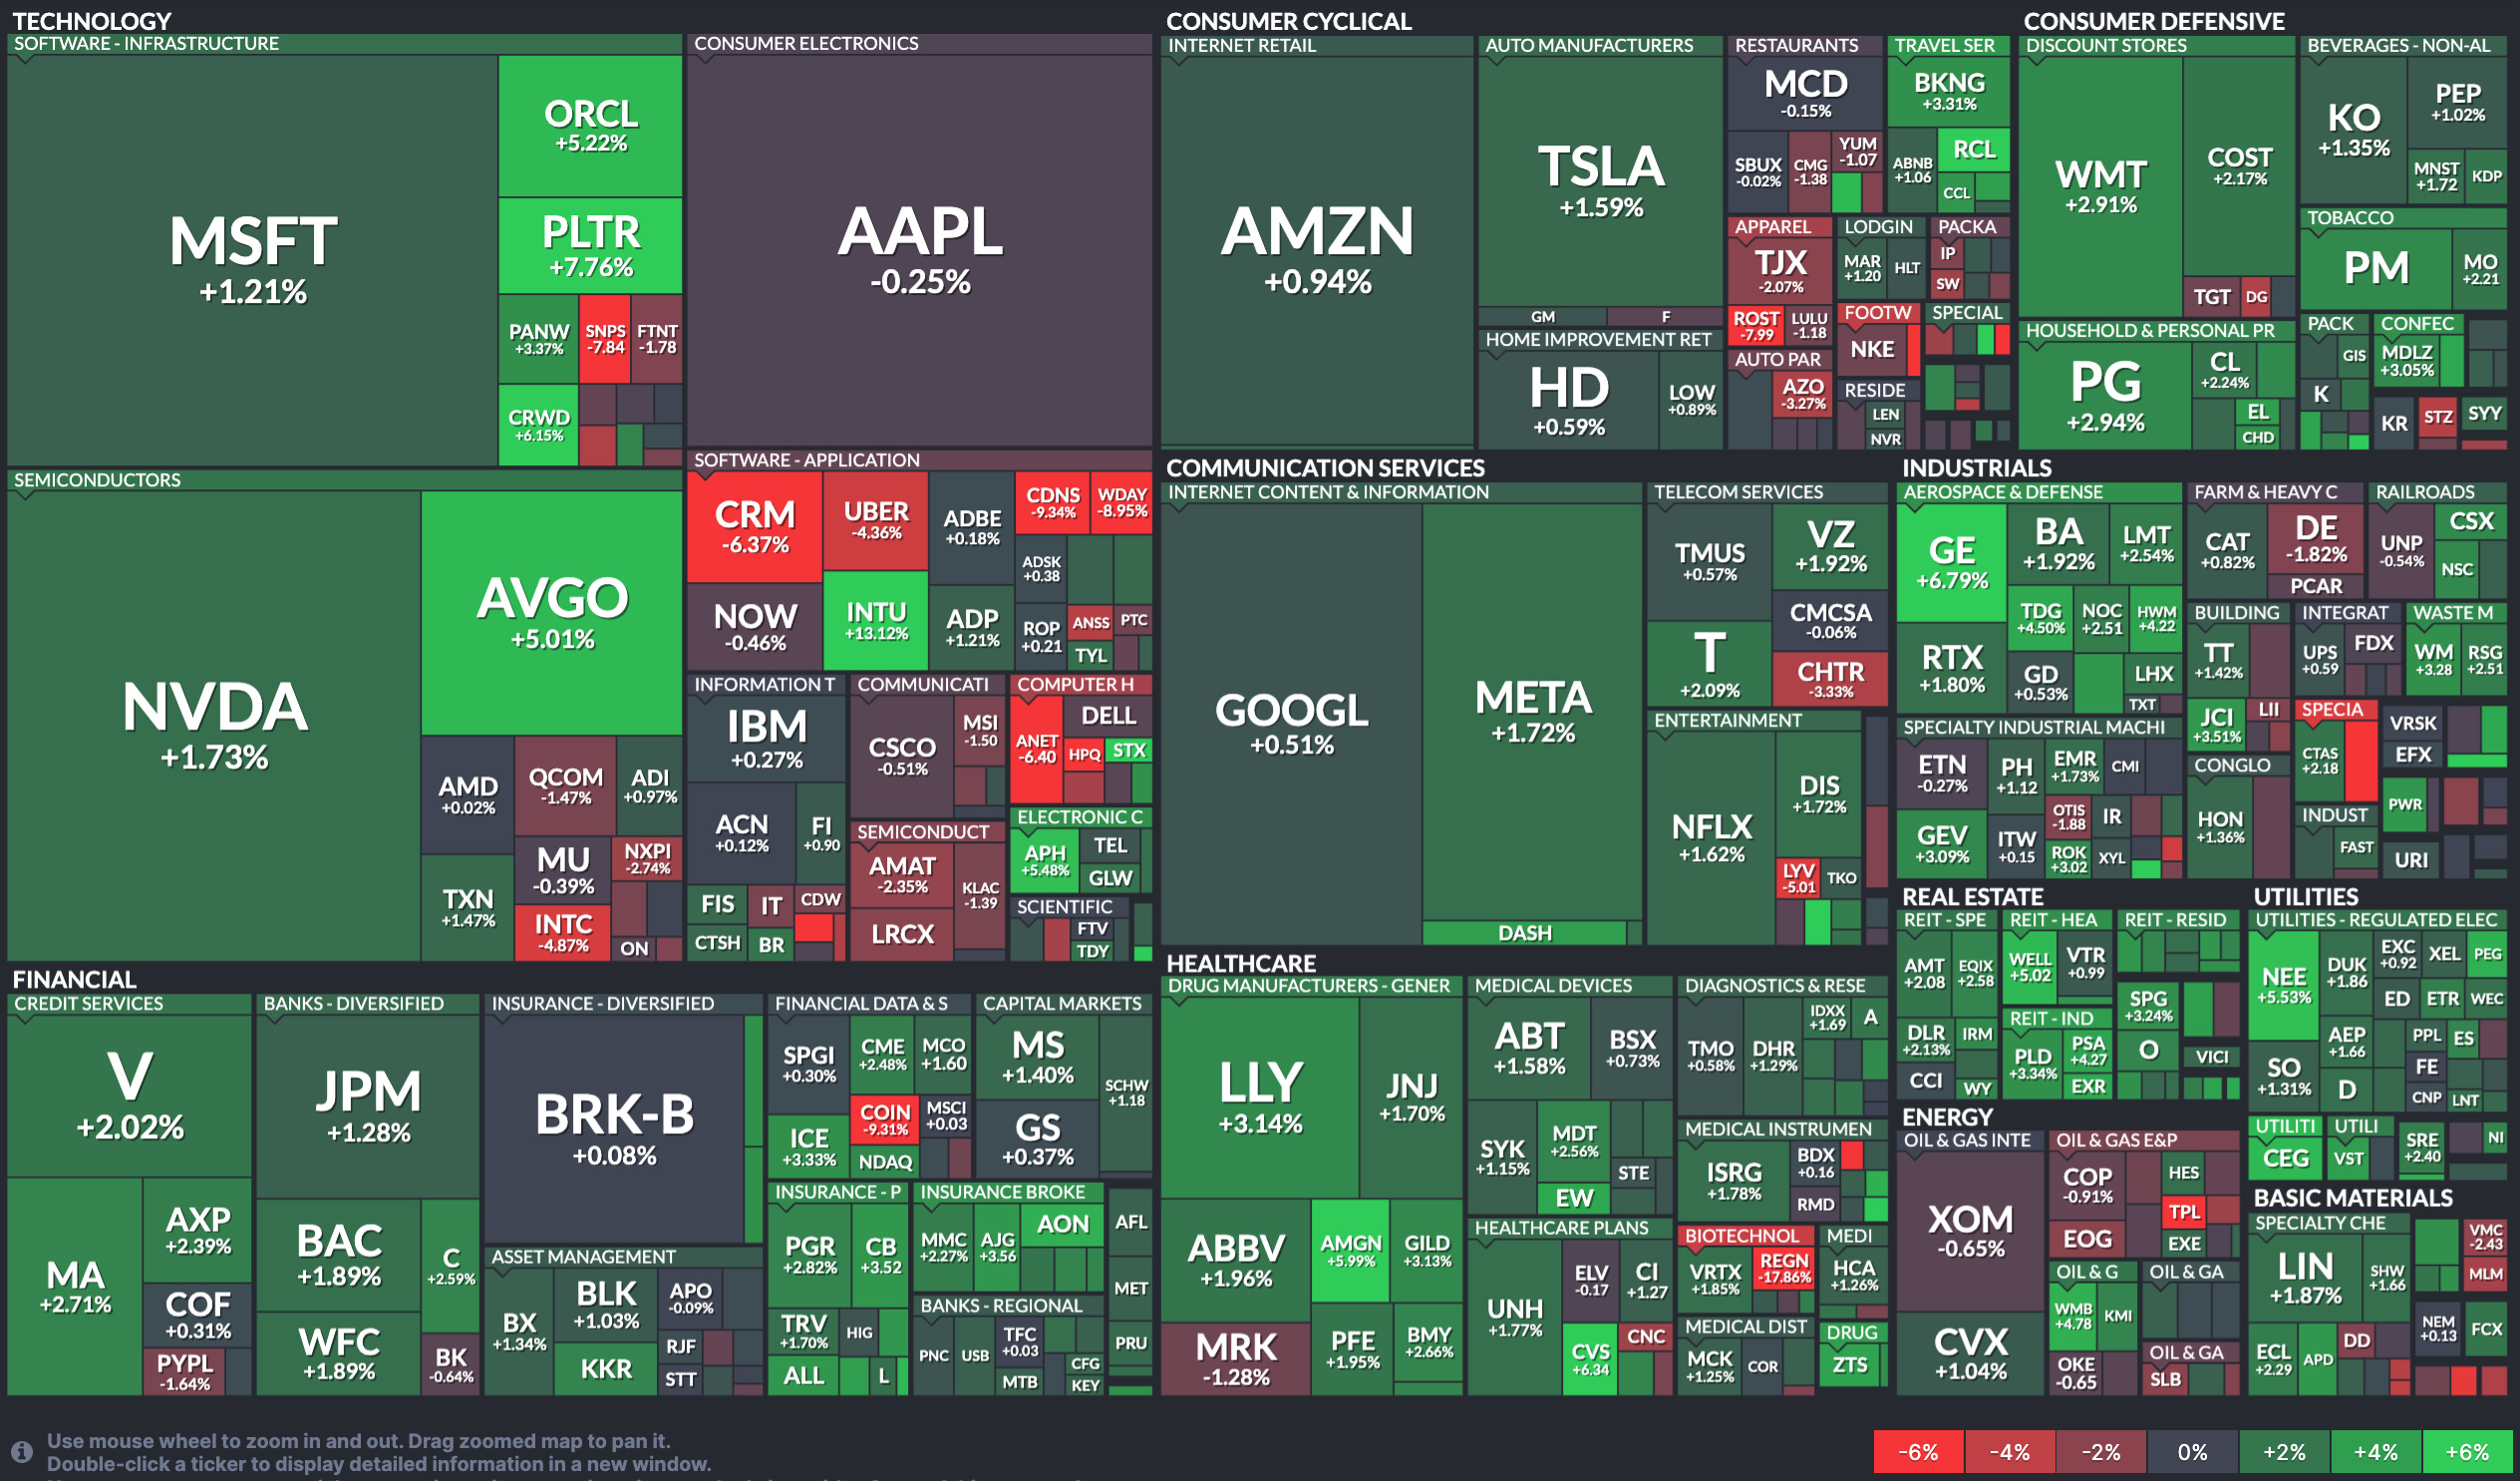
Last week’s best performing US sector: Real Estate (two biggest holdings: Prologis, American Tower) ⬆︎ 2.7% for the week
Last week’s worst performing US sector: Energy (two biggest holdings: Exxon-Mobil, Chevron) for the third week in a row ⬇︎ 0.4% for the week
SPY, the S&P 500 Large Cap ETF, tracks the S&P 500 index, made up of 500 stocks from a universe of the largest U.S. companies. Its price rose 1.8% last week, is up 0.6% so far this year and ended the week 3.8% below its all-time record closing high (02/19/2025).
IWM, the Russell 2000 Small Cap ETF, tracks the Russell 2000 index, made up of the bottom two-thirds in terms of company size of a universe of 3,000 of the largest U.S. stocks. Its price rose 1.3% last week, is down 7.1% so far this year and ended the week 15.4% below its all-time record closing high (11/08/2021).
INTEREST RATES:
FED FUNDS * ⬌ 4.33% (unchanged)
PRIME RATE ** ⬌ 7.50% (unchanged)
3 MONTH TREASURY ⬌ 4.36% (4.36% a week ago)
2 YEAR TREASURY ⬇︎ 3.89% (4.00% a week ago)
5 YEAR TREASURY ⬇︎ 3.96% (4.08% a week ago)
10 YEAR TREASURY *** ⬇︎ 4.41% (4.51% a week ago)
20 YEAR TREASURY ⬇︎ 4.93% (5.03% a week ago)
30 YEAR TREASURY ⬇︎ 4.92% (5.04% a week ago)
Treasury data courtesy of ustreasuryyieldcurve.com as of the market close on Friday.
* Decided upon by the Federal Reserve Open Market Committee which meets eight times a year. Used as a basis for interbank loans and for determining high yield savings rates.
** Wall Street Journal Prime rate. Used as a basis for determining many consumer loan rates such as credit cards, personal loans, home equity, securities-based lending and auto loans.
*** Used as a basis for determining mortgage rates.
AVERAGE 30-YEAR FIXED MORTGAGE RATE:
⬆︎ 6.89%
One week ago: 6.86%, one month ago: 6.77%, one year ago: 7.03%
Data courtesy of: FRED Economic Data, St. Louis Fed as of last Thursday.
FEDWATCH INTEREST RATE TOOL:
Where will the Fed Funds interest rate be after the next rate-setting meeting on June 18th?
Unchanged from now .. ⬆︎ 98% probability (96% a week ago)
0.25% lower than now .. ⬇︎ 2% probability (4% a week ago)
What is the most commonly-expected number of remaining 0.25% Fed Funds interest rate cuts in 2025?
⬌ 2 (unchanged from a week ago)
All data based on the Fed Funds interest rate (currently 4.33%). Calculated from Federal Funds futures prices as of the market close on Friday. Data courtesy of CME FedWatch Tool.
FEAR & GREED INDEX:
“Be fearful when others are greedy and be greedy when others are fearful.” Warren Buffet.

The Fear & Greed Index from CNN Business can be used as an attempt to gauge whether or not stocks are fairly priced and to determine the mood of the market. It is a compilation of seven of the most important indicators that measure different aspects of stock market behavior. They are: market momentum, stock price strength, stock price breadth, put and call option ratio, junk bond demand, market volatility and safe haven demand.
Extreme Fear readings can lead to potential opportunities as investors may have driven prices “too low” from a possibly excessive risk-off negative sentiment.
Extreme Greed readings can be associated with possibly too-frothy prices and a sense of “FOMO” with investors chasing rallies in an excessively risk-on environment . This overcrowded positioning leaves the market potentially vulnerable to a sharp downward reversal at some point.
A “sweet spot” is considered to be in the lower-to-mid “Greed” zone.
Data courtesy of CNN Business as of Friday’s market close.
WWW.ANGLIAADVISORS.COM | SIMON@ANGLIAADVISORS.COM | CALL OR TEXT: (646) 286 0290 | FOLLOW ANGLIA ADVISORS ON INSTAGRAM
This material represents a highly opinionated assessment of the financial market environment based on assumptions and prevailing information and data at a specific point in time and is always subject to change at any time. Although the content is believed to be correct at the time of publication, no warranty of its accuracy or completeness is given. It is never to be interpreted as an attempt to forecast any future events, nor does it offer any kind of guarantee of any future results, circumstances or outcomes.
The material contained herein is not necessarily complete and is also wholly insufficient to be exclusively relied upon as research or investment advice or as a sole basis for any financial decisions, including investment decisions or making any kind of consumer choices, without further consultation with Anglia Advisors or other qualified Registered Investment Advisor. The user assumes the entire risk of any decisions made or actions taken based in whole or in part on any of the information provided in this or any other Anglia Advisors published content.
Under no circumstances is any of Anglia Advisors’ content ever intended to constitute tax, legal or medical advice and should never be taken as such. Neither the information contained or any opinion expressed herein constitutes a solicitation for the purchase of any security or asset class. No client advice may be rendered by Anglia Advisors unless and until a properly-executed Client Engagement Agreement is in place.
Posts may contain links or references to third party websites or may post data or graphics from them for the convenience and interest of readers. While Anglia Advisors might have reason to believe in the quality of the content provided on these sites, the firm has no control over, and is not in any way responsible for, the accuracy of such content nor for the security or privacy protocols that external sites may or may not employ. By making use of such links, the user assumes, in its entirety, any kind of risk associated with accessing them or making use of any information provided therein.
Those associated with Anglia Advisors, including clients with managed or advised investments, may maintain positions in securities and/or asset classes mentioned in this post.

If you enjoyed this post, why not share it with someone or encourage them to subscribe themselves?


