


It’s less than two weeks since financial markets seemed to be teetering on a precipice. Japan had raised interest rates, a complex currency trade had broken down and a disheartening Jobs Report had come out in the U.S., sparking a chain reaction that triggered record-setting volatility levels and the worst stock market crash in decades in Asia which then cascaded around the world, cratering markets in Europe and the U.S., which suffered its worst one-day plunge since early in the COVID panic of 2020.
Many big-name analysts and economists were wetting their pants (yeah, I’m looking at you, Jeremy Siegel), hysterically squealing in the media for the Fed to make an unscheduled emergency interest rate cut to save the country from the horrors of the recession that was about to engulf us all. But markets began to gradually crawl back upward soon afterwards, mostly on the back of a lot of investor bargain-hunting and a growing sense that there had maybe been an over-reaction.
As last week wore on and we saw much more upbeat economic data, that crawl quickly became a high-speed dash, resulting in the best week of the year so far for stocks. The major indexes have now completely round-tripped, closing on Friday higher than they were when all this shit started.
Stocks wobbled between slight gains and losses on a tepid-volume summer Monday, ultimately going nowhere ahead of some important and high-stakes updates later in the week on inflation, retail sales and earnings from major retailers. Half an eye was also being kept on geopolitics, with Ukrainian troops swarming into Russian territory and ceasefire hopes in jeopardy on the back of a soaring body count in Gaza at the same time as a potential escalation in Iran/Israel tensions and American warships edging closer to the region.
Before the opening bell on Tuesday, we got a very Fed-friendly release of the Producer Price Index (PPI) measure of wholesale inflation experienced by manufacturers in July, underscoring the continued moderation in price pressures in the economy with the annualized rate falling to just +2.2%.
Wall Street took this as a hopeful sign for the next day’s CPI inflation number. There was a sea of green on the screen with stocks rocketing higher across the board as traders reloaded their bets on an extension of the rally after the previous week’s mauling. Tech names enjoyed a particularly buoyant session.
The inflation genie appears to be finally back in the bottle and an interest rate cut next month was as good as sealed on Wednesday morning pre-market when the Consumer Price Index (CPI) measure of retail inflation came out in line with expectations, falling to a +2.9% annualized rate, a fourth consecutive monthly decline and down from a peak of over 9% in June 2022 and below the 3% level for the first time since March 2021. This kept the possibility of a “jumbo” interest rate cut of 0.50% on the table, although a reduction of 0.25% on September 18th remains the base case.
Investor reaction to CPI was a little muted with most of the enthusiasm having already been priced in by Tuesday’s monster rally but the indexes still managed to eke out some small gains by the close in what was another light-volume session.
It was a busy pre-market morning on Thursday with lower-than-expected weekly initial jobless claims, a spectacularly impressive Walmart earnings report with very cheerful forward guidance and a gigantic acceleration in Retail Sales which rose +1.0% in July after a -0.2% decline the prior month for its biggest climb since early 2023 even in the face of high prices and borrowing costs. This pointed to a resilient American consumer and a still-solid economy that's two-thirds measured by consumer spending.
In this renewed “good news is finally good news again” environment, stocks were turbo-charged higher at the open and stayed elevated throughout the session, with tech stocks and Small Caps distinctly outperforming. The major indexes completed a full recovery of all of the losses suffered during the shaky period that began with that big drop on August 1st.
Some of the air was let out of the balloon on Friday morning by some disappointing U.S. housing data which showed that new home construction fell in July to its lowest level since May 2020 along with a decline in building permits as homebuilders responded to weak demand. We also got to see the monthly Consumer Sentiment index which showed Americans are feeling a little better than expected about the economy and the prospects for inflation. Stocks shifted moderately higher and once again held onto those gains - bringing a very cheerful week to a close.
The odds of a soft landing are still considerably greater than those of a hard landing, but there’s no doubt that the gap between the two probability sets is closing. Stocks have proved to be impressively resilient as we saw last week, but the economic risks facing this market are non-trivial and potentially consequential should they come to pass (like, end-of-the-bull market consequential).
Think of your team having a 4-0 lead at half-time in a soccer game, but then early in the second half the opponent scores two quick goals. It’s still far more likely than not that your team will go on to win the game, it’s just less likely than it was at half-time.
OTHER NEWS ..
Unruly .. Only Turkey and Russia are at more risk than the U.S. among the world’s largest economies of political civil unrest and deadly violence (an extreme version of which was depicted in the intense recent movie Civil War) in the next year, according to a Bloomberg Economics analysis in conjunction with the U.S. government’s Political Instability Task Force.
While the probability of such violent internal conflict in this country is low, put at just 2.9%, it is more than double that of nations such as Canada, Germany and Australia that are often considered to be America’s democratic peers.
The analysis seeks to apply a quantitative lens to trends that have provoked fears of such unrest in the years since the January 6th 2021 insurrection and deadly attack on the Capitol building.
You Can Bet Your Future On It .. As sports gambling takes off in the U.S., turning quickly into a multi-billion dollar business, a worrisome trend is starting to emerge: Americans appear to be yanking money out of their investment accounts to fund their online betting habit.
This is the key finding laid out in a recent working paper titled Gambling Away Stability: Sports Betting’s Impact on Vulnerable Households. It claims to find evidence that for every $1 spent on sports gambling – now legalized in most states since 2018 — net investments in stocks and other financial instruments dropped by just over $2.
The phenomenon is most noticeable among the most financially-strained households, potentially the same ones attracted to nonsense and dangerous get-rich-quick schemes in financial markets like meme stocks and speculative options including crypto scams, frequently promoted on social media.
What Happened When The COVID $$$ Went Away? .. Consumers fell behind on debt payments as pandemic-era wealth disappeared, leaving some households in dire financial shape as the economy slows. That's the takeaway from a new study by economists at the San Francisco Federal Reserve that shows how wealth built up during the pandemic helped support consumer spending in the face of high interest rates and inflation.
Now that "extra" wealth is gone, the opposite is the case: Spending is cooling, and many consumers have a much smaller cushion to fall back on if the economy were to enter a recession. At the peak in 2021, the top 20% of households by income accumulated $1 trillion more in liquid wealth than would have been the case absent the pandemic. The bottom 80% built up an additional $270 billion in liquid holdings.
Economists estimate that the 80% saw this extra wealth fully drained by late 2021. But it didn't dry up for the 20% until over a year later. The fact that it lasted longer was likely helped by the fact that, instead of having to spend it, they plowed the money into interest-bearing assets at the same time as rates were moving higher.
As of the beginning of 2024, liquid wealth for the rich was 2% lower than its pre-pandemic path would have indicated. The bottom 80% have roughly 13% less. As these funds depleted and then disappeared, household debt rose, as did instances of missed credit card payments. Smaller financial cushions and heightened credit stress for households in the bottom 80% all pose a risk to future consumers’ ability to withstand a recession if/when one ever arrives, potentially damaging sales and earnings of major corporations.
ARTICLE OF THE WEEK ..
Time to debunk some myths about couples, marriage and credit scores.
THIS WEEK’S UPCOMING CALENDAR ..
The Federal Reserve's annual Jackson Hole conference will be this week's highlight, including a highly anticipated speech by Jerome Powell on Friday morning. The Fed chair is widely expected to lay the groundwork for a interest-rate cut to be announced after its next meeting on September 18th. On Wednesday, the central bank will also release the minutes from its July meeting.
There are a few more earnings reports this week including those from Target, Lowe’s, Intuit, Dollar Tree, Palo Alto Networks, TJX and Estee Lauder.
LAST WEEK BY THE NUMBERS ..
Last week’s market color courtesy of finviz.com
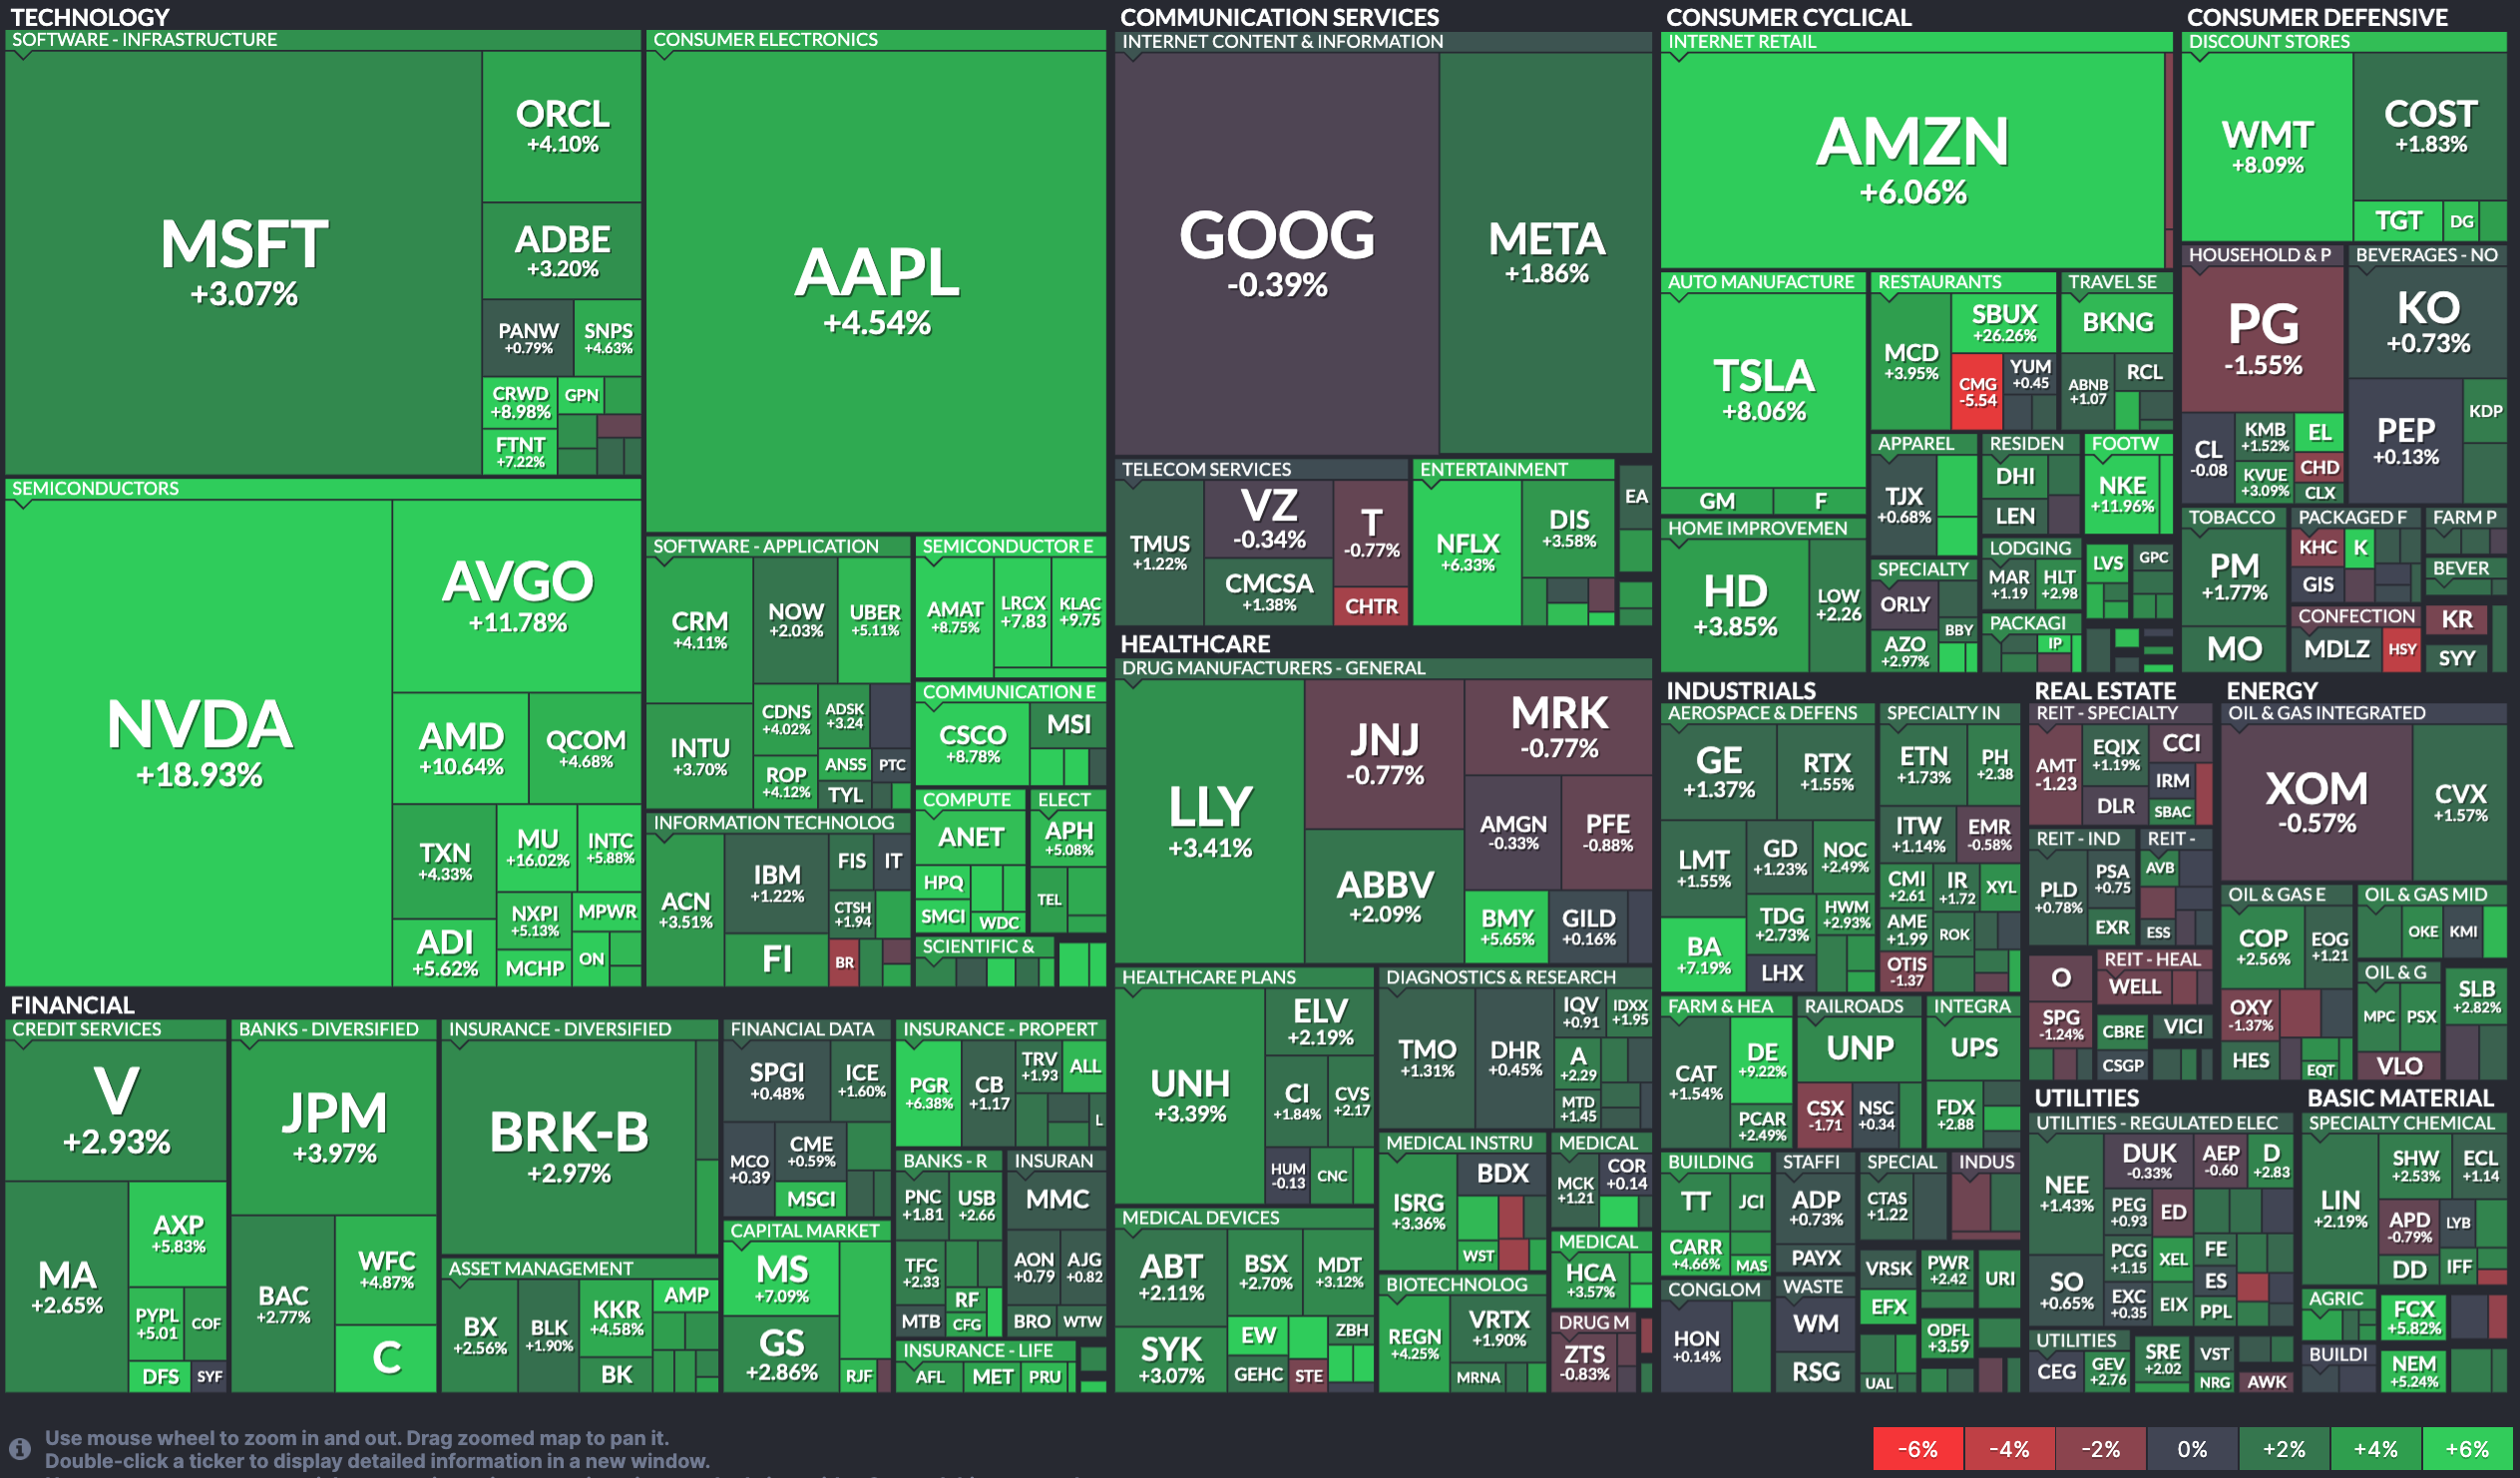
Last week’s best performing U.S. sector: Technology (two biggest holdings: Microsoft, Nvidia) - up 7.6% for the week.
Last week’s worst performing U.S. sector: Real Estate (two biggest holdings: Prologis, American Tower Corp) - up 0.2% for the week.
SPY, the S&P 500 Large Cap ETF, tracks the S&P 500 index, made up of 500 stocks from among the largest U.S. companies. Its price rose 3.9% last week, is up 16.6% so far this year and ended the week 1.9% below its all-time record closing high (07/16/2024).
IWM, the Russell 2000 Small Cap ETF, tracks the Russell 2000 index, made up of the bottom two-thirds in terms of company size of a group made up from among 3,000 largest U.S. stocks. Its price rose 2.9% last week, is up 5.9% so far this year and ended the week 12.4% below its all-time record closing high (11/08/2021).
AVERAGE 30-YEAR FIXED MORTGAGE RATE ..
6.49%
One week ago: 6.47%, one month ago: 6.81%, one year ago: 7.09%
Data courtesy of: FRED Economic Data, St. Louis Fed as of last Thursday.
FEAR & GREED INDEX ..
“Be fearful when others are greedy and be greedy when others are fearful.” Warren Buffet.

The Fear & Greed Index from CNN Business can be used as an attempt to gauge whether or not stocks are fairly priced and to determine the mood of the market. It is a compilation of seven of the most important indicators that measure different aspects of stock market behavior. They are: market momentum, stock price strength, stock price breadth, put and call option ratio, junk bond demand, market volatility and safe haven demand.
Extreme Fear readings can lead to potential opportunities as investors may have driven prices “too low” from a possibly excessive risk-off negative sentiment.
Extreme Greed readings can be associated with possibly too-frothy prices and a sense of “FOMO” with investors chasing rallies in an excessively risk-on environment . This overcrowded positioning leaves the market potentially vulnerable to a sharp downward reversal at some point.
A “sweet spot” is considered to be in the lower-to-mid “Greed” zone.
Data courtesy of CNN Business as of Friday’s market close.
FEDWATCH INTEREST RATE TOOL ..
Will interest rates be lower than they are now after the Fed’s next meeting on September 18th?
Yes .. 100% probability (100% a week ago)
No .. 0% probability (0% a week ago)
Where is the Fed Funds interest rate most likely to be at the end of 2024?
4.375% (1.00% lower than where we are now, implying four 0.25% rate cuts before the end of 2024)
One week ago: 4.375% (implying four rate cuts), one month ago: 4.625% (implying three rate cuts)
All data based on the Fed Funds rate (currently 5.375%). Calculated from Federal Funds futures prices as of the market close on Friday. Data courtesy of CME FedWatch Tool.
% OF S&P 500 STOCKS TRADING ABOVE THEIR 50-DAY MOVING AVERAGE:
68% (341 of the S&P 500 stocks ended last week above their 50D MA and 159 were below)
One week ago: 58%, one month ago: 76%, one year ago: 40%
% OF S&P 500 STOCKS TRADING ABOVE THEIR 200-DAY MOVING AVERAGE:
72% (358 of the S&P 500 stocks ended last week above their 200D MA and 142 were below)
One week ago: 66%, one month ago: 78%, one year ago: 53%
Closely-watched measures of market breadth and participation, providing a real-time look at how many of the S&P 500 index stocks are trending higher or lower, as defined by whether the stock price is above or below their more sensitive 50-day (short term) and less sensitive 200-day (long term) moving averages which are among the most widely-followed of all stock market technical indicators.
The higher the reading, the better the deemed health of the overall market trend, with 50% considered to be a key pivot point. Readings above 90% or below 15% are extremely rare.
WEEKLY US INVESTOR SENTIMENT (outlook for the upcoming 6 months) ..
↑Bullish: 42% (41% a week ago)
⬌ Neutral: 29% (22% a week ago)
↓Bearish: 29% (37% a week ago)
Net Bull-Bear spread: ↑Bullish by 13 (Bullish by 4 a week ago)
For context: Long term averages: Bullish: 38% — Neutral: 32% — Bearish: 30% — Net Bull-Bear spread: Bullish by 8
Survey participants are typically polled during the first half of the week.
Data courtesy of: American Association of Individual Investors (AAII).
WWW.ANGLIAADVISORS.COM | SIMON@ANGLIAADVISORS.COM | CALL OR TEXT: (646) 286 0290 | FOLLOW ANGLIA ADVISORS ON INSTAGRAM
This material represents a highly opinionated assessment of the financial market environment based on assumptions and prevailing information and data at a specific point in time and is always subject to change at any time. Although the content is believed to be correct at the time of publication, no warranty of its accuracy or completeness is given. It is never to be interpreted as an attempt to forecast any future events, nor does it offer any kind of guarantee of any future results, circumstances or outcomes.
The material contained herein is not necessarily complete and is wholly insufficient to be exclusively relied upon as research or investment advice or as a sole basis for any investment or other financial decisions. The user assumes the entire risk of any decisions made or actions taken based in whole or in part on any of the information provided in this or any Anglia Advisors communication of any kind. Under no circumstances is any of Anglia Advisors’ content ever intended to constitute tax, legal or medical advice and should never be taken as such. Neither the information contained or any opinion expressed herein constitutes a solicitation for the purchase of any security or asset class. No advice may be rendered by Anglia Advisors unless or until an executed Client Engagement Agreement is in place.
Posts may contain links or references to third party websites or may post data or graphics from them for the convenience and interest of readers. While Anglia Advisors might have reason to believe in the quality of the content provided on these sites, the firm has no control over, and is not in any way responsible for, the accuracy of such content nor for the security or privacy protocols that external sites may or may not employ. By making use of such links, the user assumes, in its entirety, any kind of risk associated with accessing them or making use of any information provided therein.
Those associated with Anglia Advisors, including clients with managed or advised investments, may maintain positions in securities and/or asset classes mentioned in this post.

If you enjoyed this post, why not share it with someone or encourage them to subscribe themselves?


