


Ahead of a big week of earnings reports including a first look at some Big Tech, it was a relatively quiet weekend on the newswires although reports did emerge that the European Union may not necessarily be willing to roll over and have its tummy tickled by the United States, supposedly preparing meaningful retaliatory trade measures in advance of tariff impositions on August 1st.
Stocks opened cautiously higher on Monday morning helped by encouraging Q2 numbers from Verizon, but the indexes flattened out as the session wore on after the non-partisan Congressional Budget Office confirmed that the recently-passed tax and spending bill will indeed add $3.4 trillion to US deficits over the next decade and leave millions of Americans without medical coverage. Tiny gains by the closing bell were still enough however to squeak out new all-time highs yet again, with the S&P 500 closing above 6300 for the first time.
Pre-market Q2 reports on Tuesday were mixed. Coca-Cola handily beat estimates but General Motors confirmed that it sees close to a five billion dollar hit to earnings (almost a third of its annual profits) in the upcoming year due to likely enforced tariff cost absorption. The stock indexes continued to hover nervily around their record levels ahead of the first set of Big Tech earnings the following day.
A broad cooling of market tensions overnight sent stock prices solidly higher and deeper into record territory in New York on Wednesday following vigorous sessions in Asia and Europe.
The announcement of a trade deal with Japan, a burst of optimism about progress in US/EU trade talks and “good cop” Treasury Secretary Bessent throwing cold water on the idea of an early dismissal of Fed chairman Powell (described by “bad cop” Trump earlier in the week as “either evil or stupid”) all served to lower the perceived risk temperature.
Alphabet/Google shares had previously experienced a record-breaking ten day winning streak in the lead-up to the day of the company’s after-market earnings report which helped carry the stock price up by over 14% in just the last three weeks. So traders had set a very high bar on pushing that price any further upwards on the back of Q2 earnings. The company however passed with flying colors, blowing through estimates on revenue and earnings with a boosted rate of largely AI-related capital expenditure.
Things are not so rosy over at Tesla. Quarterly revenues suffered their largest decline in a decade on the back of a massive slump in worldwide vehicle sales and earnings fell short of expectations. In a poorly-received, somewhat incoherent conference call with analysts, Musk warned of more pain to come in upcoming quarters. IBM and Texas Instruments also badly disappointed.
Obviously, Wall Street traders butchered Tesla, IBM and Texas Instruments for their disastrous numbers after the opening bell on Thursday but Google is now clearly sitting at the cool kids’ table with Meta, Nvidia and Microsoft.
Markets decided that, on balance, Wednesday’s developments were just about a net positive, particularly the growing sense that the Japan trade deal may end up being some kind of a framework for a similar EU one that might be put in place before August 1st. Stock indexes closed a little higher, tuning out Trump’s cringe-worthy failed attempt to show up Powell when they met at the Fed HQ.
It was another relatively low-key summer Friday, but despite a downside earnings surprise from Intel resulting in its stock price getting slaughtered, the indexes continued their seemingly endless rally, scoring a fifth consecutive day of new record highs for the S&P 500 which is now closing in on 6400.
An entire week with a new record closing high in stocks every single day? And in the run-up to the busiest week of Q2 earnings and both a tariff deadline and a Fed interest rate-setting meeting next week? Crazy, right? Maybe not.
Q2 earnings so far have been largely positive, economic data has been hanging in there including stable inflation and a solid labor market, traders are starting to get some sense of clarity on tariffs, TACO is still very much alive and well and many of the Wall Street’s key concerns have so far failed to materialize. Small retail investors are diving back in, buying any dips and even triggering a renewed bout of meme stock madness (this time around, think: Kohls, Krispy Kreme, GoPro and Beyond Meat and other heavily-shorted names).
This rally could easily run and run (see .. AND I QUOTE .. below). At some point though (no-one knows when), it will come to an end and we could potentially experience a nasty trap-door of a quick 10%, 20% or more plunge in stock prices as the market corrects a possible short term over-shoot. Long term investors and certainly anyone under the age of 45 investing for retirement need to be ready for this decline.
When I say ready, I mean ready to sit on their hands and do nothing other than keep systematically buying diversified broad market ETFs and maybe buy a bit more if they can afford to do so once stock prices have fallen sharply lower.
If you are not yet a client of Anglia Advisors and would like to explore becoming one, please feel free to reach out to arrange a complimentary no-obligation discovery call with me.
ARTICLE OF THE WEEK ..
The effects of tariffs are here already, whether you have noticed them yet or not.
.. AND I QUOTE ..
“Bubbles last until they don’t.”
Rob Arnott, founder and chairman of Research Affiliates
LAST WEEK BY THE NUMBERS:
Last week’s market color courtesy of finviz.com
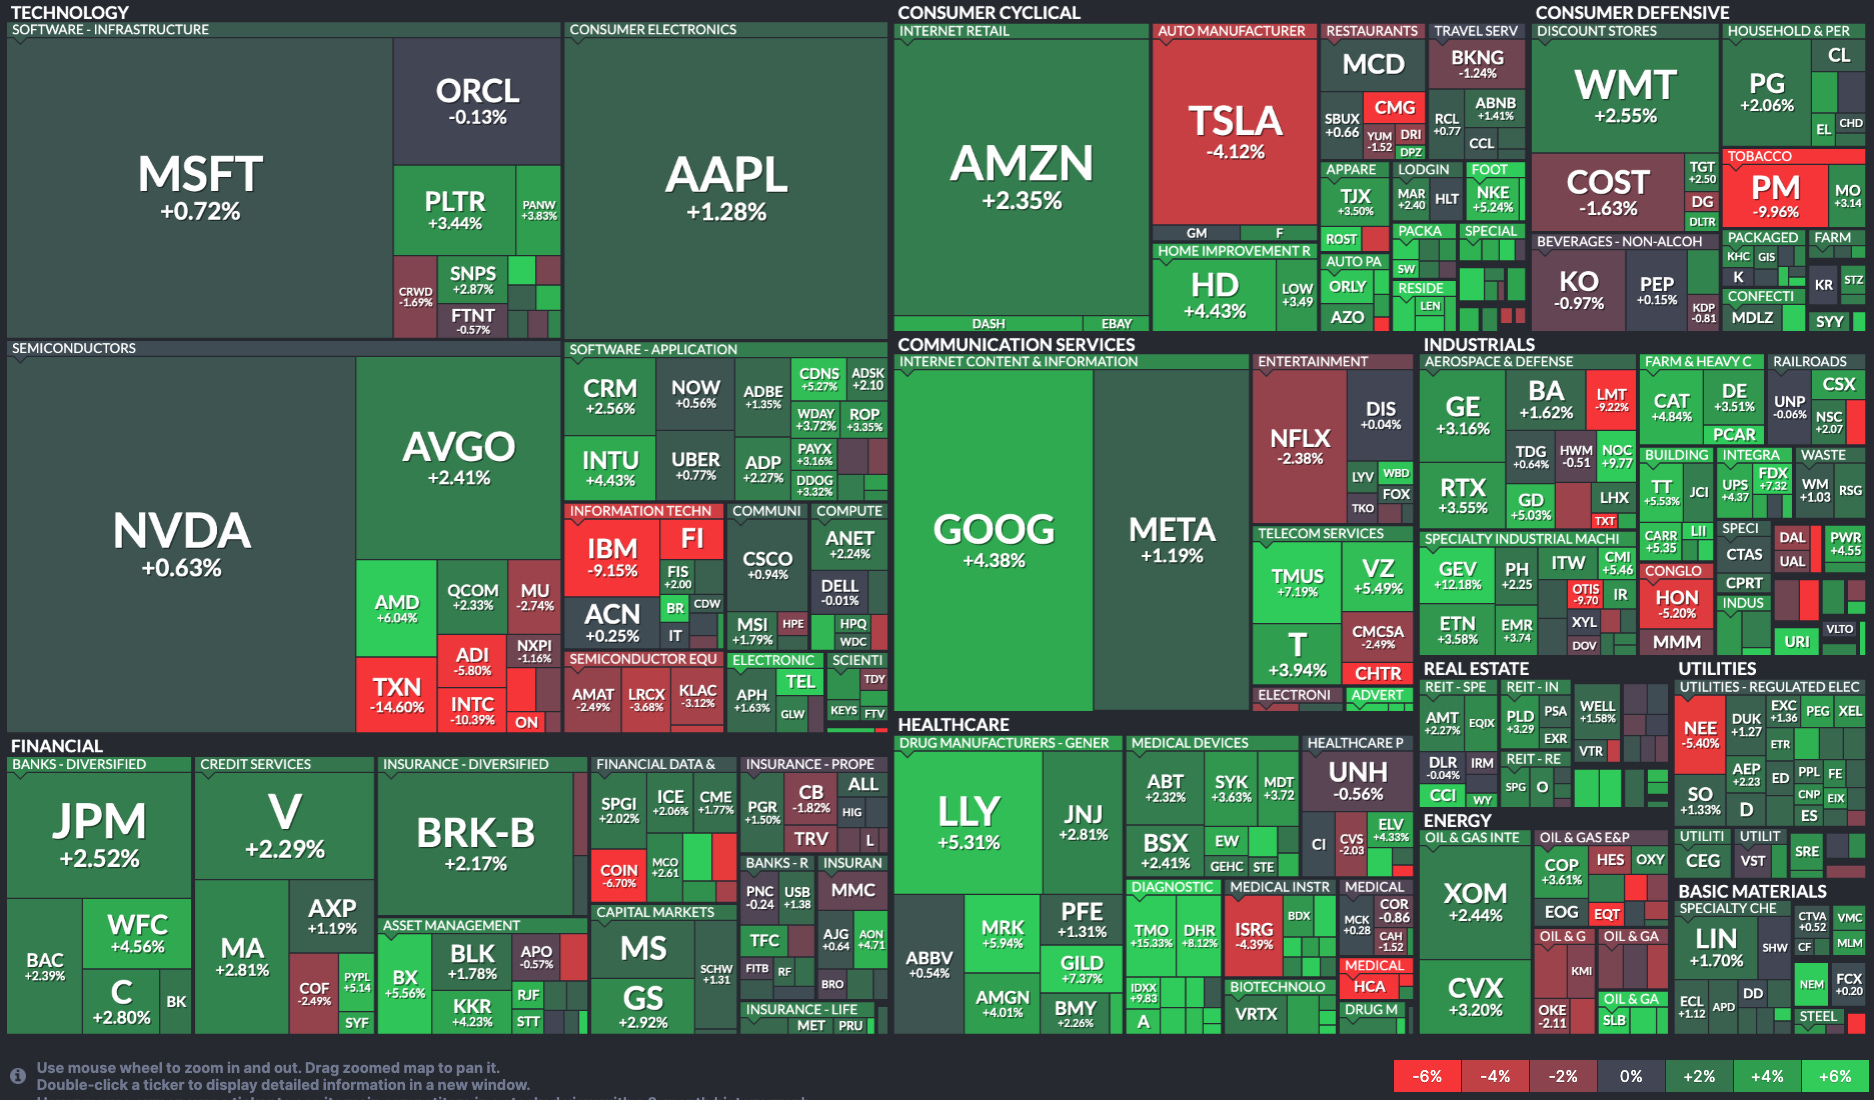
Last week’s best performing US sector: Real Estate (two biggest holdings: American Tower, Prologis) ⬆︎ 2.6% for the week
Last week’s worst performing US sector: Technology (two biggest holdings: Nvidia, Microsoft) ⬆︎ 0.1% for the week
SPY, a US Large Cap ETF, tracks the S&P 500 index, made up of 500 stocks from a universe of the largest US companies. Its price rose 1.0% last week, is up 8.3% so far this year and ended the week at its all-time record closing high.
IWM, a US Small Cap ETF, tracks the Russell 2000 index, made up of the bottom two-thirds in terms of company size of a universe of 3,000 of the largest US stocks. Its price fell 0.1% last week, is up 1.1% so far this year and ended the week 8.8% below its all-time record closing high (11/08/2021).
VXUS, a Global Non-US ETF, tracks the MSCI ACWI Ex-US index, made up of over 8,500 of the largest names from a universe of stocks issued by companies from around the world excluding the United States, in both developed and emerging markets. Its price rose 1.9% last week, is up 19.8% so far this year and ended the week 0.7% below its all-time record closing high (07/23/2025).
INTEREST RATES:
FED FUNDS * ⬌ 4.33% (unchanged)
PRIME RATE ** ⬌ 7.50% (unchanged)
3 MONTH TREASURY ⬆︎ 4.42% (4.40% a week ago)
2 YEAR TREASURY ⬆︎ 3.91% (3.88% a week ago)
5 YEAR TREASURY ⬇︎ 3.95% (3.96% a week ago)
10 YEAR TREASURY *** ⬇︎ 4.40% (4.44% a week ago)
20 YEAR TREASURY ⬇︎ 4.92% (4.99% a week ago)
30 YEAR TREASURY ⬇︎ 4.92% (5.00% a week ago)
Data courtesy of the Federal Reserve and the Department of the Treasury as of the market close on Friday.
* Decided upon by the Federal Reserve Open Market Committee. Used as a basis for overnight interbank loans and for determining high yield savings rates.
** Wall Street Journal Prime rate. Used as a basis for determining many consumer loan rates such as credit cards, personal loans, home equity loans/lines of credit, securities-based lending and auto loans.
*** Used as a basis for determining mortgage rates.
AVERAGE 30-YEAR FIXED MORTGAGE RATE:
⬇︎ 6.74%
One week ago: 6.75%, one month ago: 6.78%, one year ago: 6.78%
Data courtesy of: Freddie Mac Primary Mortgage Market Survey
INTEREST RATE EXPECTATIONS:
Where will the Fed Funds interest rate be after the next rate-setting meeting on July 30th?
Unchanged from now .. ⬆︎ 97% probability (95% a week ago)
0.25% lower than now .. ⬇︎ 3% probability (5% a week ago)
What is the most commonly-expected number of remaining 0.25% Fed Funds interest rate cuts in 2025?
⬌2 (unchanged from a week ago)
All data based on the Fed Funds interest rate (currently 4.33%). Calculated from Federal Funds futures prices as of the market close on Friday. Data courtesy of CME FedWatch Tool.
FEAR & GREED INDEX:
“Be fearful when others are greedy and be greedy when others are fearful.” Warren Buffet.
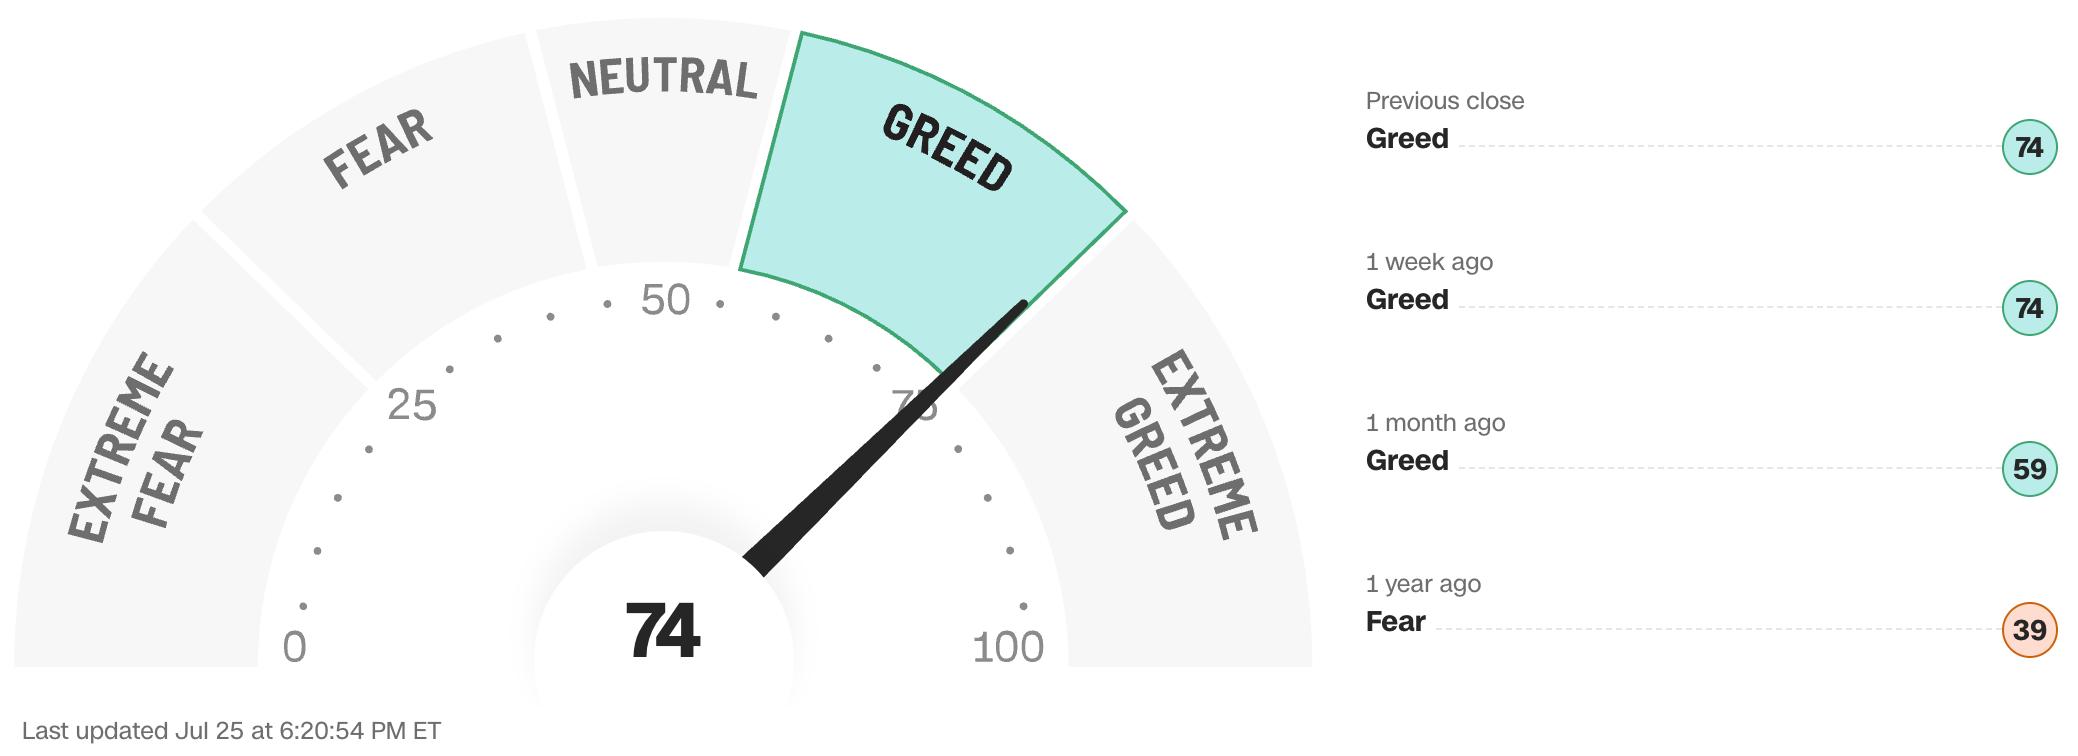
The Fear & Greed Index from CNN Business can be used as an attempt to gauge whether or not stocks are fairly priced and to determine the mood of the market. It is a compilation of seven of the most important indicators that measure different aspects of stock market behavior. They are: market momentum, stock price strength, stock price breadth, put and call option ratio, junk bond demand, market volatility and safe haven demand.
Extreme Fear readings can lead to potential opportunities as investors may have driven prices “too low” from a possibly excessive risk-off negative sentiment.
Extreme Greed readings can be associated with possibly too-frothy prices and a sense of “FOMO” with investors chasing rallies in an excessively risk-on environment . This overcrowded positioning leaves the market potentially vulnerable to a sharp downward reversal at some point.
A “sweet spot” is considered to be in the lower-to-mid “Greed” zone.
Data courtesy of CNN Business as of Friday’s market close.
Note: Anglia Advisors has updated its Privacy Policy. You can view the latest version here.
WWW.ANGLIAADVISORS.COM | SIMON@ANGLIAADVISORS.COM | CALL OR TEXT: (646) 286 0290 | FOLLOW ANGLIA ADVISORS ON INSTAGRAM
This material represents a highly opinionated, speculative assessment of the financial market environment based on assumptions and prevailing information and data at a specific point in time and is always subject to change at any time. Although the content is believed to be correct at the time of publication, no warranty of its accuracy or completeness is ever given. It is never to be interpreted as an attempt to forecast any future events, nor does it offer any kind of guarantee whatsoever of future results, circumstances or outcomes.
The material contained herein is not necessarily complete and is also wholly insufficient to be relied upon as research or investment advice or as a sole basis for any financial determinations, including investment decisions or making any kind of consumer choices, without further consultation with Anglia Advisors or other fully-qualified Registered Investment Advisor. The user assumes the entire risk of any decisions made or actions taken based in whole or in part on any of the information provided in this or any other Anglia Advisors published content.
Under no circumstances is any Anglia Advisors’ content ever intended to constitute tax, legal or medical advice and should never be taken as such. Neither the information contained nor any opinion expressed herein constitutes a solicitation for the purchase of any security or asset class. No formal client advice may be rendered by Anglia Advisors unless and until a properly-executed client engagement agreement is in place.
Posts may contain links or references to third party websites or may post data or graphics from them for the convenience and interest of readers. While Anglia Advisors might have reason to believe in the quality of the content provided on these sites, the firm has no control over, and is not in any way responsible for, the accuracy of such content nor for the security or privacy protocols that external sites may or may not employ. By making use of such links, the user assumes, in its entirety, any kind of risk associated with accessing them or making use of any information provided therein.
Those associated with Anglia Advisors, including clients with managed or advised investments, may maintain positions in securities and/or asset classes mentioned in this post.
If you enjoyed this post, why not share it with someone?


