


Clarity around Ukraine failed to emerge over the weekend despite the US administration pumping out happy-clappy PR spin ahead of Trump’s meeting with Zelensky and the Europeans. The Federal Reserve began gathering in Jackson Hole for its annual boondoggle which always culminates in a closely-watched speech from the chairman. Earnings focus was set to switch to the major retailers.
So Wall Street was mostly in wait-and-see mode when the opening bell rang on Monday. Markets are trading as if a 0.25% rate cut in the Federal Funds Rate on September 17th was already in the bag (see INTEREST RATE EXPECTATIONS and ARTICLE OF THE WEEK below) to the extent that a severe market disruption can be expected if it doesn’t happen.
A nonsense Trump/Zelensky news conference in the early afternoon shed no new light on anything except perhaps golf and voting machines and the indexes meandered around aimlessly on light volume to finish a touch lower.
Stocks wavered at the open on Tuesday after Home Depot issued a mixed earnings report showing that consumers are deferring big ticket purchases and there was a widening of US sector-specific tariffs to include more consumer goods like auto parts, motorcycles, furniture and baby gear.
The slump in the indexes accelerated rapidly and they closed near the lows of the day, predominantly dragged down by a profit-taking-generated rout in tech heavyweights in general and a horror show of a session for Nvidia (which alone counts for ~8% of the weighting of the S&P 500), Palantir and Oracle in particular. A massive record-breaking run-up like we have recently seen in these stocks will always put shareholders at risk of sudden plunges like this, particularly in the kind of low volume trading conditions currently being experienced.
Tuesday’s hefty tech wobble spilled over into Wednesday and a shaky earnings report and outlook from Target didn’t help. Trump’s relentless campaign to undermine and banish existing central bank officials and replace them with his own hand-picked glove puppets intensified as he turned his ire on Fed Governor Lisa Cook. The indexes dumped early on with dip buyers notably absent until the last hour or so of trading, eventually limiting the damage to relatively light losses for the session. Interest rates shifted higher.
For the first time in three years, Walmart missed expectations in its quarterly earnings report on Thursday morning and pointed to a bleak tariff-infested landscape going forward. The comparatively small drop up to this point in the indexes from their recent highs has masked fairly steep declines in some of the hottest high momentum names. This phenomenon persisted throughout the session and the outcome was a fifth straight day in the red for stocks, the longest such losing streak since January and interest rates continued to drift slowly north.
The week’s main event was Jerome Powell’s speech at 10am ET on Friday to close out the Jackson Hole Economic Policy Symposium, with stock and bond markets laser-focused on his perspective on upcoming Fed rate cuts (see ARTICLE OF THE WEEK below). He proceeded to fling the door wide open to a cut next month by stating that a "shifting balance of risks .." between the potentially contradictory prospects for inflation and those of economic growth “.. may warrant policy adjustment”.
In response, an elated stock market exploded higher and shorter term interest rates tumbled as did the value of the US Dollar. More rocket fuel was added by the decision of Canada to withdraw its retaliatory tariffs against the US. The indexes erased their losses from the five-day losing run and spiraled upwards to close the week on the brink of yet more new all-time record highs.
Despite Friday’s charge higher, last week highlighted some legitimate concerns about the fact that just 2% of the S&P 500 index’s holdings account for 40% of the index’s total market capitalization value.
This bull market is now more dependent than ever on the continuation of the rally-supporting AI story and the risk of more frequent sudden air pockets like we saw on Tuesday is becoming greater and greater as stock prices perhaps begin to run out of room on the upside in the short term.
And let’s not forget that between now and the next Federal Funds Rate decision day on September 17th, there are two massive data releases that could still possibly derail the narrative of an inevitable rate cut; a Jobs Report on September 5th and a CPI inflation reading on September 11th.
I would still be very, very surprised if there were no rate cut next month, but it’s not yet a total slam dunk (see INTEREST RATE EXPECTATIONS below).
If you are not yet a client of Anglia Advisors and would like to explore becoming one, please feel free to reach out to arrange a complimentary no-obligation discovery call with me.
ARTICLE OF THE WEEK ..
What does this whole Fed rate cut business mean anyway? Why does the stock market care so much?
.. AND I QUOTE ..
“Most financial mistakes come when you try to force things to happen faster than is required. Compounding doesn’t like it when you try to use a cheat code.”
Morgan Housel, author and partner at Collaborative Fund
LAST WEEK BY THE NUMBERS:
Last week’s market color courtesy of finviz.com
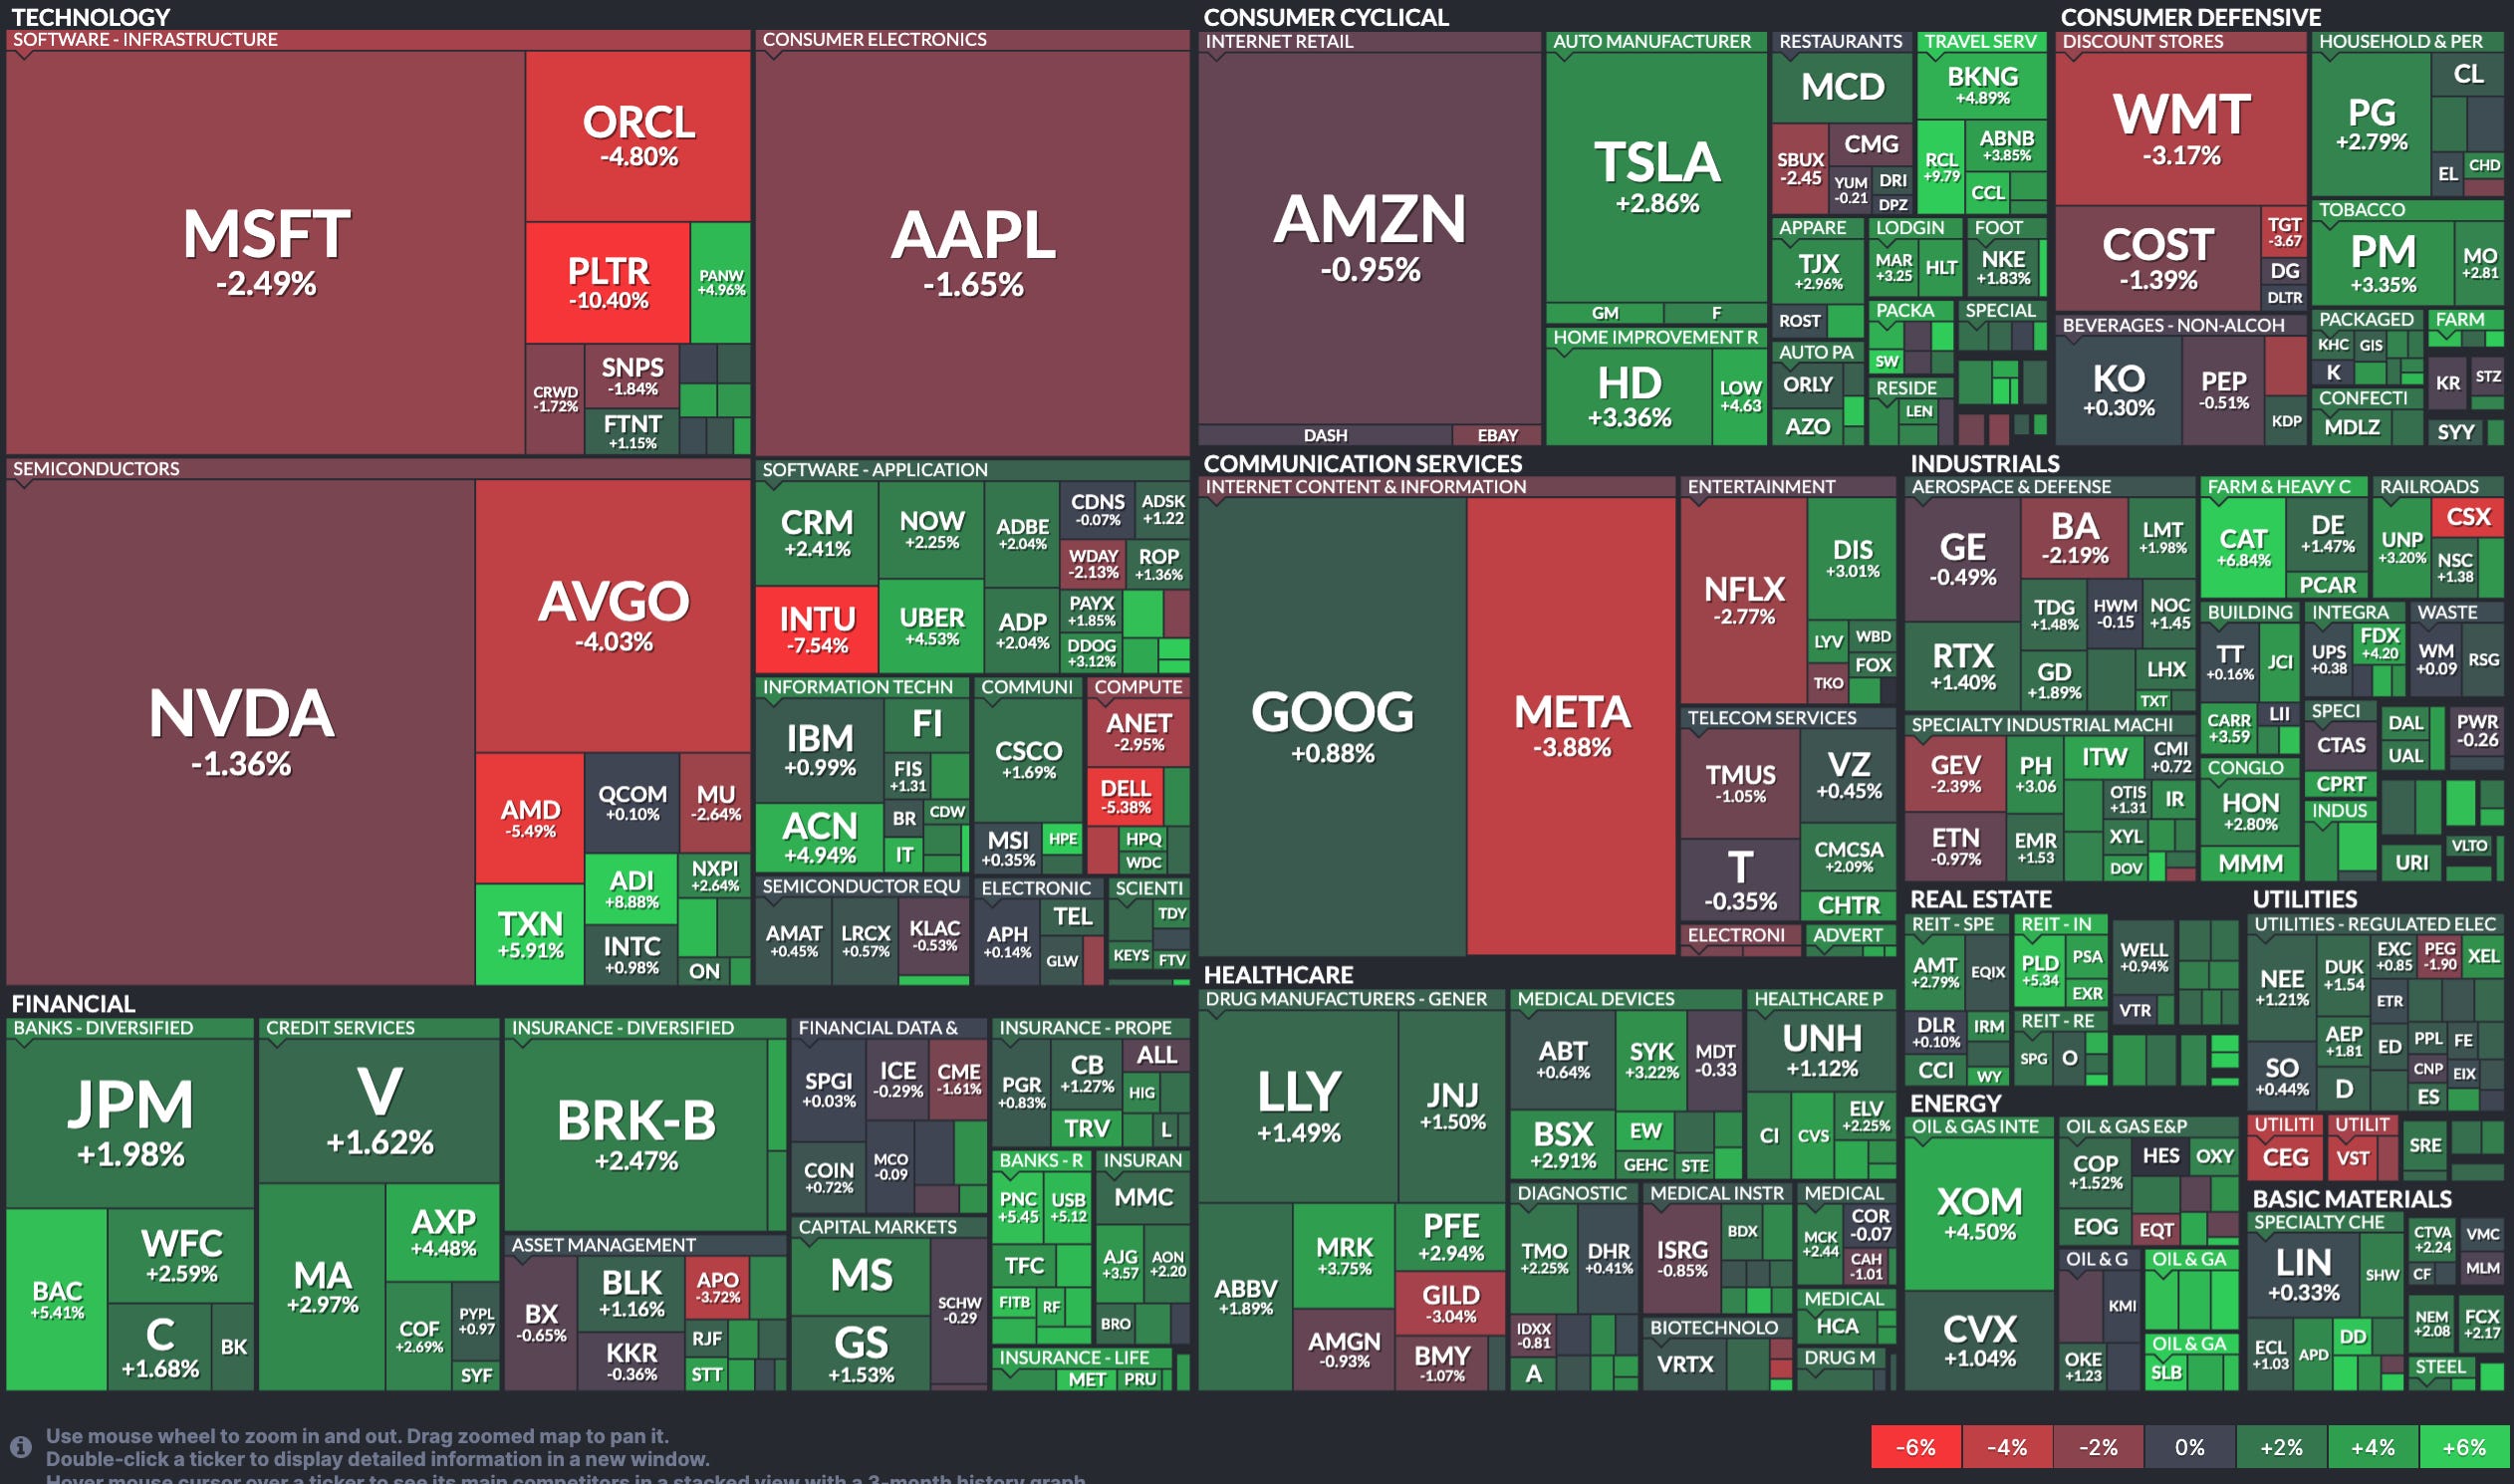
Last week’s best performing US sector: Energy (two biggest holdings: Exxon Mobil, Chevron) ⬆︎ 3.0% for the week
Last week’s worst performing US sector: Technology (two biggest holdings: Nvidia, Microsoft) ⬇︎ 1.2% for the week
SPY, a US Large Cap ETF, tracks the S&P 500 index, made up of 500 stocks from a universe of the largest US companies. Its price rose 0.3% last week, is up 10.1% so far this year and ended the week 0.2% below its all-time record closing high (08/14/2025).
IWM, a US Small Cap ETF, tracks the Russell 2000 index, made up of the bottom two-thirds in terms of company size of a universe of 3,000 of the largest US stocks. Its price rose 3.4% last week, is up 6.3% so far this year and ended the week 4.1% below its all-time record closing high (11/08/2021).
VXUS, a Global Non-US ETF, tracks the MSCI ACWI Ex-US index, made up of over 8,500 of the largest names from a universe of stocks issued by companies from around the world excluding the United States, in both developed and emerging markets. Its price rose 1.3% last week, is up 22.8% so far this year and ended the week at its all-time record closing high.
INTEREST RATES:
FED FUNDS * ⬌ 4.33% (unchanged)
PRIME RATE ** ⬌ 7.50% (unchanged)
3 MONTH TREASURY ⬇︎ 4.27% (4.30% a week ago)
2 YEAR TREASURY ⬇︎ 3.68% (3.74% a week ago)
5 YEAR TREASURY ⬇︎ 3.76% (3.82% a week ago)
10 YEAR TREASURY *** ⬇︎ 4.26% (4.29% a week ago)
20 YEAR TREASURY ⬇︎ 4.84% (4.86% a week ago)
30 YEAR TREASURY ⬌ 4.88% (4.88% a week ago)
Data courtesy of the Federal Reserve and the Department of the Treasury as of the market close on Friday
* Decided upon by the Federal Reserve Open Market Committee. Used as a basis for overnight interbank loans and for determining high yield savings interest rates
** Wall Street Journal Prime rate. Used as a basis for determining many consumer loan interest rates such as credit cards, personal loans, home equity loans/lines of credit, securities-based lending and auto loans
*** Used as a basis for determining mortgage interest rates
AVERAGE 30-YEAR FIXED MORTGAGE RATE:
⬌ 6.58%
One week ago: 6.58%, one month ago: 6.74%, one year ago: 6.46%
Data courtesy of Freddie Mac Primary Mortgage Market Survey
INTEREST RATE EXPECTATIONS:
Where will the Fed Funds interest rate be after the next rate-setting meeting on September 17th?
Unchanged from now .. ⬆︎ 16% probability (15% a week ago)
0.25% lower than now .. ⬇︎ 84% probability (85% a week ago)
With three more rate-setting meetings left in 2025, what is the most commonly-expected number of remaining 0.25% Fed Funds interest rate cuts this year?
⬌ Two (unchanged from a week ago)
Data courtesy of CME FedWatch Tool
All data based on the Fed Funds interest rate (currently 4.33%). Calculated from Federal Funds futures prices as of the market close on Friday.
PERCENT OF S&P 500 STOCKS ABOVE THEIR 200-DAY MOVING AVERAGE:
⬆︎ 68%
One week ago: 60%, one month ago: 58%, one year ago: 74%
Data courtesy of MacroMicro as of Friday’s market close
This widely-used technical measure of market breadth is considered to be an indicator of the overall health of the S&P 500 index. A high percentage (above 70%) generally suggests broad market strength and a bullish trend, while a low percentage (below 30%) may indicate market weakness and a bearish trend.
FEAR & GREED INDEX:
“Be fearful when others are greedy and be greedy when others are fearful.” Warren Buffet.
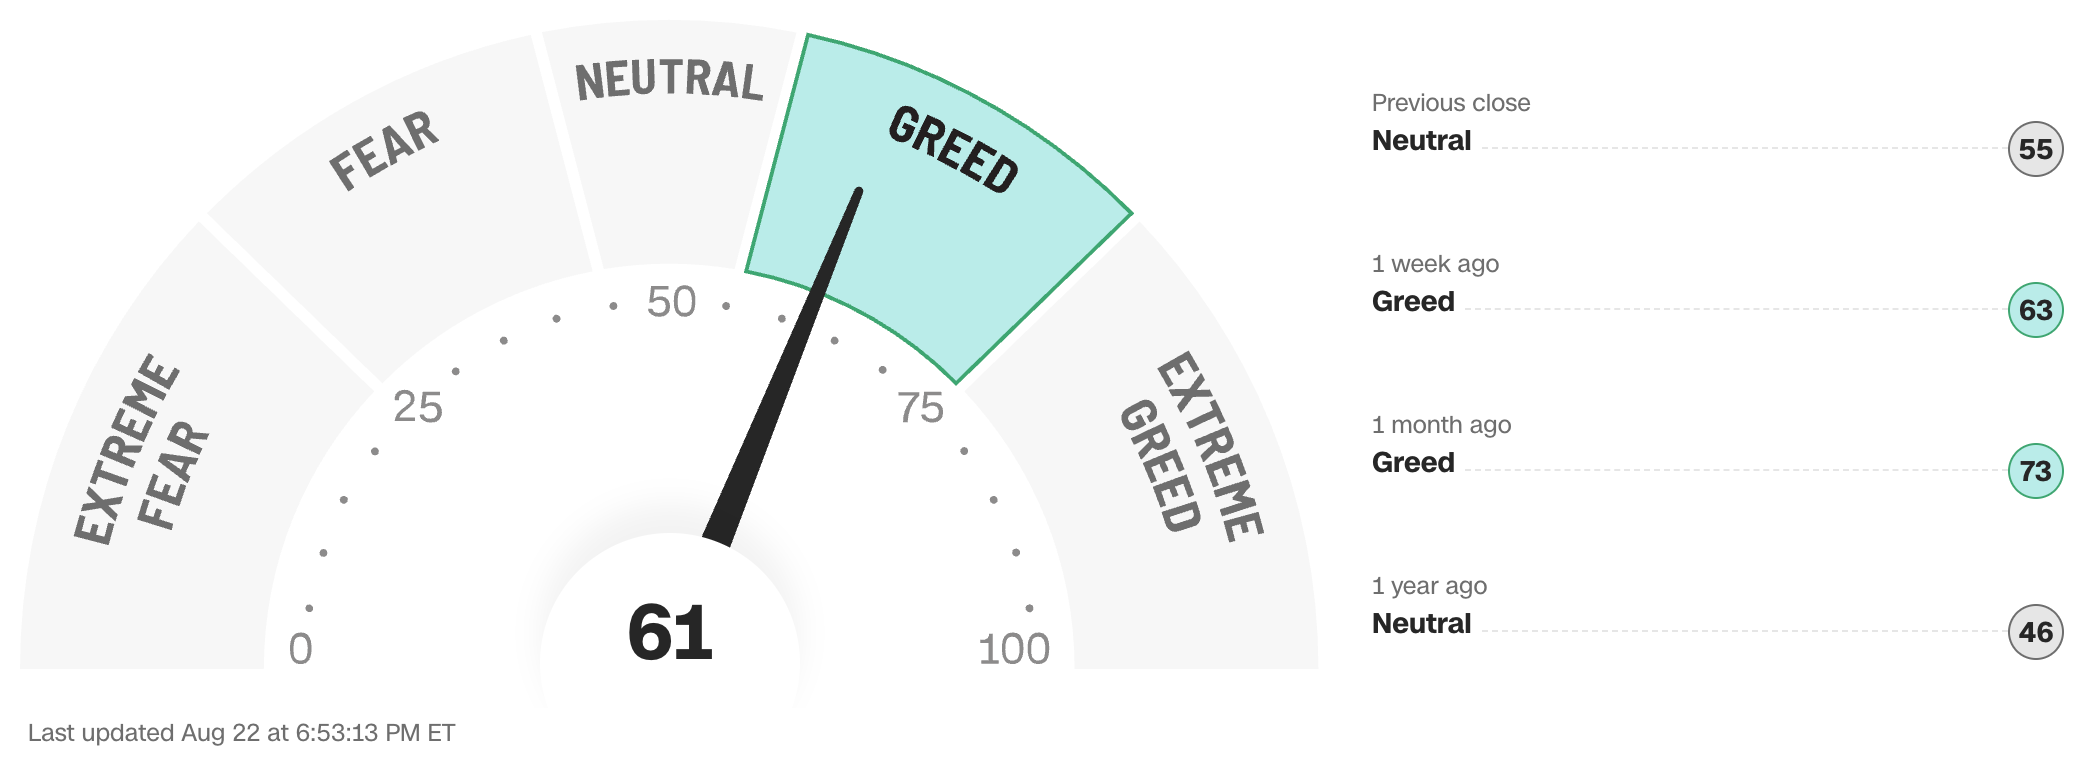
Data courtesy of CNN Business as of Friday’s market close
The Fear & Greed Index from CNN Business can be used as an attempt to gauge whether or not stocks are fairly priced and to determine the mood of the market. It is a compilation of seven of the most important indicators that measure different aspects of stock market behavior. They are: market momentum, stock price strength, stock price breadth, put and call option ratio, junk bond demand, market volatility and safe haven demand.
Extreme Fear readings can lead to potential opportunities as investors may have driven prices “too low” from a possibly excessive risk-off negative sentiment.
Extreme Greed readings can be associated with possibly too-frothy prices and a sense of “FOMO” with investors chasing rallies in an excessively risk-on environment . This overcrowded positioning leaves the market potentially vulnerable to a sharp downward reversal at some point.
A “sweet spot” is considered to be in the lower-to-mid “Greed” zone.
Note: Anglia Advisors has updated its Privacy Policy. You can view the latest version here.
WWW.ANGLIAADVISORS.COM | SIMON@ANGLIAADVISORS.COM | CALL OR TEXT: (646) 286 0290 | FOLLOW ANGLIA ADVISORS ON INSTAGRAM
This material represents a highly opinionated, speculative assessment of the financial market environment based on assumptions and prevailing information and data at a specific point in time and is always subject to change at any time. Although the content is believed to be correct at the time of publication, no warranty of its accuracy or completeness is ever given. It is never to be interpreted as an attempt to forecast any future events, nor does it offer any kind of guarantee whatsoever of future results, circumstances or outcomes.
The material contained herein is not necessarily complete and is also wholly insufficient to be relied upon as research or investment advice or as a sole basis for any financial determinations, including investment decisions or making any kind of consumer choices, without further consultation with Anglia Advisors or other fully-qualified Registered Investment Advisor. The user assumes the entire risk of any decisions made or actions taken based in whole or in part on any of the information provided in this or any other Anglia Advisors published content.
Under no circumstances is any Anglia Advisors’ content ever intended to constitute tax, legal or medical advice and should never be taken as such. Neither the information contained nor any opinion expressed herein constitutes a solicitation for the purchase of any security or asset class. No formal client advice may be rendered by Anglia Advisors unless and until a properly-executed client engagement agreement is in place.
Posts may contain links or references to third party websites or may post data or graphics from them for the convenience and interest of readers. While Anglia Advisors might have reason to believe in the quality of the content provided on these sites, the firm has no control over, and is not in any way responsible for, the accuracy of such content nor for the security or privacy protocols that external sites may or may not employ. By making use of such links, the user assumes, in its entirety, any kind of risk associated with accessing them or making use of any information provided therein.
Those associated with Anglia Advisors, including clients with managed or advised investments, may maintain positions in securities and/or asset classes mentioned in this post.
If you enjoyed this post, why not share it with someone?


