


Ahead of a risk-filled big few days in tariff-world, stock markets were jittery at the opening bell on Monday, not helped by yet another massive plunge in the price of Tesla shares on the back of Musk’s apparent dive back into politics. Things got worse for stocks as a chaotic wave of different tariff proclamations began to come out, including for Japan and South Korea which were each slapped with 25% by letter, taking effect on what appears to be the latest new drop-dead date of August 1st following another deadline extension from July 9th (cue: the return of the TACO narrative). The indexes closed the session considerably lower.
Markets seemed largely stuck in place on Tuesday morning, anticipating more tariff shoes to drop. But a rambling, disjointed press conference from Trump cast no new light on anything that financial markets really care about, other than him walking back his claim from just the previous day that the August 1st effective date was not set in stone and grumbling yet again about Fed chairman Powell. The indexes continued to tread water into the close.
The president teased more tariff and trade announcements on Wednesday and stock traders cracked out the popcorn and settled in to watch for them. But the session was kind of a nothing burger as no new trade deals were announced (the UK deal is still the only one that has been officially completed and signed off on) and the latest list of countries to be sent tariff letters was relatively unexciting with rates ranging from 20%-30% for the likes of Iraq, the Philippines and Moldova.
Given very little to work with, stocks eventually just went with the flow of the path of least resistance and drifted higher into the close with Nvidia becoming the world’s first-ever $4 trillion company by valuation and Microsoft’s stock price reaching a new all-time record high.
Thursday proved to be another rudderless session as traders continued to sit around waiting in vain to hear about deals with (or letters to) more impactful regions like Canada, India and the European Union. All they got to hear about, however, was Trump’s 50% tariff threat to Brazil - based not on economics (the US actually has a trade surplus with Brazil) but on his personal disapproval of the domestic matter of the criminal trial of disgraced ex-president and his old chum, Bolsanaro. A small uptick in the S&P 500 by the close was nonetheless enough to record yet another new all-time record high.
By the time markets opened on Friday, Trump had announced a 35% tariff rate on non-USMCA imports from Canada and had mused about 15-20% minimum baseline rate for everyone else. Stocks pulled back somewhat on the day, but rather unconvincingly on very low trading volume, finishing pretty much flat for what was a strangely meandering, directionless week.
While tariff chaos and confusion returned to the stage with the intensification of Trump’s rather obvious “escalate to de-escalate” theater (a 200% tariff on all pharmaceuticals? Really?), in some other ways the fog of uncertainty is lifting for US markets as economic data continues to be robust and domestic legislative and political risk seems to have been mostly taken off the table, at least until the mid-terms next year.
The simple fact is that Wall Street traders don’t currently believe that the announced tariffs will stay at the threatened levels for long, if they even get there in the first place (after all, August 1st may be nothing more than the new April 2nd or July 9th).
Stock markets are still pricing macro-economic and earnings risks at near zero. After totally freaking out in the spring about a tariff-induced slowdown, Wall Street is now pretty much dismissing that danger. The so-called “fear index”, the VIX, last week touched its lowest level since February.
Things get better if: There are a series of trade deals announced over the coming weeks that reduce tariff risks, economic growth remains stable or rebounds, the Fed signals that interest rate cuts may be coming in September and the 10 year Treasury rate stays around or below 4.50% (it’s currently 4.35%), reflecting market calm despite the passage of the tax and spending bill. This is basically a perfect outcome for markets and would almost certainly fuel a move to and beyond the mid-6000s in the S&P 500 (currently 6260).
Things get worse if: TACO is invalidated as Trump becomes emboldened by the relative financial market tranquility and overreaches, higher tariffs come to pass and actually persist, economic growth and the labor market slows further, the Fed fails to cut rates as a result of the tariff uncertainty and bond vigilantes flex their muscles in response to the passage of the deficit-exploding tax and spending bill and push the 10 year Treasury rate meaningfully and sustainably above 4.60%. This outcome would effectively reverse all the positive progress of the past two or three months and put trade-war-driven stagflation back on the table. The most likely result would be a sharp decline in stocks and bonds.
If you are not yet a client of Anglia Advisors and would like to explore becoming one, please feel free to reach out to arrange a complimentary no-obligation discovery call with me.
ARTICLE OF THE WEEK ..
How many dates should you go on before you start talking about money?
.. AND I QUOTE ..
“Investors may be done with tariffs but I doubt tariffs are done with investors.”
Nancy Lazar, chief global economist at Piper Sandler
LAST WEEK BY THE NUMBERS:
Last week’s market color courtesy of finviz.com

Last week’s best performing US sector: Energy (two biggest holdings: Exxon-Mobil, Chevron) ⬆︎ 2.0% for the week
Last week’s worst performing US sector: Consumer Defensive (two biggest holdings: Costco, Walmart) ⬇︎ 1.3% for the week
SPY, a US Large Cap ETF, tracks the S&P 500 index, made up of 500 stocks from a universe of the largest US companies. Its price rose 0.1% last week, is up 6.8% so far this year and ended the week 0.2% below its all-time record closing high (07/10/2025).
IWM, a US Small Cap ETF, tracks the Russell 2000 index, made up of the bottom two-thirds in terms of company size of a universe of 3,000 of the largest US stocks. Its price rose 0.8% last week, is up 1.8% so far this year and ended the week 8.2% below its all-time record closing high (11/08/2021).
VXUS, a Global Non-US ETF, tracks the MSCI ACWI Ex-US index, made up of over 8000 of the largest names from a universe of stocks issued by companies from around the world excluding the United States, in both developed and emerging markets. Its price fell 0.1% last week, is up 17.9% so far this year and ended the week 0.1% below its all-time record closing high (07/03/2025).
INTEREST RATES:
FED FUNDS * ⬌ 4.33% (unchanged)
PRIME RATE ** ⬌ 7.50% (unchanged)
3 MONTH TREASURY ⬌ 4.42% (4.42% a week ago)
2 YEAR TREASURY ⬇︎ 3.86% (3.88% a week ago)
5 YEAR TREASURY ⬇︎ 3.93% (3.94% a week ago)
10 YEAR TREASURY *** ⬌ 4.35% (4.35% a week ago)
20 YEAR TREASURY ⬌ 4.87% (4.87% a week ago)
30 YEAR TREASURY ⬌ 4.86% (4.86% a week ago)
Data courtesy of the Federal Reserve and the Department of the Treasury as of the market close on Friday.
* Decided upon by the Federal Reserve. Used as a basis for interbank loans and for determining high yield savings rates.
** Wall Street Journal Prime rate. Used as a basis for determining many consumer loan rates such as credit cards, personal loans, home equity, securities-based lending and auto loans.
*** Used as a basis for determining mortgage rates.
AVERAGE 30-YEAR FIXED MORTGAGE RATE:
⬆︎ 6.72%
One week ago: 6.67%, one month ago: 6.85%, one year ago: 6.89%
Data courtesy of: Freddie Mac Primary Mortgage Market Survey
FEDWATCH INTEREST RATE TOOL:
Where will the Fed Funds interest rate be after the next rate-setting meeting on July 30th?
Unchanged from now .. ⬇︎ 93% probability (95% a week ago)
0.25% lower than now .. ⬆︎ 7% probability (5% a week ago)
What is the most commonly-expected number of remaining 0.25% Fed Funds interest rate cuts in 2025?
⬌2 (unchanged from a week ago)
All data based on the Fed Funds interest rate (currently 4.33%). Calculated from Federal Funds futures prices as of the market close on Friday. Data courtesy of CME FedWatch Tool.
FEAR & GREED INDEX:
“Be fearful when others are greedy and be greedy when others are fearful.” Warren Buffet.
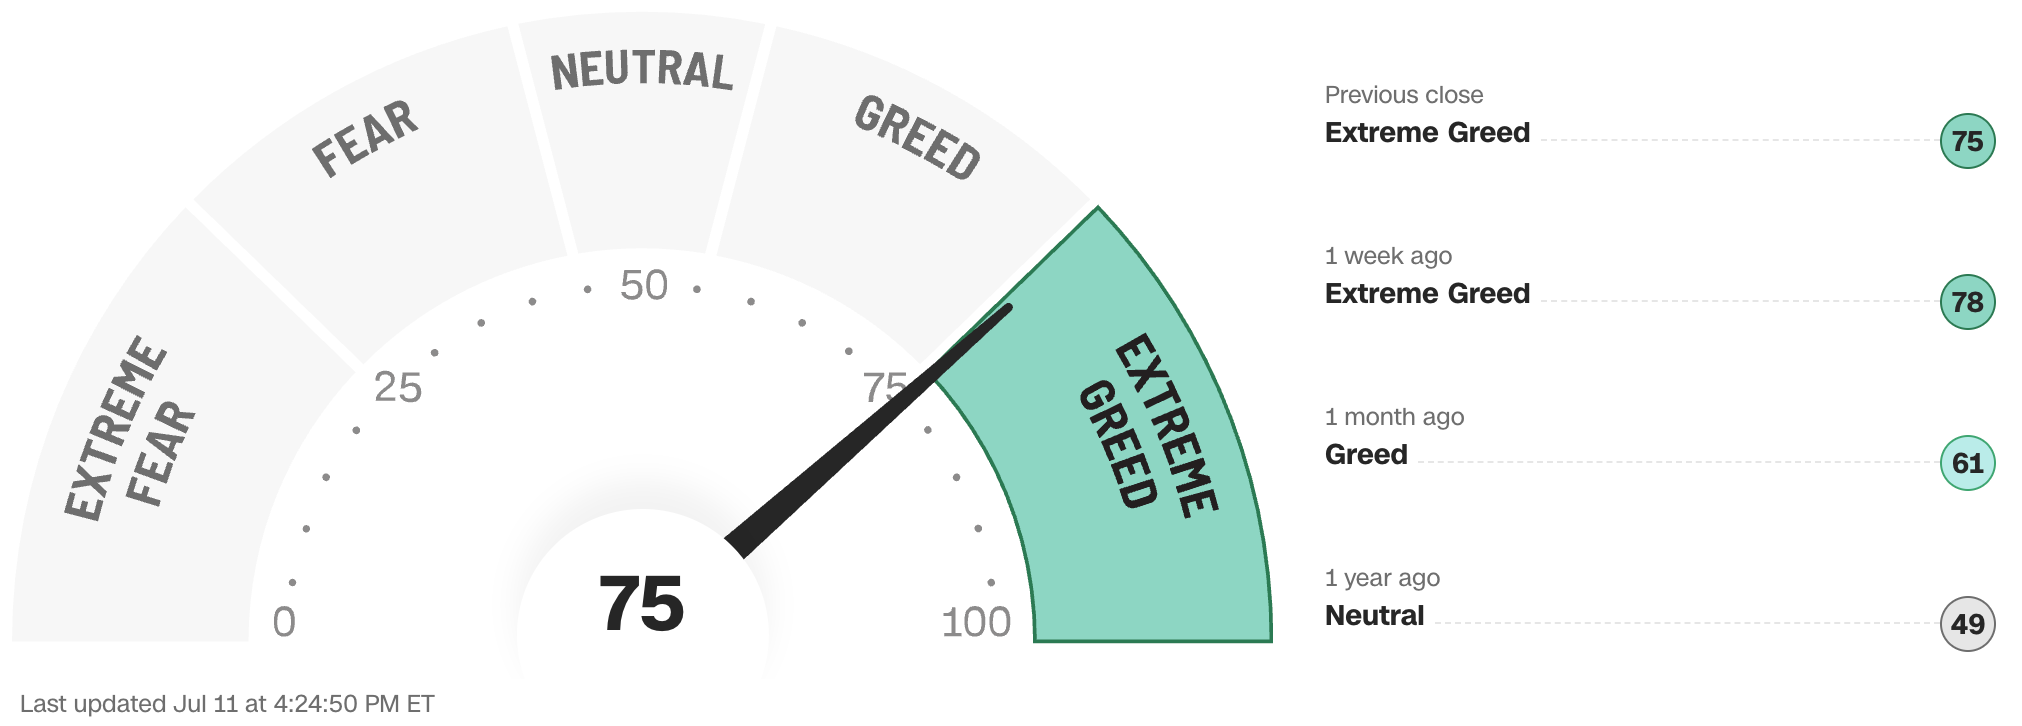
The Fear & Greed Index from CNN Business can be used as an attempt to gauge whether or not stocks are fairly priced and to determine the mood of the market. It is a compilation of seven of the most important indicators that measure different aspects of stock market behavior. They are: market momentum, stock price strength, stock price breadth, put and call option ratio, junk bond demand, market volatility and safe haven demand.
Extreme Fear readings can lead to potential opportunities as investors may have driven prices “too low” from a possibly excessive risk-off negative sentiment.
Extreme Greed readings can be associated with possibly too-frothy prices and a sense of “FOMO” with investors chasing rallies in an excessively risk-on environment . This overcrowded positioning leaves the market potentially vulnerable to a sharp downward reversal at some point.
A “sweet spot” is considered to be in the lower-to-mid “Greed” zone.
Data courtesy of CNN Business as of Friday’s market close.
Note: Anglia Advisors has updated its Privacy Policy. You can view the new version here.
WWW.ANGLIAADVISORS.COM | SIMON@ANGLIAADVISORS.COM | CALL OR TEXT: (646) 286 0290 | FOLLOW ANGLIA ADVISORS ON INSTAGRAM
This material represents a highly opinionated assessment of the financial market environment based on assumptions and prevailing information and data at a specific point in time and is always subject to change at any time. Although the content is believed to be correct at the time of publication, no warranty of its accuracy or completeness is given. It is never to be interpreted as an attempt to forecast any future events, nor does it offer any kind of guarantee of any future results, circumstances or outcomes.
The material contained herein is not necessarily complete and is also wholly insufficient to be exclusively relied upon as research or investment advice or as a sole basis for any financial decisions, including investment decisions or making any kind of consumer choices, without further consultation with Anglia Advisors or other qualified Registered Investment Advisor. The user assumes the entire risk of any decisions made or actions taken based in whole or in part on any of the information provided in this or any other Anglia Advisors published content.
Under no circumstances is any of Anglia Advisors’ content ever intended to constitute tax, legal or medical advice and should never be taken as such. Neither the information contained or any opinion expressed herein constitutes a solicitation for the purchase of any security or asset class. No client advice may be rendered by Anglia Advisors unless and until a properly-executed Client Engagement Agreement is in place.
Posts may contain links or references to third party websites or may post data or graphics from them for the convenience and interest of readers. While Anglia Advisors might have reason to believe in the quality of the content provided on these sites, the firm has no control over, and is not in any way responsible for, the accuracy of such content nor for the security or privacy protocols that external sites may or may not employ. By making use of such links, the user assumes, in its entirety, any kind of risk associated with accessing them or making use of any information provided therein.
Those associated with Anglia Advisors, including clients with managed or advised investments, may maintain positions in securities and/or asset classes mentioned in this post.

If you enjoyed this post, why not share it with someone?


