


Things got off to a somewhat muted low-volume start on Monday with many A-list institutional traders at the beach this week. Their B squads seemed to be under orders to basically tread water, waiting to see if anything of interest emerged from either the annual Federal Reserve jamboree in Jackson Hole or the Democratic National Convention in Chicago.
As the session wore on, however, the level of investor conviction and general chatter about a possible upcoming signal from the Fed on Friday concerning the start of a multiple interest rate cut process before year-end seemed to intensify and stock prices ripped higher for the S&P 500’s eighth straight day of gains, its longest winning streak of the year. Remarkably, the index closed the day less than 1% away from its all-time record high.
And the NASDAQ, with an eight-day win streak of its own, shifted back into a bull market just eleven trading days after having fallen into a correction, the fastest such turnaround since 2011. It entered a technical correction (defined as having fallen >10% from its recent high) on August 2nd, then kept tumbling until August 7th (including the washout plunge of August 5th). Then from August 8th through the 19th the index rose more than 10%, ending the correction.
Stocks took a breather on a quiet Tuesday, with the indexes finally flashing red rather than green to end the winning streaks, but the technical evidence suggested that this was probably only a pause and consolidation in the rally caused by low volume profit-taking in possibly overheated short term conditions rather than any kind of fundamental negative re-evaluation of where stock prices should be.
On Wednesday, the annual Jobs Report fact check (see OTHER NEWS below for more details) showed a largely expected downward revision of payrolls, reminding us that growth is definitely slowing. We also saw a tale of two retailers; Target’s earnings and sales report was very solid, but Macy’s not so much and their respective stock price moves reflected that.
At an index level, the rally resumed (particularly in Small Cap names) after the minutes from the last Fed meeting indicated that there was a high level of confidence among members about a September interest rate cut.
The Fed’s two-day Jackson Hole fiesta began on Thursday but Wall Street didn’t expect to learn too much until Friday when Chairman Jerome Powell was scheduled to address the media. With no real catalyst before then and anemic summer trading volume, stocks and other risk assets floated lower on the back of profit-taking and bets on the fact that we may be experiencing something of a short term overbought condition on the back of the recent rocket ride that began on August 7th, especially in tech and AI names.
Powell’s address began at 10am ET on Friday and as well as being a victory lap, it gave Wall Street the signal that it was looking for.“The time has come for policy to adjust. The direction of travel is clear”, he said and expressed confidence in the continuation of inflation’s decline and the Fed’s ability to pull off a historic soft landing, signaling definitively that the process of interest rate cuts is now finally under way.
The word “methodical” was routinely used in reference to the process and reading between the lines of what Powell said and listening to Fed speakers in interviews after the event, a jumbo cut of half a percent up front in September would now seem much less likely than a steady stream of quarter point cuts in the Fed Funds rate over the upcoming Fed meetings in September, November, December, January, March and maybe even beyond.
Stock markets loved it and prices zoomed higher, once again disproportionately led by tech and Small Cap names. The S&P 500 wasn’t quite at a new all-time high by the end of the session, but it was pretty damn close.
Since August 7th, we have seen several examples of U.S. economic data that has been better than feared, but those fears were mostly irrational and they are obscuring the fact that the U.S. economy is slowing. We still don’t yet really know the answer to the question; is the Fed merely normalizing interest rates into a soft landing or is it cutting to rescue the economy from a recession?
For a couple of trading days in early August investors piled into bonds and dumped stocks after a disappointing Jobs Report and “recession” became a trendy buzz word. But that was ridiculous and mostly the result of hysteria from a few attention-seeking commentators, political operatives and a financial media desperate for viewers and clicks. None of the economic data was then or is now pointing towards a recession. To think that one is imminent simply isn’t backed by any facts, but that doesn’t mean that one can’t happen. It absolutely could.
On the flip side, the removal of an imagined possibility doesn’t actually mean the situation has got any better, so buying everything in sight because a non-existent risk seems to have suddenly disappeared is just as irrational!
The truth that the data shows is that U.S. economic growth is slowing and the only question is by how much. The stock market is pricing in a perfectly executed soft landing by the Fed, whereby they cut interest rates aggressively enough to relieve stress on consumers and corporations and boosting profits for U.S. companies without tossing the country into a dumpster fire of a recession. It is generally underestimating how bad the effects of a soft landing failure will be, even though such a failure is still not anywhere near a base case scenario, as things stand.
P.S. .. While there will be mostly smiles all over Wall Street when the Fed rate cuts arrive, retail investors do need to prepare for something less welcome. Those delightful 5% high yield savings accounts will likely start to cut their rates roughly step-for-step in line with what the Fed does in the coming months. Many savers have got very used to these kind of returns on their cash for taking zero risk and will have to get used to a somewhat lower stream of free money going forward. Even then however, it’s still going to be way more than any bank or credit union pays you in their regular savings account.
OTHER NEWS ..
Rich Yet? .. Americans on average believe it takes a net worth of $2.5 million to be considered “wealthy” in 2024, according to annual survey results released by Charles Schwab last Wednesday. That’s a 14% jump from last year, when Americans thought it took $2.2 million to be considered rich.
The older someone is, the higher their definition of wealth in the survey. Baby boomers said being wealthy takes $2.8 million, while millennials put it at $2.2 million. Overall, slightly more than 20% of Americans said they were “on track” to be wealthy.
When asked what average net worth you’d need to be considered “financially comfortable,” Americans said $778k. This was a big drop from last year’s results when hot inflation drove the number to $1 million, the highest reading since the survey’s 2017 start.
Finally A Million .. For the first time ever, one bar of gold is worth $1 million. The milestone was when the precious metal’s spot price surpassed $2,500 per troy ounce, an all-time high. With a typical gold bar weighing about 400 troy ounces—well, you can do the math.
Disappearing Jobs? .. With victory over inflation almost in the bag, there’s a greater focus on the other half of the Federal Reserve’s mandate; the labor market. The Fed has always claimed to be data dependent in its interest rate decisions, buy how dependable is that data?
We got a peek last Wednesday when we got the annual fact check review from the Bureau of Labor Statistics (BLS) of all the notoriously inexact monthly Jobs Reports from April 2023 to March 2024. Jobs Reports have often featured at the center of the interest rate debate, none more so than the most recent release which triggered a short-lived but intense stock market crash earlier this month.
The annualized data showed a downward revision of 818k in payrolls, or about 68k per month, over the studied period. Although this was a large revision by historical standards, the largest since the Great Financial Crisis and delivered something of a blow to the BLS’ data-gathering credibility, it was pretty much in line with most analyst expectations and had no meaningful effect on markets.
ARTICLE OF THE WEEK ..
Just in case there are still a few stragglers left who think that stock-picking works and is a good idea .. Remember the “can’t miss” darling stocks of the pandemic? Well, it turns out a lot of them did. Miss, I mean. Big-time.
This is how you can even be completely correct in your analysis and forecasts for a company’s fortunes and still lose a shit-ton of money betting on it as an individual stock.
THIS WEEK’S UPCOMING CALENDAR ..
Highly anticipated Nvidia earnings, the Federal Reserve's preferred inflation gauge and the latest housing market data will likely provide next week's headlines.
The monster event on the earnings calendar will be Nvidia on Wednesday evening. As the poster child for the AI trade, the numbers will likely move markets significantly one way or the other. Other companies reporting next week include Dell, Salesforce, CrowdStrike, Chewy and lululemon.
On Friday, Fed officials will get a look at the July Personal Consumption Expenditures (PCE) price index. Consensus estimate is for the index to be up 2.6% annualized. This is the measure that the Fed, which has a 2.0% target inflation rate, uses to gauge where it believes inflation actually is.
Other data to watch next include the Durable Goods report and fresh housing data in the form of Home Price Indexes and the Pending Home Sales Index.
LAST WEEK BY THE NUMBERS ..
Last week’s market color courtesy of finviz.com

Last week’s best performing U.S. sector: Real Estate (two biggest holdings: Prologis, American Tower Corp) - up 3.8% for the week.
Last week’s worst performing U.S. sector: Energy (two biggest holdings: Exxon Mobil, Chevron)- down 0.1% for the week.
SPY, the S&P 500 Large Cap ETF, tracks the S&P 500 index, made up of 500 stocks from among the largest U.S. companies. Its price rose 1.4% last week, is up 18.3% so far this year and ended the week 0.5% below its all-time record closing high (07/16/2024).
IWM, the Russell 2000 Small Cap ETF, tracks the Russell 2000 index, made up of the bottom two-thirds in terms of company size of a group made up from among 3,000 largest U.S. stocks. Its price rose 3.9% last week, is up 9.8% so far this year and ended the week 9.1% below its all-time record closing high (11/08/2021).
AVERAGE 30-YEAR FIXED MORTGAGE RATE ..
6.46%
One week ago: 6.49%, one month ago: 6.78%, one year ago: 7.23%
Data courtesy of: FRED Economic Data, St. Louis Fed as of last Thursday.
FEAR & GREED INDEX ..
“Be fearful when others are greedy and be greedy when others are fearful.” Warren Buffet.
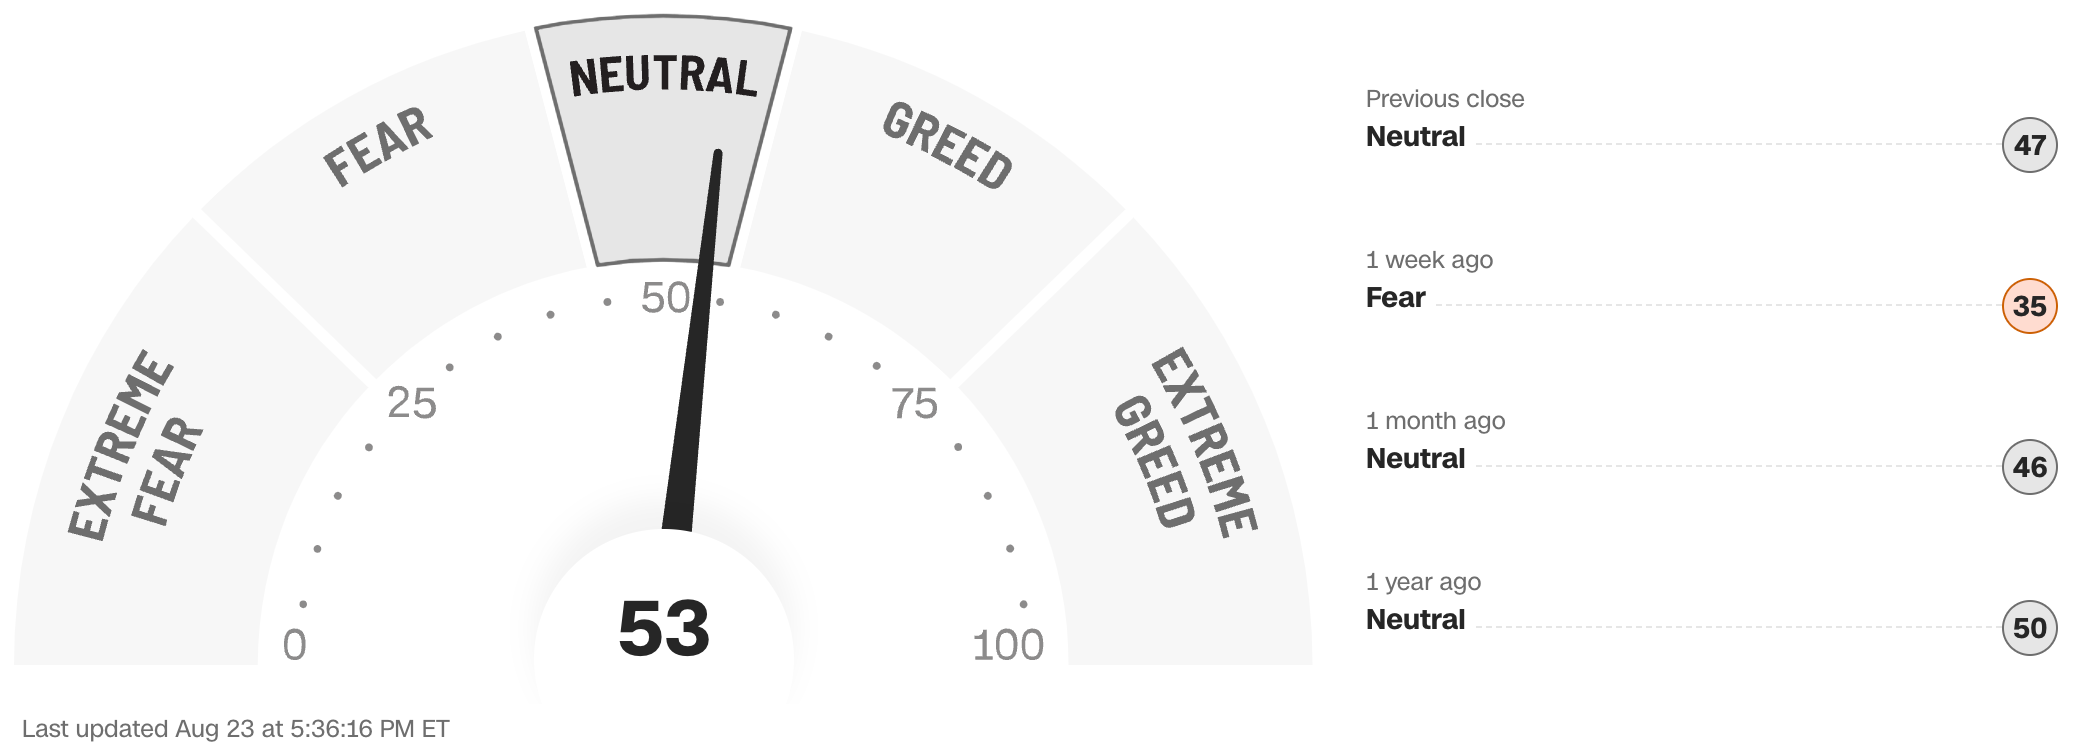
The Fear & Greed Index from CNN Business can be used as an attempt to gauge whether or not stocks are fairly priced and to determine the mood of the market. It is a compilation of seven of the most important indicators that measure different aspects of stock market behavior. They are: market momentum, stock price strength, stock price breadth, put and call option ratio, junk bond demand, market volatility and safe haven demand.
Extreme Fear readings can lead to potential opportunities as investors may have driven prices “too low” from a possibly excessive risk-off negative sentiment.
Extreme Greed readings can be associated with possibly too-frothy prices and a sense of “FOMO” with investors chasing rallies in an excessively risk-on environment . This overcrowded positioning leaves the market potentially vulnerable to a sharp downward reversal at some point.
A “sweet spot” is considered to be in the lower-to-mid “Greed” zone.
Data courtesy of CNN Business as of Friday’s market close.
FEDWATCH INTEREST RATE TOOL ..
Will interest rates be lower than they are now after the Fed’s next meeting on September 18th?
Yes .. 100% probability (100% a week ago)
No .. 0% probability (0% a week ago)
Where is the Fed Funds interest rate most likely to be at the end of 2024?
4.375% (1.00% lower than where we are now, implying four 0.25% rate cuts before the end of 2024)
One week ago: 4.375% (implying four rate cuts), one month ago: 4.625% (implying three rate cuts)
All data based on the Fed Funds rate (currently 5.375%). Calculated from Federal Funds futures prices as of the market close on Friday. Data courtesy of CME FedWatch Tool.
% OF S&P 500 STOCKS TRADING ABOVE THEIR 50-DAY MOVING AVERAGE:
79% (397 of the S&P 500 stocks ended last week above their 50D MA and 103 were below)
One week ago: 68%, one month ago: 67%, one year ago: 36%
% OF S&P 500 STOCKS TRADING ABOVE THEIR 200-DAY MOVING AVERAGE:
77% (384 of the S&P 500 stocks ended last week above their 200D MA and 116 were below)
One week ago: 72%, one month ago: 71%, one year ago: 50%
Closely-watched measures of market breadth and participation, providing a real-time look at how many of the S&P 500 index stocks are trending higher or lower, as defined by whether the stock price is above or below their more sensitive 50-day (short term) and less sensitive 200-day (long term) moving averages which are among the most widely-followed of all stock market technical indicators.
The higher the reading, the better the deemed health of the overall market trend, with 50% considered to be a key pivot point. Readings above 90% or below 15% are extremely rare.
WEEKLY US INVESTOR SENTIMENT (outlook for the upcoming 6 months) ..
↑Bullish: 51% (42% a week ago)
⬌ Neutral: 25% (29% a week ago)
↓Bearish: 24% (29% a week ago)
Net Bull-Bear spread: ↑Bullish by 27 (Bullish by 13 week ago)
For context: Long term averages: Bullish: 38% — Neutral: 32% — Bearish: 30% — Net Bull-Bear spread: Bullish by 8
Survey participants are typically polled during the first half of the week.
Data courtesy of: American Association of Individual Investors (AAII).
WWW.ANGLIAADVISORS.COM | SIMON@ANGLIAADVISORS.COM | CALL OR TEXT: (646) 286 0290 | FOLLOW ANGLIA ADVISORS ON INSTAGRAM
This material represents a highly opinionated assessment of the financial market environment based on assumptions and prevailing information and data at a specific point in time and is always subject to change at any time. Although the content is believed to be correct at the time of publication, no warranty of its accuracy or completeness is given. It is never to be interpreted as an attempt to forecast any future events, nor does it offer any kind of guarantee of any future results, circumstances or outcomes.
The material contained herein is not necessarily complete and is wholly insufficient to be exclusively relied upon as research or investment advice or as a sole basis for any investment or other financial decisions. The user assumes the entire risk of any decisions made or actions taken based in whole or in part on any of the information provided in this or any Anglia Advisors communication of any kind. Under no circumstances is any of Anglia Advisors’ content ever intended to constitute tax, legal or medical advice and should never be taken as such. Neither the information contained or any opinion expressed herein constitutes a solicitation for the purchase of any security or asset class. No advice may be rendered by Anglia Advisors unless or until an executed Client Engagement Agreement is in place.
Posts may contain links or references to third party websites or may post data or graphics from them for the convenience and interest of readers. While Anglia Advisors might have reason to believe in the quality of the content provided on these sites, the firm has no control over, and is not in any way responsible for, the accuracy of such content nor for the security or privacy protocols that external sites may or may not employ. By making use of such links, the user assumes, in its entirety, any kind of risk associated with accessing them or making use of any information provided therein.
Those associated with Anglia Advisors, including clients with managed or advised investments, may maintain positions in securities and/or asset classes mentioned in this post.

If you enjoyed this post, why not share it with someone or encourage them to subscribe themselves?


