


It was more of the same. For the second week running, stocks played a nervous waiting game for the first three days of the week, afraid of being disappointed by some data that was coming out on Thursday. Then, also just like the week before, when the data proved to not be as bad as feared, stock markets got bought up nicely on Thursday and Friday to end the week with gains and yet more new all time record highs.
Monday was quiet as Wall Street traders digested the previous week’s melt-up and decided to hold their fire ahead of the influential PCE inflation numbers later in the week. It was suspected that that this release could well confirm the inflation stickiness indicated by the most recent Consumer and Producer Price Index data, thereby justifying the Federal Reserve’s highly cautious approach to lowering interest rates any time soon. Stocks moved a touch lower.
This waiting game continued on Tuesday. The latest data on Durable Goods sales and consumer sentiment both came in softer than expected. The can braced itself for yet another kick down the road as noises coming out of Washington DC took a decidedly optimistic turn regarding a deal to avoid the potential government shutdown. This proved ultimately to be misleading, as we will see later.
Suspicions continued to deepen that the inflation data coming out on Thursday would disappoint - but anyone selling stocks since October has usually got burned by the experience so the net outcome was another holding pattern for most of the indexes, although the recently-battered Small Caps actually ended up having a pretty good session.
Stocks continued to struggle to find any direction and experienced small losses on a largely uneventful Wednesday after a report showed that Q4 2023 Gross Domestic Product (GDP) is estimated to have risen at a revised 3.2% annualized pace, compared with an expectation of 3.3%. Consumer spending advanced at a 3.0% rate, a bit faster than estimates. Over the course of the entire year, the U.S. economy expanded 2.5% in 2023.
When the government shutdown can did get kicked on Wednesday evening, it didn’t make it very far down the road. The House agreed to extend federal funding for all of a week and the lights-out date was pushed back by a whole two weeks, so the key shutdown dates are now March 8th (Part I) and March 22nd (Part II). This half-baked, pathetic punt was then passed in the Senate the next day and sent to Biden for his signature. Which means that we will face the same political posturing shit show in Congress all over again this week and likely for the next couple of weeks as well.
We finally got to see the hotly-anticipated Core Personal Consumption Expenditures (PCE) price index on Thursday morning before markets opened for business. This is the measure that the Fed uses to determine what inflation is really doing and is therefore arguably the most important of economic statistics these days.
It showed an increase of 0.4% for January and 2.8% from a year ago. This was entirely in line with expectations, leaving the fears experienced over the preceding few days unwarranted. Wall Street exhaled in relief and resumed its steady buying of stocks which proved enough to send the S&P 500 to (you guessed it!) its 14th new record closing high of 2024 and the NASDAQ to its first new record closing high since November 2021.
The price of the stock of commercial real estate lender New York Community Bancorp tumbled further on Friday after the regional bank admitted that it had discovered “material weaknesses” in how it tracks loan risk. The stock plunged 30% in a matter of minutes to a level 75% below where it was as recently as August of last year.
The broad market did fine, however, on the back of continued relief surrounding the previous day’s inflation figures and some rather benign Fed-speak. All the indexes ran higher again and yet more new all-time record closing highs were recorded. The bears are in full retreat right now.
The market’s sense last week was that the doomsayers’ ongoing narrative that “any day now a catastrophic number will derail the rally and send the market into a tailspin” was once again proved wrong and that the safest reaction in response seems to be to just keep on steadfastly buying.
My view is that any meaningful derailment of this rally will be a process and not an event. If we are watching carefully enough, we should see it begin to unfold in real time.
All the while, there continues to be a quiet but steady drumbeat in the deep background of the opinion that inflation’s stickiness could mean that there actually may not be any rate cuts at all in 2024. While it would be wrong to say that this view is moving into the mainstream, you don’t need to dig very deep into financial media any more to find it. Higher for longer, as they say.
But in a world that seems to automatically correlate the narrative of “interest rates up = stocks down” and vice-versa, it’s sometimes easy to forget that investors had no issue with high interest rates back in the 1990s, when stocks went on a record run. During that decade, the S&P 500 averaged a mouth-watering annual return of 18.2%. Meanwhile, the Fed Funds rate was as high as 8.25% during that period and never once went below 3%. It’s currently 5.375%, so it’s clear than higher interest rates and upwardly mobile stock markets can co-exist.
What cannot co-exist, though, is an upwardly mobile stock market and a meaningful recession. The S&P 500, which closed on Friday at 5,137, was trading solidly below 4,000 much of last year precisely because investors feared a recession. If a proper recession does now occur (albeit much later than expected) then it’s not unreasonable to expect stocks to drop back to that level or below.
Put simply: No one currently expects the economy to roll over. But if it does, it could erase the entire rally that’s occurred since October 2023 and then some. That’s why investors must continue to watch economic data closely and recognize rising slowdown risks if they emerge so that they aren’t blindsided by any sudden market volatility. That’s what I try to do all week and report back to subscribers each Sunday.
OTHER NEWS ..
Pointless Exercise .. The utter futility of those stupid end of year predictions that no-one should take any notice of was highlighted by the fact that five Wall Street firms have already raised their forecasts for the S&P 500, which is up 7% to start the year after rising 24% in 2023. Last week alone, Piper Sandler, UBS and Barclays boosted their targets. Two firms — Goldman Sachs Group Inc. and UBS again — have already adjusted their guesses upwards twice since December.
So Long, EV .. Apple is canceling a decade-long bid to build an electric car, abandoning one of the most ambitious projects in the history of the company. According to Bloomberg, Apple made the disclosure internally on Tuesday, surprising the nearly 2,000 employees working on it. The decision to ultimately wind down the initiative is a bombshell, ending a multibillion-dollar effort called Project Titan that would have vaulted Apple into a whole new industry. The tech giant started working on a car around 2014, setting its sights on a fully autonomous electric vehicle with a limousine-like interior and voice-guided navigation. But now its all over.
It’s Really Hard To Get A Car Loan .. Access to auto credit hit the lowest point since August 2020, with the approval rate for loans down 1.6 percentage points year-over-year. With borrowers struggling to make their monthly car payments, banks are responding by tightening credit standards.
This state of affairs is freezing out buyers with lower credit scores who can’t afford a large down payment, while even Americans with healthy finances are having more trouble than usual securing loans. And for dealers, it means many potential customers have struggled to get approved for loans in recent months, which is dragging down sales.
UNDER THE HOOD ..
Core technical indicators remain supportive of the long-term market uptrend despite shorter-term inconsistencies that may leave the advance vulnerable in the coming days and weeks.
Over 50% of Large Cap stocks are within 2% of their one-year highs. That’s an astonishingly high reading. In the Small Cap universe, this reading is less than 20% and, in an ideal world, that needs to shift higher to fully re-energize the rally. However, as risk appetite eventually expands, and/or investors have more and more difficulty finding attractively-priced Large Cap stocks, Small-Caps are likely to start receiving more love from the buyers.
A near-term pullback in stock prices driven by short term traders booking profits would not be at all surprising here but it is technically unlikely that such a pullback would develop into more than a 3%-5% decline in the S&P 500 and the medium/longer term technical path of least resistance remains very much to the upside.
Anglia Advisors clients are welcome to reach out to me to discuss market conditions further.
THIS WEEK’S UPCOMING CALENDAR ..
The big news this week comes on Friday with the latest Jobs Report for February. Estimates are for a gain of 200k payrolls and an unchanged unemployment rate at 3.7%. Before that, we will get some insight from the Job Openings and Labor Turnover Survey (JOLTS) on Wednesday. The consensus forecast is for 8.9 million job openings on the last business day of January, which would be down slightly from December.
Still a few stragglers left to report Q4 2023 earnings such as Target, Costco, CrowdStrike, Broadcom, Kroger and Campbell Soup.
The European Central Bank will announce its interest rate-setting decision on Thursday and is expected to leave things unchanged.
ARTICLE OF THE WEEK ..
It is trendy to believe that spending your money on experiences is more valuable than acquiring stuff. This fails to capture the full story. Our ‘stuff’ can be extremely important, even defining who we are.
LAST WEEK BY THE NUMBERS ..
Last week’s market color courtesy of finviz.com
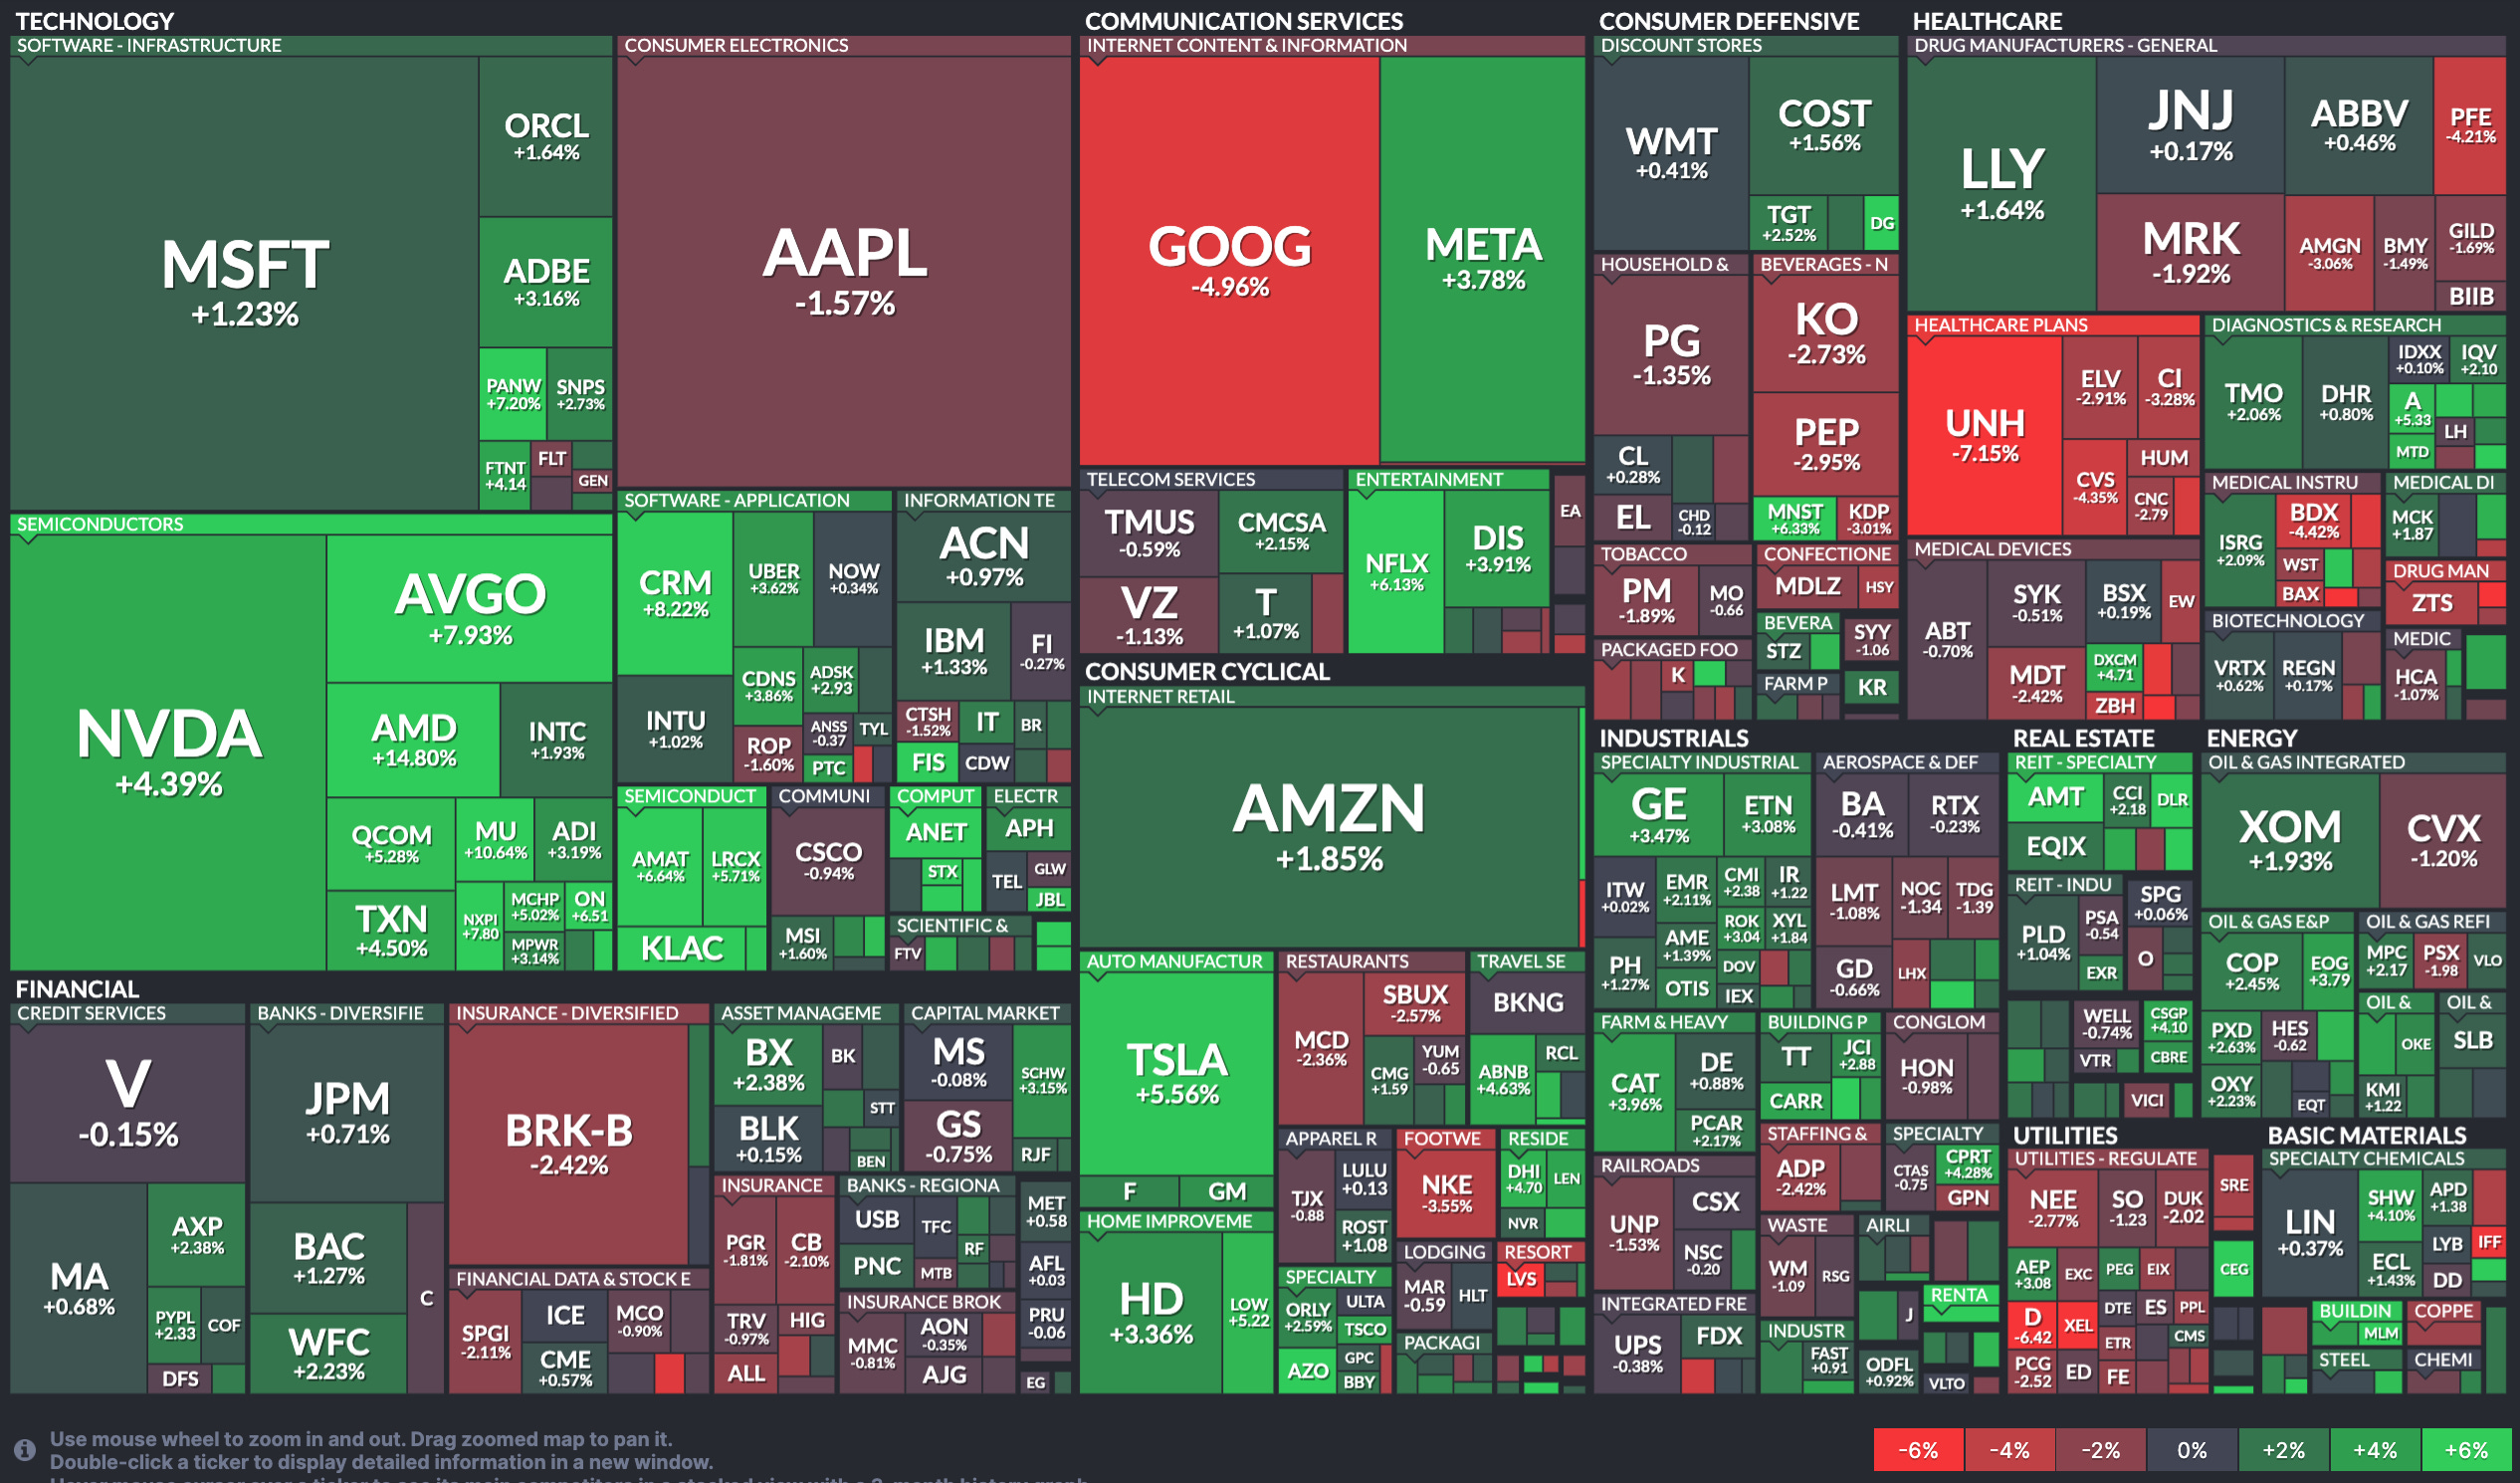
Last week’s best performing U.S. sector: Technology (two biggest holdings: Microsoft, Apple) - up 2.5% for the week.
Last week’s worst performing U.S. sector: Healthcare (two biggest holdings: Eli Lilly, UnitedHealth Group) - down 1.0% for the week.
SPY, the S&P 500 Large Cap ETF, is made up of the stocks of the 500 largest U.S. companies. Its price rose 0.8% last week, is up 7.9% so far this year and ended the week at a new all-time closing record high (03/01/2024)
IWM, the Russell 2000 Small Cap ETF, is made up of the bottom two-thirds in terms of company size of the group of the 3,000 largest U.S. stocks. Its price rose 2.8% last week, is up 2.6% so far this year and ended the week 15.1% below its all-time closing record high (11/08/2021)
DXY, the U.S. Dollar index, is an index that measures the value of the U.S. Dollar against a weighted basket of six other major currencies (the Euro, the Japanese Yen, the British Pound, the Canadian Dollar, the Swedish Krone and the Swiss Franc). It rose 0.1% last week, is up 2.6% so far this year and is up 14.1% over the last three years.
AVERAGE 30-YEAR FIXED MORTGAGE RATE ..
6.94%
One week ago: 6.90%, one month ago: 6.63%, one year ago: 6.65%
Data courtesy of: FRED Economic Data, St. Louis Fed as of last Thursday.
FEAR & GREED INDEX ..
“Be fearful when others are greedy and be greedy when others are fearful.” Warren Buffet.
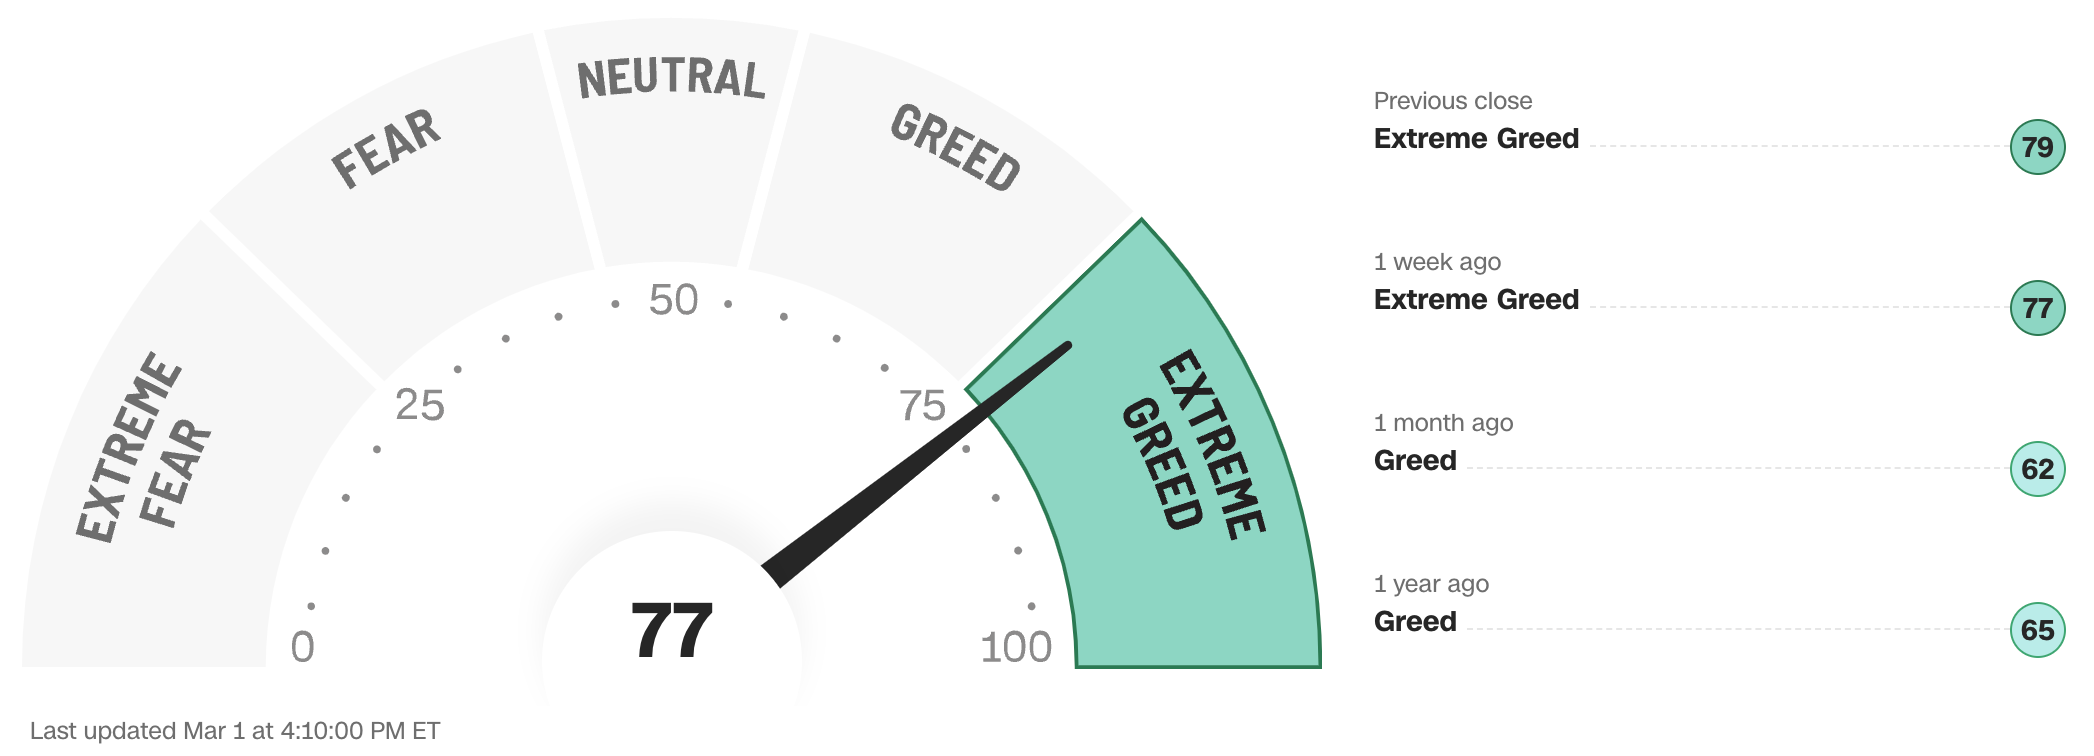
The Fear & Greed Index from CNN Business can be used as an attempt to gauge whether or not stocks are fairly priced and to determine the mood of the market. It is a compilation of seven of the most important indicators that measure different aspects of stock market behavior. They are: market momentum, stock price strength, stock price breadth, put and call option ratio, junk bond demand, market volatility and safe haven demand.
Extreme Fear readings can lead to potential opportunities as investors may have driven prices “too low” from a possibly excessive risk-off negative sentiment.
Extreme Greed readings can be associated with possibly too-frothy prices and a sense of “FOMO” with investors chasing rallies in an excessively risk-on environment . This overcrowded positioning leaves the market potentially vulnerable to a sharp downward reversal at some point.
The “sweet spot” is considered to be in the lower-to-mid “Greed” zone.
Data courtesy of CNN Business.
The 50-day moving average of the S&P 500 remains above the 200-day. This is a continued indication of a technical uptrend.
% OF S&P 500 STOCKS TRADING ABOVE THEIR 50-DAY MOVING AVERAGE ..
68% (340 of the 500 largest stocks in the U.S. ended last week above their 50D MA and 160 were below)
One week ago: 66%, one month ago: 70%, one year ago: 40%
% OF S&P 500 STOCKS TRADING ABOVE THEIR 200-DAY MOVING AVERAGE ..
73% (365 of the 500 largest stocks in the U.S. ended last week above their 200D MA and 135 were below)
One week ago: 73%, one month ago: 73%, one year ago: 53%
Closely-watched measures of market breadth and participation, providing a real-time look at how many of the largest 500 publicly-traded stocks in the U.S. are trending higher or lower, as defined by whether the stock price is above or below their more sensitive 50-day (short term) and less sensitive 200-day (long term) moving averages which are among the most widely-followed of all stock market technical indicators.
The higher the reading, the better the deemed health of the overall market trend, with 50% considered to be a key pivot point. Readings above 90% or below 15% are extremely rare.
WEEKLY US INVESTOR SENTIMENT (outlook for the upcoming 6 months) ..
↑Bullish: 47% (44% a week ago)
⬌ Neutral: 32% (30% a week ago)
↓Bearish: 21% (26% a week ago)
Net Bull-Bear spread: ↑Bullish by 26 (Bullish by 18 a week ago)
For context: Long term averages: Bullish: 38% — Neutral: 32% — Bearish: 30% — Net Bull-Bear spread: Bullish by 8
Survey participants are typically polled during the first half of the week.
Data courtesy of: American Association of Individual Investors (AAII).
FEDWATCH INTEREST RATE TOOL ..
Will interest rates be lower than they are now following the Fed’s next meeting on March 20th?
Yes .. 5% probability (2% a week ago)
No .. 95% probability (98% a week ago)
Will interest rates be lower than they are now following the Fed’s following meeting on May 1st?
Yes .. 25% probability (8% a week ago)
No .. 75% probability (92% a week ago)
Where is the Fed Funds interest rate most likely to be at the end of 2024?
4.375% (1.00% lower than where we are now, implying four rate cuts of 0.25% each in 2024)
One week ago: 4.625% (implying three rate cuts), one month ago: 3.875% (implying six rate cuts)
All data based on the Fed Funds rate (currently 5.375%). Calculated from Federal Funds futures prices as of the market close on Friday. Data courtesy of CME FedWatch Tool.
US TREASURY INTEREST RATE YIELD CURVE ..

The highest rate on the yield curve (5.53%) is being paid for the 2-month duration and the lowest rate (4.25%) is for the 10-year.
The most closely-watched and commonly-used comparative measure of the spread between the higher 2-year and the lower 10-year fell from 0.41% to 0.39%, indicating a flattening in the inversion of the curve.
The interest rate yield curve remains unusually “inverted” (i.e. shorter term interest rates are generally higher than longer term ones). Based on the 2-year vs. 10-year spread, the curve has been inverted since July 2022.
Historically, an inverted yield curve is not the norm and has been regarded by many as a leading indicator of an impending recession, with shorter term risk regarded to be unusually higher than longer term. The steeper the inversion, the greater the deemed risk of recession.
Data courtesy of ustreasuryyieldcurve.com as of Friday. The lightly shaded area on the chart shows the current Federal Funds rate range.
WWW.ANGLIAADVISORS.COM | SIMON@ANGLIAADVISORS.COM | CALL OR TEXT: (929) 677 6774 | FOLLOW ANGLIA ADVISORS ON INSTAGRAM
This material represents a highly opinionated assessment of the financial market environment based on assumptions and prevailing data at a specific point in time and is always subject to change at any time. Although the content is believed to be correct at the time of publication, no warranty of its accuracy or completeness is given. It is never to be interpreted as an attempt to forecast any future events, nor does it offer any kind of guarantee of any future results, circumstances or outcomes.
The material contained herein is not necessarily complete and is wholly insufficient to be exclusively relied upon as research or investment advice or as a sole basis for any investment or other financial decisions. The user assumes the entire risk of any decisions made or actions taken based in whole or in part on any of the information provided in this or any Anglia Advisors communication of any kind. Under no circumstances is any of Anglia Advisors’ content ever intended to constitute tax, legal or medical advice and should never be taken as such. Neither the information contained or any opinion expressed herein constitutes a solicitation for the purchase of any security or asset class.
Posts may contain links or references to third party websites or may post data or graphics from them for the convenience and interest of readers. While Anglia Advisors might have reason to believe in the quality of the content provided on these sites, the firm has no control over, and is not in any way responsible for, the accuracy of such content nor for the security or privacy protocols that external sites may or may not employ. By making use of such links, the user assumes, in its entirety, any kind of risk associated with accessing them or making use of any information provided therein.
Those associated with Anglia Advisors, including clients with managed or advised investments, may maintain positions in securities and/or asset classes mentioned in this post.

If you enjoyed this post, why not share it with someone or encourage them to subscribe themselves?


