


Stocks moved higher last week for the fourth week in a row with the major indexes ending the holiday-shortened week up by about 1%. The sense grew that the typical year-end Santa Claus rally may possibly have begun even before Thanksgiving. But trading volumes were so low that drawing any real conclusions from last week’s activity would be a fool’s errand.
No news was good news on a slow, drama-free Monday. Stock indexes drifted steadily upwards on low volume throughout most of the trading session to close near the highs of the day. 2024 brings a host of unanswered questions, but right now that's a problem for another day. In the near term, what's not to like?
Stocks floated gently lower in another bland session on Tuesday. The often closely-scrutinized minutes from the most recent Fed meeting were released and were met with a huge yawn. There was far more excitement and anticipation about Nvidia’s Q3 earnings due out after the closing bell that day.
This reflects an ongoing shift from the market’s previous laser focus on every single little thing that the Fed is saying or doing to starting to care more about what is actually happening on the ground when it comes to corporate earnings and outlook, especially in the case of those dominant companies in the so-called Magnificent Seven (Apple, Microsoft, Alphabet/Google, Nvidia, Meta/Facebook, Amazon and Tesla).
When it came out, Nvidia’s Q3 earnings report was once again astounding. Its reported revenues of $20 billion blew away analysts’ estimates, but it is a sign of how far ahead the market has got of itself that investors’ first instinct was to sell the stock (which was up over 240% year-to-date at the time) because it obliterated expectations by slightly less than it might have and there are enormous amounts of good news already baked into the price. Nvidia has clearly set a very high bar for itself.
Tuesday’s losses were erased by gains on Wednesday in yet another low-volume snoozer on Thanksgiving Eve with only a muted response to Nvidia’s numbers. Stocks were driven to their highest levels since early August mainly by a solid day for Microsoft on the back of the absurd and tiresome saga of Open AI and Sam Altman. Markets then made a brief return from turkey day on Friday, ending the abbreviated session mixed and little changed in very thin trading.
While last week’s stock market activity was extremely uninteresting and uninformative, there is an important change to be aware of. Regular readers will know that I always talk of the Three Pillars upon which 2023’s stock rally has been built, that is: 1. No Landing / Soft Landing, 2. Disinflation, 3. Fed Done/Almost Done with Rate Hikes.
The hypothesis is that as long as these three pillars all remain solidly in place, we are unlikely to experience a meaningful market decline as it is these factors that have driven the market higher this year. But if they all begin to crumble then look out below, because stocks are only as high as they are based on the premise that these pillars are all valid and continue to be so (which is currently the case).
Events have moved on and there is now an adjustment to the definition of the third pillar. “Fed Done/Almost Done with Rate Hikes” has (absent some kind of major external shock) now become “Interest Rate Cuts Sooner Rather Than Later”.
The Fed may well confirm at its December meeting that they are “done” with rate hikes for the foreseeable future and with that confirmation comes new risks.
Put simply, the gap between what the Fed says it plans to do (cut rates just once at some point in 2024) and what the market expects it to do (cut rates at least three or four times next year, starting as soon as about May) is extremely wide and disappointment on the part of a market that has essentially already priced in its view of events could lead to a troubling outcome for stocks. We need to keep a close eye on this now-adjusted pillar alongside the other two.
OTHER NEWS .. MORE BROS BEHAVING BADLY EDITION
Another One Bites The Dust .. While the financial media furiously focused last week on the tedious story of a bunch of AI nerds and their complete inability to figure out how to run a business, the real story of the week was that yet another earthquake shook the corrupt rubble that is what remains of crypto world.
The world’s largest crypto exchange, Binance and its CEO Changpeng Zhao (known in bro-world of course as CZ) pleaded guilty in federal court in Seattle on Tuesday to multiple money-laundering and sanctions violations, including enabling and facilitating transactions for illicit groups such as ISIS, Al Quaeda and more.
Prison-bound CZ will step down as CEO and personally pay a $50 million fine after pleading guilty to violating the Bank Secrecy Act. The firm itself will pay fines of $4.3 billion in one of the largest ever monetary penalties ever imposed in U.S. history.
Unlike FTX (the world’s second largest crypto exchange before its collapse last year under recently-convicted fraudster Sam Bankman-Fried), the Binance exchange will be allowed to keep operating, but under new management.
Crypto’s two biggest pin-up boys are now both convicted felons. The two largest crypto exchanges have now been shown to have operated as useful tools for drug dealers, child traffickers, extortionists and international and domestic terrorists as well as sewers of corruption and fraud where billions of dollars of client assets were completely unsafe from misuse and outright theft.
This nonsensical libertarian utopia with zero regulation has come crashing down and will hopefully soon be replaced with transparent and highly-regulated securities under close and constant scrutiny from the Securities and Exchange Commission (SEC) such as exchange traded funds and transactions carried out on properly-controlled established exchanges that actually have a long list of rules for all participants and strict customer protections for those looking to gain exposure to the crypto ecosystem.
And In More Ridiculous Tech Bro News .. Tech entrepreneur and self-driving car pioneer, Anthony Levandowski, is rebooting his AI church in a renewed attempt at creating a religious movement focused on the worship of artificial intelligence, according to Bloomberg News.
Levandowski’s so-called “Way of the Future” was founded in 2015 but shut down a few years later. According to him, the congregation at the new church, which shares the original’s name, has “a couple of thousand people” who apparently all meet up to build a “spiritual connection between humans and AI”. Big eye-roll.
UNDER THE HOOD ..
Last week’s price action moved the reading for Buying Power back above that of Selling Pressure for the first time since mid-September.
However, history reminds us that most selective Demand environments like the one we are experiencing, eventually give way to major market tops, but on an unknowable time horizon. Investors need to recognize that the market’s strong buying preference is still mostly for quality mega-cap stocks. While “the rest” could feasibly catch up with “the best” , it is historically more typical for Demand to finally recede from the strongest stocks, bringing them back down closer to the level of the rest of the pack.
Last week, even as the S&P 500 index got to within 1% of the one year high that it reached in July, there were still more stocks that were 20% or more below their one year highs (39%) than stocks that were 10% or less below their one year highs (36%). This is a highly significant and meaningful divergence, emphasizing yet again that there are still plenty of stocks not really participating in the current rally to the extent that you would expect and that is not a formula for a sustainable turnaround. We need that percentage to explode much higher and quite soon if we aren’t to see a rather meaningful slump in stock prices.
The party is still ongoing, but the music may be slowing.
Anglia Advisors clients are welcome to reach out to me to discuss market conditions further.
THIS WEEK’S UPCOMING CALENDAR ..
This week’s earnings highlights will be from Intuit, Dell, Hewlett Packard Enterprise, VMware, CrowdStrike, Dollar Tree, Kroger, Foot Locker, Snowflake and Ulta Beauty.
On Thursday we get to see the latest Personal Consumption Expenditures (PCE) index for October, the Core version of which is what the Fed uses to assess inflation and inform all of its interest rate decisions. This reading is expected to be up 3.5% from a year earlier, versus an increase of 3.7% in the year through September.
Other economic data out this week will include the latest New Home Sales data and the National Home Price index as well as the Consumer Confidence Index for November.
ARTICLE OF THE WEEK ..
The only four charts you need to see to understand investing.
LAST WEEK BY THE NUMBERS ..
Last week’s market color courtesy of finviz.com

Last week’s best performing US sector: Healthcare (two biggest holdings: Eli Lilly, United Healthcare) - up 1.6% for the week.
Last week’s worst performing US sector: Technology (two biggest holdings: Apple, Microsoft) - down 0.6% for the week.
The proprietary Lowry's measure for US stock market Buying Power rose by 5 points last week to 139, resuming its position of dominance over that of US stock market Selling Pressure which fell by 10 points to 137 over the course of the week.
SPY, the S&P 500 Large Cap ETF, is made up of the stocks of the 500 largest US companies. It ended the week up 19.2% year-to-date and 4.7% below its all-time high (01/03/2022). SPY is above its 50-day and 90-day moving averages and is also above its long term trend line, with a RSI of 72***
IWM, the Russell 2000 Small Cap ETF, is made up of the bottom two-thirds in terms of company size of the group of the 3,000 largest US stocks. It ended the week up 2.9% year-to-date and 26.1% below its all-time high (11/05/2021). IWM is above its 50-day moving average but below its 90-day and is also below its long term trend line, with a RSI of 60***
*** RSI (Relative Strength Index) above 70: strong but technically overbought, RSI below 30: weak but technically oversold
The VIX, the commonly-accepted measure of expected upcoming stock market risk and volatility (often referred to as the “fear index”) implied by S&P 500 index option trading, ended the week 1.3 points (9%) lower at 12.5. It is below its 50-day and 90-day moving averages and is also below its long term trend line.
AVERAGE 30-YEAR FIXED RATE MORTGAGE ..
7.29%
One week ago: 7.44%, one month ago: 7.63%, one year ago: 6.58%
Data courtesy of: FRED Economic Data, St. Louis Fed as of Thursday of last week.
FEAR & GREED INDEX ..
“Be fearful when others are greedy and be greedy when others are fearful.” Warren Buffet.
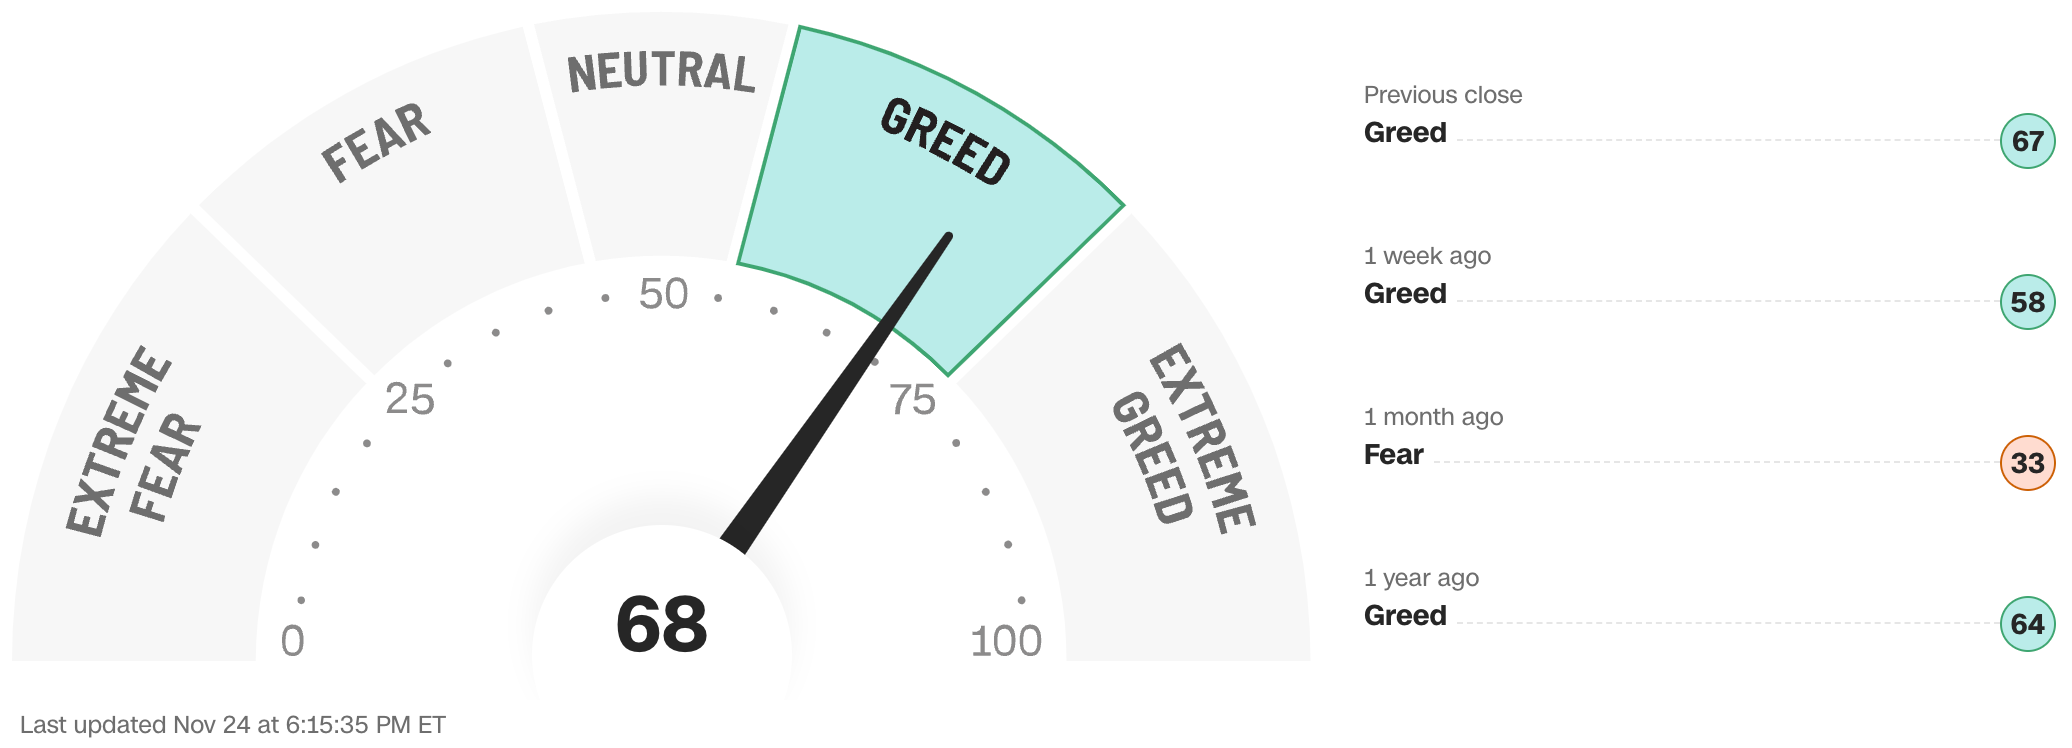
The Fear & Greed Index from CNN Business can be used as an attempt to gauge whether or not stocks are fairly priced and to determine the mood of the market. It is a compilation of seven different indicators that measure some aspect of stock market behavior. They are: market momentum, stock price strength, stock price breadth, put and call options, junk bond demand, market volatility and safe haven demand.
Extreme Fear readings can lead to potential opportunities as investors may have driven prices “too low” from a possibly excessive risk-off negative sentiment.
Extreme Greed readings can be associated with a sense of “FOMO” and investors chasing rallies in an excessively risk-on environment, possibly leaving the market vulnerable to a sharp downward correction at some point.
Data courtesy of CNN Business.
PERCENT OF S&P 500 STOCKS TRADING ABOVE THEIR LONG TERM MOVING AVERAGE (LTMA) ..
55% (274 of the 500 largest stocks in the U.S. ended last week above their LTMA and 226 were below)
One week ago: 51%, one month ago: 27%, one year ago: 60%
A closely-watched measure of market breadth and participation, providing a real-time look at how many of the largest 500 publicly-traded stocks in the U.S. are trending higher or lower, as defined by whether the stock price is above or below the 200-day moving average which is among the most widely-followed of all stock market technical indicators.
The higher the reading, the better the deemed health of the overall market.
US INVESTOR SENTIMENT (outlook for the upcoming 6 months) ..
↑Bullish: 45% (44% a week ago)
⬌ Neutral: 31% (28% a week ago)
↓Bearish: 24% (28% a week ago)
Net Bull-Bear spread: ↑Bullish by 21 (Bullish by 16 a week ago)
For context: Long term averages: Bullish: 38% — Neutral: 32% — Bearish: 30% — Net Bull-Bear spread: Bullish by 8
Weekly sentiment survey participants are typically polled on Tuesdays and/or Wednesdays.
Data courtesy of: American Association of Individual Investors (AAII).
FEDWATCH INTEREST RATE PREDICTION TOOL ..
Where will interest rates be at the end of 2023 (one more Fed decision day, on December 13th)?
⬌ Unchanged from now .. 96% probability
One week ago: 100%, one month ago: 75%
↑ Higher than now .. 4% probability
One week ago: 0%, one month ago: 25%
Data courtesy of CME FedWatch Tool. Based on the Fed Funds rate (currently 5.375%). Calculated from Federal Funds futures prices as of Friday.
US TREASURY INTEREST RATE YIELD CURVE ..

The interest rate yield curve remains unusually “inverted” (i.e. shorter term interest rates are generally higher than longer term ones) with the highest rate (5.56%) being paid currently for the 2-month duration and the lowest rate (4.47%) for the 10-year.
The closely-watched and most commonly-used comparative measure of the spread between the 2-year and the 10-year rose from 0.38% to 0.45%, indicating a steepening in the inversion of the curve during the last week.
Historically, an inverted yield curve is not the norm and has been regarded as a leading indicator of an impending recession, with shorter term risk deemed to be unusually higher than longer term. The steeper the inversion, the greater the deemed risk of recession.
The curve has been inverted since July 2022 based on the 2-year vs. 10-year spread.
Data courtesy of ustreasuryyieldcurve.com as of Friday. Lightly shaded area shows the current Federal Funds rate range.
WWW.ANGLIAADVISORS.COM | SIMON@ANGLIAADVISORS.COM | CALL OR TEXT: (929) 677 6774 | FOLLOW ANGLIA ADVISORS ON INSTAGRAM
This material represents a highly opinionated assessment of the financial market environment based on assumptions and prevailing data at a specific point in time and is always subject to change at any time. No warranty of its accuracy or completeness is given. It is never to be interpreted as an attempt to forecast any future events, nor does it offer any kind of guarantee of any future results, circumstances or outcomes.
The material contained herein is not necessarily complete and is wholly insufficient to be exclusively relied upon as research or investment advice or as a sole basis for any investment or other financial decisions. The user assumes the entire risk of any decisions made or actions taken based in whole or in part on any of the information provided in this or any Anglia Advisors communication of any kind. Under no circumstances is any of Anglia Advisors’ content ever intended to constitute tax, legal or medical advice and should never be taken as such. Neither the information contained or any opinion expressed herein constitutes a solicitation for the purchase of any security or asset class.
Posts may contain links or references to third party websites or may post data or graphics from them for the convenience and interest of readers. While Anglia Advisors may have reason to believe in the quality of the content provided on these sites, the firm has no control over, and is not in any way responsible for, the accuracy of such content nor for the security or privacy protocols that external sites may or may not employ. By making use of such links, the user assumes, in its entirety, any kind of risk associated with accessing them or making use of any information provided therein.
Those associated with Anglia Advisors, including clients with managed or advised investments, may maintain positions in securities and/or asset classes mentioned in this post.

If you enjoyed this post, why not share it with someone or encourage them to subscribe themselves?


