


Last week provided a perfect example of how you can create any narrative you like simply by cherry-picking data. The glass-is-half full crowd needed to look no further than central banks around the world last week starting the interest-rate cutting cycle, job openings data showing an orderly resumption of pre-COVID labor market normality backed up by stats showing unemployment at an economically-ideal 4% and over two-thirds of stocks now trading above their 200-day moving average.
Team Trouble Ahead could instead point to a scorching, out-of-control Jobs Report last week that is wrecking the Fed’s plans to lower interest rates any time soon in a stagnating economy, whispers of the need to raise rates instead of cutting them growing louder all the time and less than 50% of stocks now trading above their 50-day moving average.
Stocks fell early on Monday, helped lower by a report showing that U.S. factory activity shrank at a much faster pace than expected, indeed manufacturing output appears to have come close to stagnating. As the session wore on, however, prices slowly clawed their way back and a last-gasp surge meant the S&P 500 actually finished the day fractionally higher.
On Tuesday morning we learned from the latest Job Openings and Labor Turnover Survey (JOLTS) that the number of job openings in the U.S. fell to 8.06m, that’s 1.8m less than a year ago and its lowest level in over three years, implying a continuation of a Fed-friendly, slow-motion and relatively low-pain cooldown in the labor market.
Once upon a time not so long ago stocks might have been expected to immediately shift higher on the back of such data, but it was met with an indifferent shrug by Wall Street. Stock prices initially drifted a little lower then perked up a bit after lunch but there was little conviction either way and the market’s attention began to turn to Friday’s main event, the Jobs Report.
There was a lot of green on the screen on Wednesday partly as a bit of a delayed reaction to Tuesday’s pro-Fed-interest-rate-cut JOLTS data and partly on the back of a rather surprising actual rate cut from the Bank of Canada (BOC), the first of the big global central banks to start an interest rate reduction cycle. Business borrowing conditions continued easing as Treasury interest rates fell for the fifth day in a row and stocks sprang sharply back into all-time record high territory again for both the S&P 500 and the NASDAQ.
On Thursday morning the European Central Bank (ECB) followed the BOC’s lead with its own widely-anticipated first interest rate cut since 2019 to 3.75% -widening the margin by which it is lower than the Fed’s rate to 1.625%. U.S. stock prices returned to snooze mode ahead of the important jobs data the next day and basically went nowhere the entire session.
On Friday morning, the Jobs Report proved to be a confusing mess for the Fed. Payrolls smashed through estimates with a jaw-dropping 272k (average estimate: 180k) new jobs created in May but the unemployment rate rose to 4.0% for the first time since late 2021 (average estimate: 3.9%). The rate of annual wage growth increased by a higher-than-expected 0.4% in May to 4.1% annualized.
This all raised questions about whether the Fed’s interest rate policy is biting hard enough in terms of its goal of cooling the labor market, in turn handing a big “I Told You So” to that still-small but growing group who see a scenario of the next Fed move having to be an increase rather than a cut in interest rates. The last dregs of a market-driven probability of a rate cut in July evaporated completely and the likelihood of a rate cut before the election fell below 50/50 for the first time.
Once again the stock market did not react as one might have expected. Instead of plunging, it rather uncharacteristically took the report mostly in its stride, remaining reasonably calm even though Treasury interest rates spiked back, ending the session with relatively tame losses, all things considered and the S&P 500 and NASDAQ maintained their gains for the week.
The Q2 earnings season is all but over and the general sentiment is that things were “fine”. However, beyond the glitzy releases from the Fab Five, you can find signs of froth if you are looking for them. U.S. public companies are the absolute best in the world at controlling costs and maintaining margins and it was really this superpower that caused Q2 to be regarded in a good light, rather than overwhelming evidence of solid aggregate demand.
Over the past few weeks, we’ve seen numerous companies from multiple industries post disappointing results and projections on a combination of underwhelming sales and margins. The number of companies expressing concerns on earnings calls about reduced demand or a more discerning consumer is rising quickly.
This, of course feeds into the absolute biggest concern for financial markets .. a sudden sharp economic slowdown that has not in any way been factored in to where stock prices currently sit.
None of this means that the S&P 500 can’t run up another 5%-10% if we get good vibes from Jerome Powell this week after the do-nothing June Fed meeting, evidence that inflation has resumed its downward trajectory in the Consumer Price Index (CPI) measure of retail inflation, a drop in Treasury yields and continued bottomless AI enthusiasm but the evidence of slowing growth is increasing on both the macro- and micro-economic fronts and I personally think markets are being a bit too complacent about it.
OTHER NEWS ..
A Wild Ride .. Nvidia rose over 5% on Wednesday, briefly becoming the world’s second-largest company ahead of Apple and behind Microsoft and also became just the third company ever to break through the $3 trillion ($3,000,000,000,000) valuation level just three months after first topping $2 trillion. However, a government announcement the following day of an anti-trust investigation into the firm saw the valuation then dip back down to below both that of Apple and the $3T level.
Buyers Aren’t Standing For It Any More .. The U.S. housing market - long crippled by an inventory drought - is finally starting to see listings rise after what has essentially been a revolt among potential homebuyers brought about by both mortgage rates and prices showing no signs of moving lower. In many places, buyers just aren’t showing up any more. Previously-spoiled sellers are grappling with demand being choked off during what’s typically the hot season. As inventory grows stale, more owners are being forced to cut their asking prices than at any time since November 2022, according to Redfin Corp.
He’s Baaaaack .. Meanwhile in the tiresome world of meme stocks, the highly anticipated YouTube livestream from the High Priest of Meme, Keith “Roaring Kitty” Gill on Friday lasted 48 minutes with beer, props, awkward attempts at humor and stock charts and had as many as 650k people watching at its peak. GameStop shares promptly tanked 40% and trading was halted by the exchange 17 times after the firm decided to drop an unexpected earnings report showing a 30% plunge in sales revenue and announced a share-sale plan. Oh dear.
ARTICLE OF THE WEEK ..
Want to Pay Cash? That’ll Cost You Extra
THIS WEEK’S UPCOMING CALENDAR ..
It will be a huge week on the macroeconomic and monetary policy fronts.
The Consumer Price Index (CPI) measure of retail inflation for May comes out pre-market on Wednesday morning. just hours before the Fed announces its June meeting interest rate decision at 2pm ET swiftly followed by chairman Jerome Powell’s press conference. Markets are overwhelmingly pricing in no chance of a change in the committee's federal-funds interest rate target.
The following day, we get the Producer Price Index (PPI) measure of wholesale inflation experienced by manufacturers.
We will hear from the Bank of Japan about its interest rate decision on Friday.
Oracle, Broadcom and Adobe will report earnings this week. Apple will host its annual developers' conference on Monday.
LAST WEEK BY THE NUMBERS ..
Last week’s market color courtesy of finviz.com
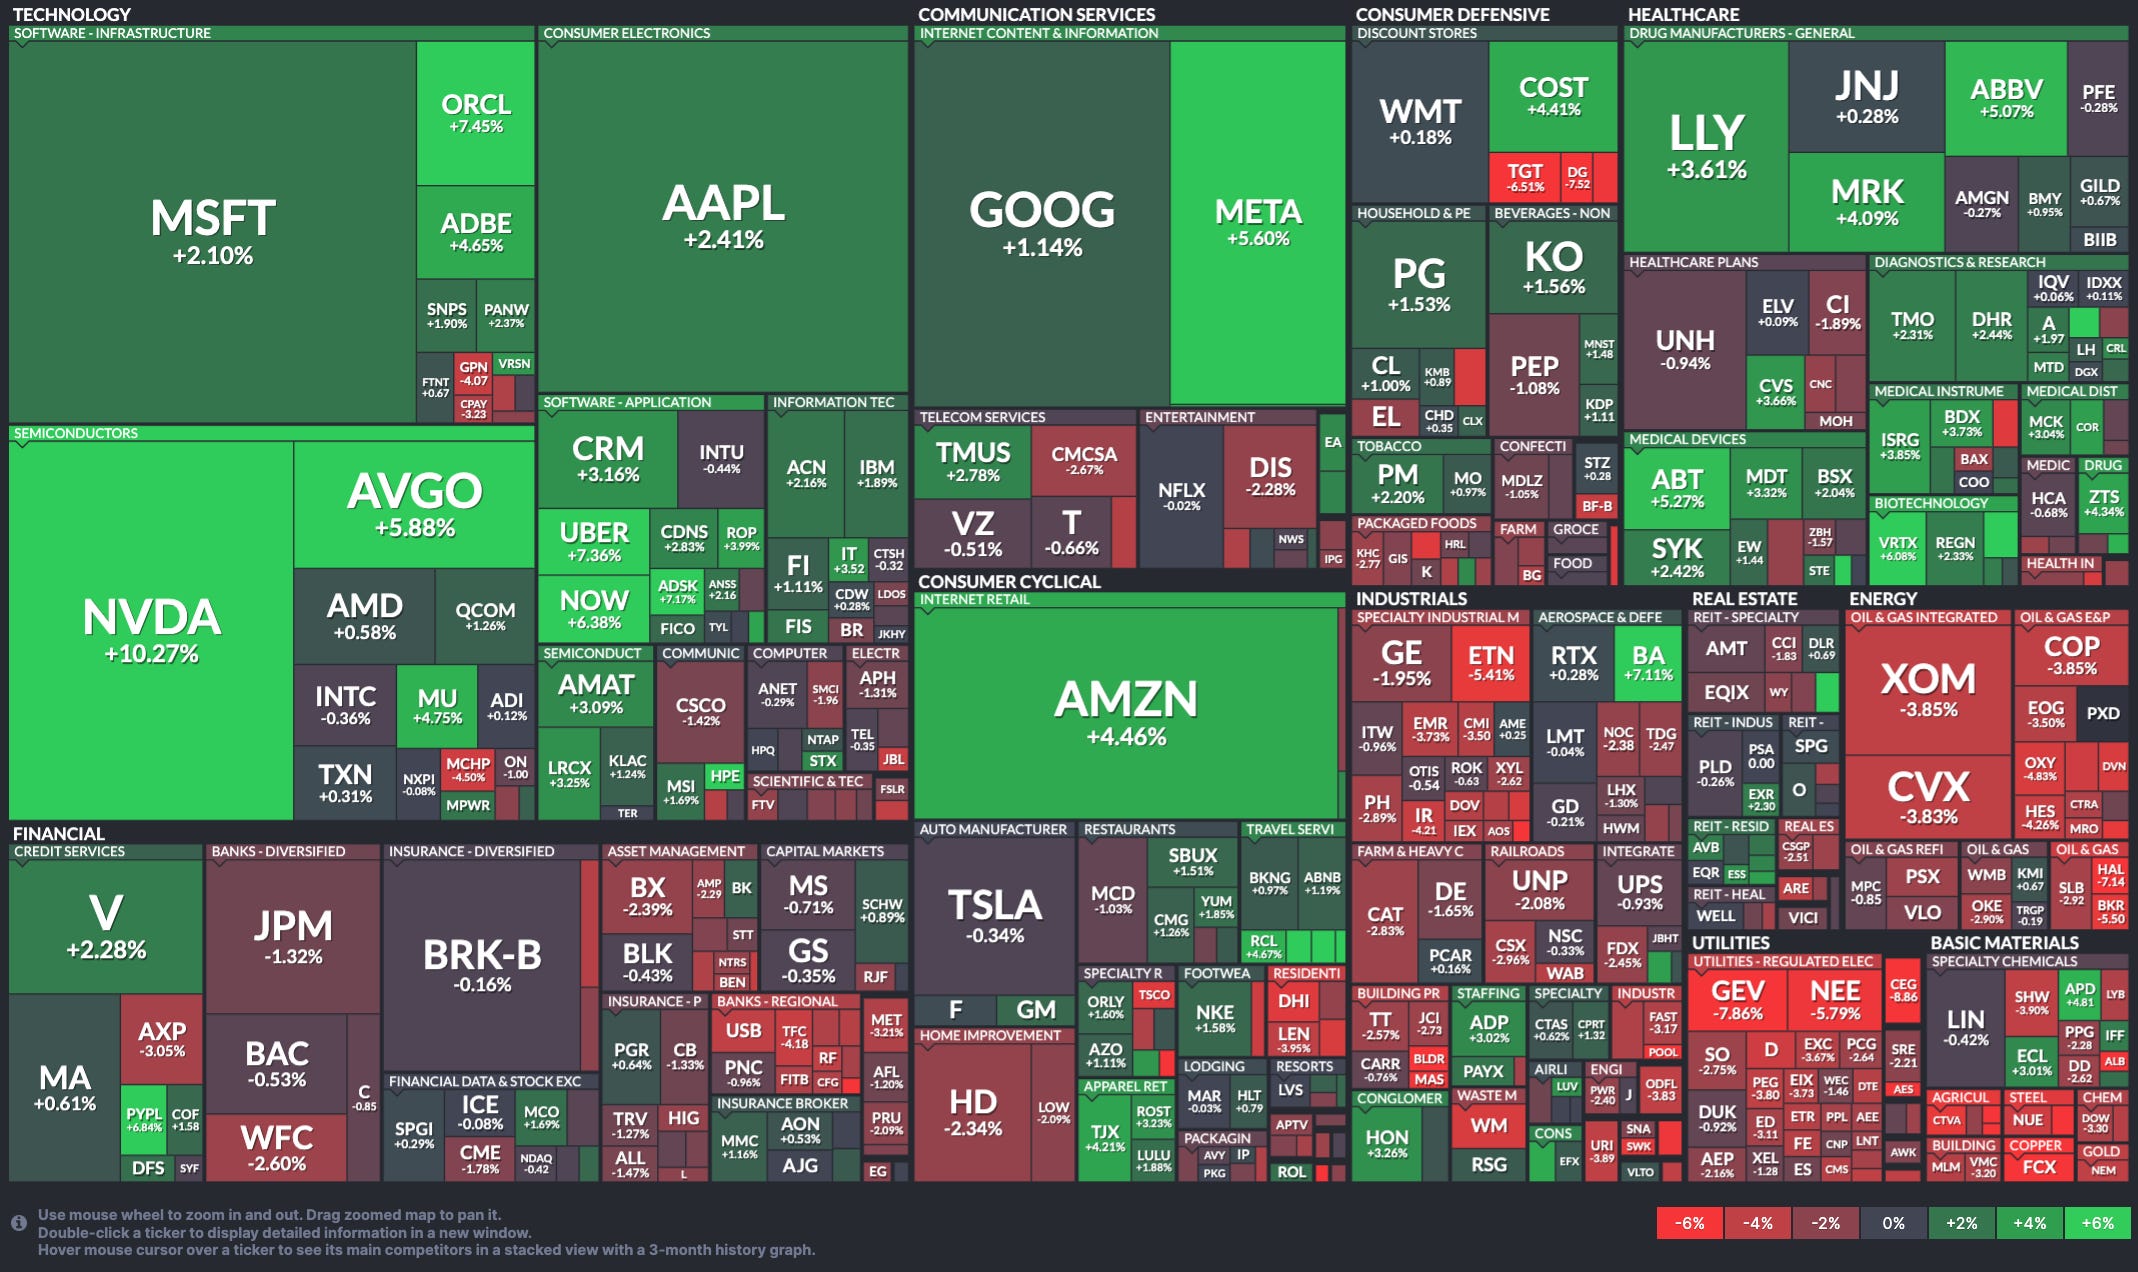
Last week’s best performing U.S. sector: Technology (two biggest holdings: Microsoft, Apple) - up 2.4% for the week.
Last week’s worst performing U.S. sector: Utilities (two biggest holdings: NextEra Energy, Southern Co.) - down 3.8% for the week.
SPY, the S&P 500 Large Cap ETF, tracks the S&P 500 index, made up of 500 stocks from among the largest U.S. companies. Its price rose 1.1% last week, is up 12.4% so far this year and ended the week 0.1% below its all-time record high (06/06/2024).
IWM, the Russell 2000 Small Cap ETF, tracks the Russell 2000 index, made up of the bottom two-thirds in terms of company size of a group made up from among 3,000 largest U.S. stocks. Its price fell 2.4% last week, is up 0.2% so far this year and ended the week 17.0% below its all-time record high (11/08/2021).
DXY, the U.S. Dollar index, is an index that measures the value of the U.S. Dollar against a weighted basket of six other major currencies (the Euro, the Japanese Yen, the British Pound, the Canadian Dollar, the Swedish Krone and the Swiss Franc). It rose 0.9% last week, is up 3.5% so far this year and is up 16.6% over the last three years.
AVERAGE 30-YEAR FIXED MORTGAGE RATE ..
6.99%
One week ago: 7.03%, one month ago: 7.09%, one year ago: 6.71%
Data courtesy of: FRED Economic Data, St. Louis Fed as of last Thursday.
FEAR & GREED INDEX ..
“Be fearful when others are greedy and be greedy when others are fearful.” Warren Buffet.
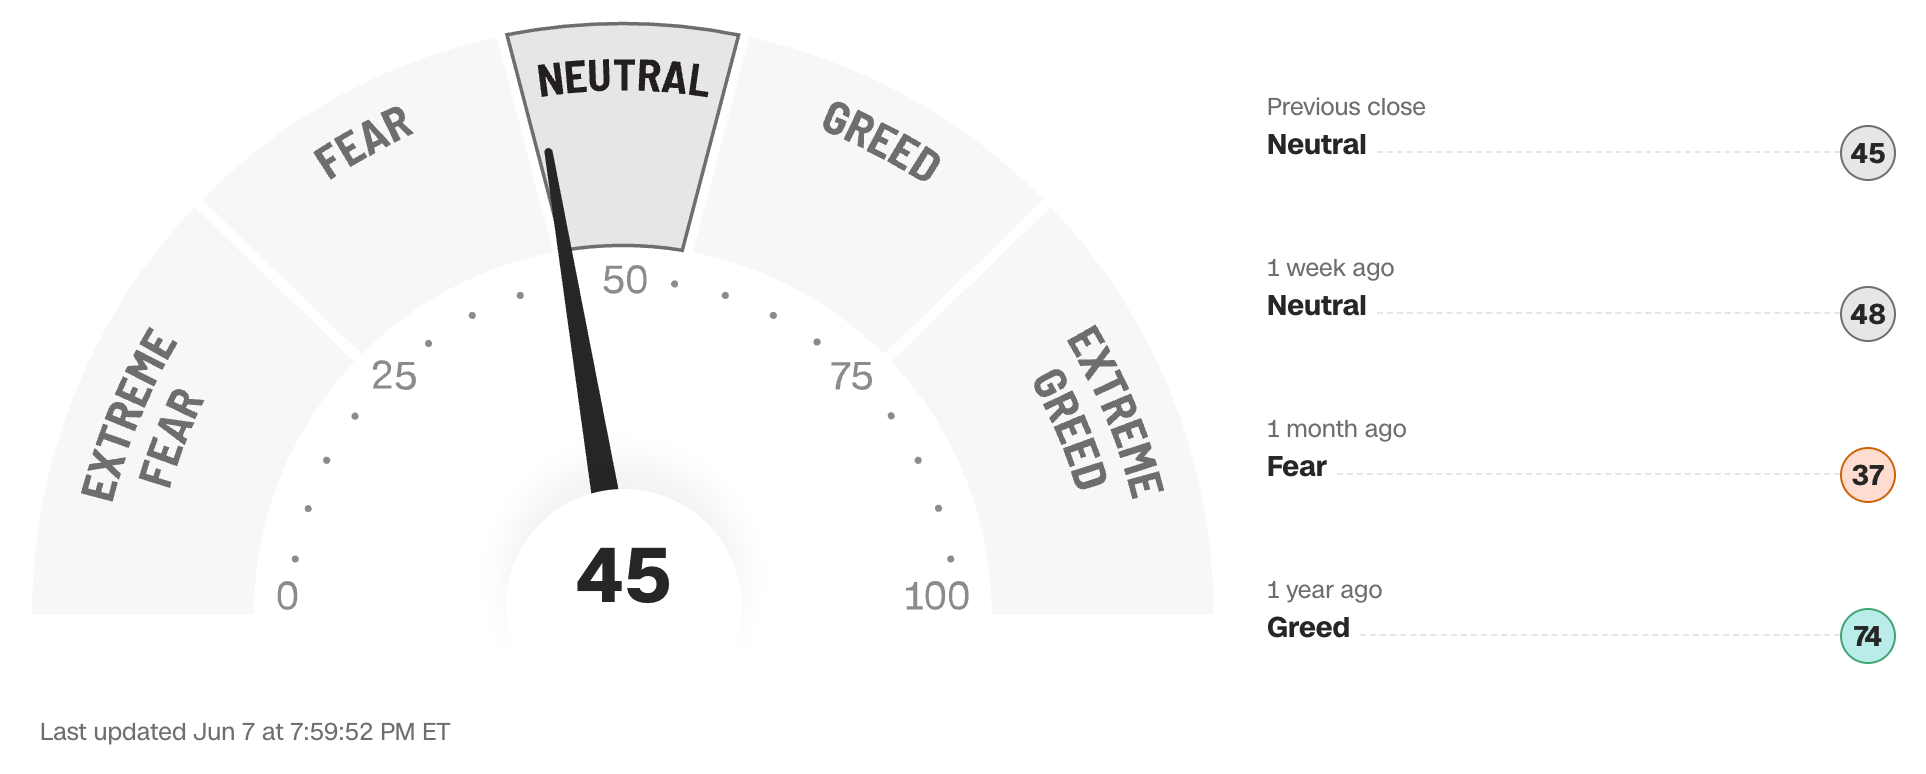
The Fear & Greed Index from CNN Business can be used as an attempt to gauge whether or not stocks are fairly priced and to determine the mood of the market. It is a compilation of seven of the most important indicators that measure different aspects of stock market behavior. They are: market momentum, stock price strength, stock price breadth, put and call option ratio, junk bond demand, market volatility and safe haven demand.
Extreme Fear readings can lead to potential opportunities as investors may have driven prices “too low” from a possibly excessive risk-off negative sentiment.
Extreme Greed readings can be associated with possibly too-frothy prices and a sense of “FOMO” with investors chasing rallies in an excessively risk-on environment . This overcrowded positioning leaves the market potentially vulnerable to a sharp downward reversal at some point.
A “sweet spot” is considered to be in the lower-to-mid “Greed” zone.
Data courtesy of CNN Business as of Friday’s market close.
FEDWATCH INTEREST RATE TOOL ..
Will interest rates be lower than they are now after the Fed’s next meeting on June 12th?
Yes .. 2% probability (1% a week ago)
No .. 98% probability (99% a week ago)
Will interest rates be lower than they are now after the Fed’s following meeting on July 31st?
Yes .. 8% probability (14% a week ago)
No .. 92% probability (86% a week ago)
Where is the Fed Funds interest rate most likely to be at the end of 2024?
5.125% (0.25% lower than where we are now, implying one rate cut before the end of 2024)
One week ago: 5.125% (implying one rate cut), one month ago: 4.875% (implying two rate cuts)
All data based on the Fed Funds rate (currently 5.375%). Calculated from Federal Funds futures prices as of the market close on Friday. Data courtesy of CME FedWatch Tool.
The 50-day moving average of the S&P 500 remains above the 200-day. This is a continued indication of an ongoing technical uptrend.
% OF S&P 500 STOCKS TRADING ABOVE THEIR 50-DAY MOVING AVERAGE ..
48% (241 of the S&P 500 stocks ended last week above their 50D MA and 259 were below)
One week ago: 50%, one month ago: 57%, one year ago: 50%
% OF S&P 500 STOCKS TRADING ABOVE THEIR 200-DAY MOVING AVERAGE ..
67% (334 of the S&P 500 stocks ended last week above their 200D MA and 166 were below)
One week ago: 71%, one month ago: 76%, one year ago: 53%
Closely-watched measures of market breadth and participation, providing a real-time look at how many of the S&P 500 index stocks are trending higher or lower, as defined by whether the stock price is above or below their more sensitive 50-day (short term) and less sensitive 200-day (long term) moving averages which are among the most widely-followed of all stock market technical indicators.
The higher the reading, the better the deemed health of the overall market trend, with 50% considered to be a key pivot point. Readings above 90% or below 15% are extremely rare.
WEEKLY US INVESTOR SENTIMENT (outlook for the upcoming 6 months) ..
↑Bullish: 39% (39% a week ago)
⬌ Neutral: 29% (34% a week ago)
↓Bearish: 32% (27% a week ago)
Net Bull-Bear spread: ↑Bullish by 7 (Bullish by 12 a week ago)
For context: Long term averages: Bullish: 38% — Neutral: 32% — Bearish: 30% — Net Bull-Bear spread: Bullish by 8
Survey participants are typically polled during the first half of the week.
Data courtesy of: American Association of Individual Investors (AAII).
HIGH YIELD CREDIT SPREAD ..
3.20%
One week ago: 3.19%, one month ago: 3.14%, one year ago: 4.29%
This closely-watched spread is a strong indicator of the risk inherent in the professional marketplace and the extent to which such risk is growing or easing. The high-yield credit spread is the difference between the interest rates offered for riskier low-grade, high yield (“junk”) bonds and those for stable high-grade, lower yield bonds, including deemed risk-free government bonds, of similar maturity.
A reading that is high/increasing indicates that “junkier” bond issuers are being forced to move their yields higher to compensate for a greater risk of default and is considered to be a reflection of broadly deteriorating economic and market conditions which could well lead to lower stock prices.
A reading that is low/decreasing indicates a reduced necessity for higher yields. This reflects less prevailing market risk and more stable or improving conditions in the overall economy and for stock prices.
For context .. this reading was regularly below 3.00% for much of the 1990s, got as high as 10.59% after 9/11 and the subsequent Dotcom Crash of 2002, peaked at 21.82% in the Great Financial Crisis in December 2008 and spiked from 3.62% to 10.87% in the space of about a month during the February/March 2020 COVID crash. The historical average since 1996 is a little over 4.00%.
Data courtesy of: FRED Economic Data, St. Louis Fed as of Friday’s market close.
US TREASURY INTEREST RATE YIELD CURVE ..
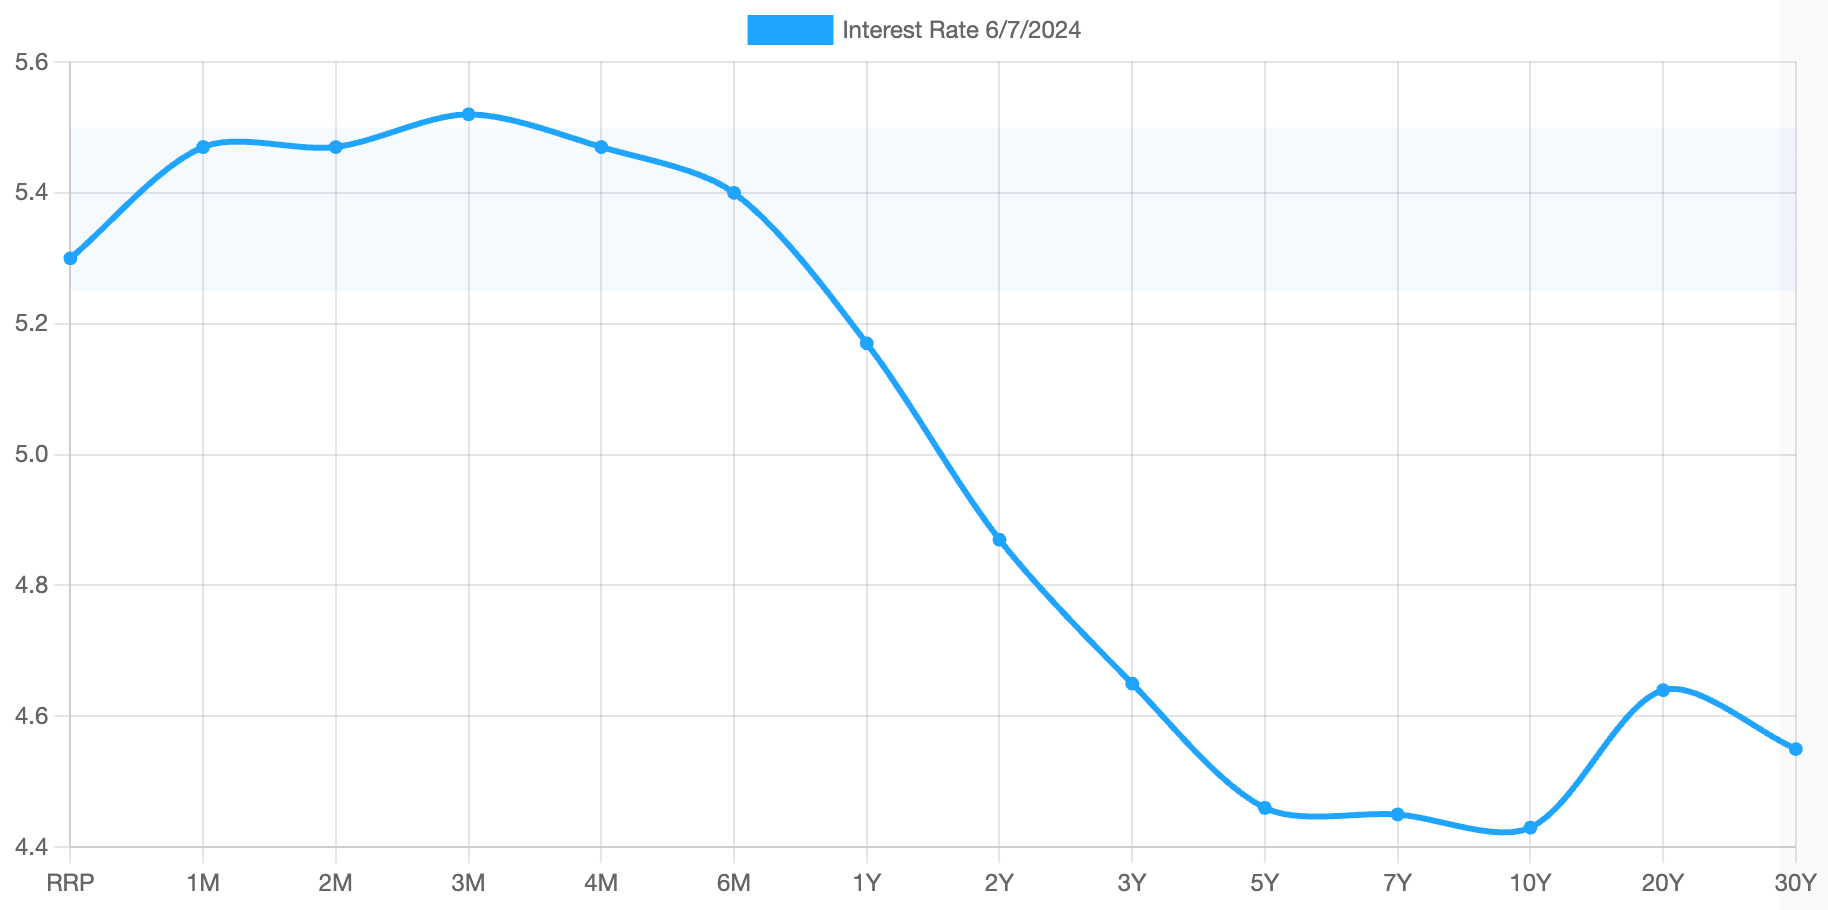
The highest rate on the yield curve (5.52%) is being paid for the 3-month duration and the lowest rate (4.43%) is for the 10-year.
The most closely-watched and commonly-used comparative measure of the spread between the higher 2-year and the lower 10-year rose from 0.37% to 0.44%, indicating a steepening in the inversion of the curve last week.
The interest rate yield curve remains unusually “inverted” (i.e. shorter term interest rates are generally higher than longer term ones). Based on the 2-year vs. 10-year spread, the curve has been inverted since July 2022.
Historically, an inverted yield curve is not the norm and has been regarded by many as a leading indicator of an impending recession, with shorter term risk regarded to be unusually higher than longer term. The steeper the inversion, the greater the deemed risk of recession.
Data courtesy of ustreasuryyieldcurve.com as of Friday. The lightly shaded area on the chart shows the current Federal Funds rate range.
WWW.ANGLIAADVISORS.COM | SIMON@ANGLIAADVISORS.COM | CALL OR TEXT: (646) 286 0290 | FOLLOW ANGLIA ADVISORS ON INSTAGRAM
This material represents a highly opinionated assessment of the financial market environment based on assumptions and prevailing data at a specific point in time and is always subject to change at any time. Although the content is believed to be correct at the time of publication, no warranty of its accuracy or completeness is given. It is never to be interpreted as an attempt to forecast any future events, nor does it offer any kind of guarantee of any future results, circumstances or outcomes.
The material contained herein is not necessarily complete and is wholly insufficient to be exclusively relied upon as research or investment advice or as a sole basis for any investment or other financial decisions. The user assumes the entire risk of any decisions made or actions taken based in whole or in part on any of the information provided in this or any Anglia Advisors communication of any kind. Under no circumstances is any of Anglia Advisors’ content ever intended to constitute tax, legal or medical advice and should never be taken as such. Neither the information contained or any opinion expressed herein constitutes a solicitation for the purchase of any security or asset class. No advice may be rendered by Anglia Advisors unless or until an executed Client Engagement Agreement is in place.
Posts may contain links or references to third party websites or may post data or graphics from them for the convenience and interest of readers. While Anglia Advisors might have reason to believe in the quality of the content provided on these sites, the firm has no control over, and is not in any way responsible for, the accuracy of such content nor for the security or privacy protocols that external sites may or may not employ. By making use of such links, the user assumes, in its entirety, any kind of risk associated with accessing them or making use of any information provided therein.
Those associated with Anglia Advisors, including clients with managed or advised investments, may maintain positions in securities and/or asset classes mentioned in this post.

If you enjoyed this post, why not share it with someone or encourage them to subscribe themselves?


