


The stock market was open on Monday although the bond market wasn’t and it had its first chance to react to the latest flare up of the conflict in Israel and Palestine that broke out over the weekend. Wall Street tries to frame everything in dollars and cents, because, well, that’s its job - but it can often appear a little dazed and confused when it comes to having to suddenly price in geopolitical risk.
After a predictable dip at the open, stocks recovered to push into positive territory by the close, driven higher not only by bouncing from an over-sold position, but also by the market’s attention being caught by suggestions from Fed officials that the bond market may actually be doing their job for them by driving interest rates higher - the interpretation being that no more rate hikes may be needed from the central bank. Gold and oil prices both shifted higher on the onslaught of news coming out of the Middle East.
The feel-good factor continued into Tuesday as stocks powered higher on the back of more Fed chatter talking down the need for further interest rate increases. Traders also began to position themselves in front of Thursday’s latest inflation figures. As always when stocks move higher from being oversold, momentum was turbocharged by both BTFD’ers and algorithmic and program trading.
Wednesday was quietly positive. The main event of the day was the release of the minutes of the most recent Fed interest rate committee meeting. The main takeaway was that Fed officials now see their policies to be “restraining the economy as intended.” Another up-day for most stock indexes as this apparent central bank mood was deemed to make further Fed interest rate hikes even ess likely.
When the all-important Consumer Price Index (CPI) measure of retail inflation dropped pre-market on Thursday morning, we learned that inflation rose 0.4% from August to September, slightly more than the expected 0.3% pace, while the Core rate excluding food and energy came in right at the 0.3% that was projected. The headline inflation rate remained unchanged at 3.7% annualized, but the (more important, as far as the Fed is concerned) Core version fell to 4.1%, its lowest in two years. Housing-related costs are proving to be particularly stubborn.
While these numbers didn’t move the needle much in terms of expectations (or lack of them) about a rate increase at the next Fed meeting (see FEDWATCH INTEREST RATE PREDICTION TOOL below), the apparent stickiness of inflation (also indicated by the previous day’s Producer Price Index (PPI) measure of wholesale inflation experienced by manufacturers) did seem to bolster the “higher for longer” interest rate case (fewer and more delayed rate cuts in 2024 than the market has yet priced in) and stocks gave back much of the week’s gains, with Small Caps particularly hard hit.
The world may be falling apart, but the kick-off to Q3 earnings season on Friday showed that banks are still able to make good money. JP Morgan Chase (JPM), Citigroup (C) and Wells Fargo (WFC) all reported positively. The broad stock market, however, meandered aimlessly lower throughout the day, but the S&P 500 just about managed to eke out a fractional gain for the week.
The baseline is still for the Fed to hold rates steady for the rest of the year but non-negligible risks of another rate hike do exist, although the market is still choosing to disregard this risk right now which will make the reaction more violent if it does come to pass.
It always helps to remain focused on the overarching drivers of the markets, and for right now that is still the “Three Pillars of the Rally” that I always talk about (1. No Landing / Soft Landing, 2. Disinflation, 3. Fed Done/Almost Done with Rate Hikes). While these three underlying supports for stocks remain in place the market could well remain largely rangebound within, generally speaking, the 4200-4500 range for the S&P 500. In mid September, the index was at the upper end of that range, trading around 4500. Recently, the S&P 500 has traded down towards the bottom of that range, nearer to 4200.
Aside from U.S. government bonds starting to trade like effing GameStop, not much else has changed. Economic growth remains solid, there are still signs inflation is declining and the Fed is still done, or almost done, with rate hikes. S&P 500 above 4500 seems unsustainable with market interest rates where they are but equally below 4200 is not justified by any data and the still-healthy state of the Three Pillars. So we may be saddled with bouncing around within this range until something breaks.
Forced to choose, I’d say that the list of what can go wrong to break us out of this range to the downside (continued yield spikes, growth slowing significantly, inflation bounce back, more rate hikes, geopolitical shock, oil price surge, banking stress) seems to be a little more on the cards then the list of what could go right to break us north through the upside (more and more Goldilocks data, immaculate disinflation, geopolitical surprise, Fed officially signals that it’s done raising rates).
OTHER NEWS ..
And Another Crypto Demi-God Is Behind Bars .. Three Arrows Capital co-founder Su Zhu is in jail in Singapore after local authorities lost patience following months of stalling and sparring over locating the failed crypto hedge fund’s customer assets. Following a tip-off off that Zhu was headed to Changi Airport from his luxury mansion famous for its lavish parties, they moved in and nabbed him.
Zhu and fellow co-founder Kyle Davies are among the one-time darlings of crypto’s pandemic-era bull run whose reputations subsequently suffered as boom turned to bust, exposing risky practices and widespread fraud.
Three Arrows imploded in 2022 as leveraged bets blew up, starting a $2 trillion crypto rout that contributed to a spate of other collapses in the sector including Sam Bankman-Fried’s FTX. Zhu and Davies are accused of failing to cooperate with the probe into the collapse and authorities are seeking to recover $1.3 billion from the two.
Trouble In The Happiest Place On Earth .. Disney (DIS) hiked streaming prices yet again on Thursday as the company continues to grapple with poor profitability and collapsing subscriber numbers. The price increases are the second so far this year and impact the monthly price of the company's ad-free Disney+ and Hulu plans in addition to its ESPN+ subscription.
As a result of the hikes, the price of the Disney+ ad-free plan jumped to $13.99 a month in the US, up from the prior $10.99. That's now double the $6.99 monthly cost Disney charged for the service when it first launched in 2019.
Drown Your Sorrows In Style .. Looking for one of the world’s top bars but can’t get there? Don’t worry. The World’s 50 Best Bars has your back and made a second, less vaunted list offering rankings 51-100. Entries include Martiny’s in New York and there’s even a place in Albania: Nouvelle Vague in Tirana.
UNDER THE HOOD ..
The S&P 500 index SPX closed on Friday at 4328, up a fraction for the week. The next upside resistance points are to be found at 4370, 4425 and 4460. Downside support levels are at 4305, 4282 and 4260.
The overall, longer term trend in the major indexes just about remains to the upside, but beneath the surface, its health leaves a lot to be desired. Basically, this bull market is not checking all the boxes, but conditions still just about remain more bullish than bearish.
The ratio of the performance of Small Cap stocks vs Large Cap ones has reached a multi-year low and is currently below its low even at the height of the pandemic in 2020. What this tells us is that investors prefer owning larger stocks, which theoretically carry lower risk than smaller ones.
I know I keep banging on about it, but here we go again .. such risk aversion to smaller stocks, especially during a bullish trend such as we have experienced since October 2022, is not at all typical of a healthy and sustainable advance for the entire stock market.
Early last week buyers finally appeared to begin taking interest in short-term oversold conditions, although caution remains advised until these buyers fully respond in a more indiscriminate way.
Anglia Advisors clients are welcome to reach out to me to discuss market conditions further.
THIS WEEK’S UPCOMING CALENDAR ..
Earnings this week from Netflix, Tesla, Proctor & Gamble, Bank of America, Goldman Sachs Group, AT&T, Johnson & Johnson, Lockheed Martin, American Express, Charles Schwab, Taiwan Semiconductor, United Airlines, American Airlines, Travelers and more.
Retail sales for September and the Leading Economic Index will be highlights on the economic data front.
In housing, we will learn about the latest Housing Market Index, Housing Starts and Existing Home Sales.
LAST WEEK BY THE NUMBERS ..
Last week’s market color courtesy of finviz.com

Last week’s best performing US sector: Utilities (two biggest holdings: NextEra Energy, Southern Co.) - up 2.6% for the week.
Last week’s worst performing US sector: Consumer Cyclical (two biggest holdings: Amazon, Tesla) for the second week in a row - down 1.1% for the week.
The proprietary Lowry's measure for US stock market Buying Power fell by 3 points last week to 116 and that of US stock market Selling Pressure rose by 1 point to 158 over the course of the week.
SPY, the S&P 500 Large Cap ETF, is made up of the stocks of the 500 largest US companies. It is below its 50-day and 90-day moving averages but above its long term trend line, with a RSI of 46***. SPY ended the week 9.7% below its all-time high (01/03/2022).
IWM, the Russell 2000 Small Cap ETF, is made up of the bottom two-thirds in terms of company size of the group of the 3,000 largest US stocks. It is below its 50-day and 90-day moving averages and also below its long term trend line, with a RSI of 33***. IWM ended the week 29.8% below its all-time high (11/05/2021).
*** RSI (Relative Strength Index) above 70: technically overbought, RSI below 30: technically oversold
The VIX, the commonly-accepted measure of expected upcoming stock market risk and volatility (often referred to as the “fear index”) implied by S&P 500 index option trading, ended the week 1.5 points higher at 19.3. It is above its 50-day and 90-day moving averages and also above its long term trend line.
AVERAGE 30-YEAR FIXED RATE MORTGAGE ..
7.57%
One week ago: 7.49%, one month ago: 7.18%, one year ago: 6.92%
Data courtesy of: FRED Economic Data, St. Louis Fed as of Thursday of last week.
GROWTH ESTIMATE FOR THE CURRENT QUARTER GDP ..
Q3: +5.1%
Previous quarters .. Q2: +2.1% .. Q1: +2.0%
This data comes from the Atlanta Fed’s GDPNow model “now-cast”, which is a running algorithmic estimate of real seasonally-adjusted GDP growth for the current measured quarter based on multiple data points as they are released.
FEAR & GREED INDEX ..
“Be fearful when others are greedy and be greedy when others are fearful.” Warren Buffet.

The Fear & Greed Index from CNN Business can be used as an attempt to gauge whether or not stocks are fairly priced and to determine the mood of the market. It is a compilation of seven different indicators that measure some aspect of stock market behavior. They are: market momentum, stock price strength, stock price breadth, put and call options, junk bond demand, market volatility and safe haven demand.
Extreme Fear readings can lead to potential opportunities as investors may have driven prices “too low” from a possibly excessive risk-off negative sentiment.
Extreme Greed readings can be associated with a sense of “FOMO” and investors chasing rallies in an excessively risk-on environment, possibly leaving the market vulnerable to a sharp downward correction at some point.
Data courtesy of CNN Business.
US INVESTOR SENTIMENT (outlook for the upcoming 6 months) ..
↑Bullish: 40% (30% a week ago)
⬌ Neutral: 23% (28% a week ago)
↓Bearish: 37% (42% a week ago)
Net Bull-Bear spread: ↑Bullish by 3 (Bearish by 12 a week ago)
For context: Long term averages: Bullish: 38% — Neutral: 32% — Bearish: 30% — Net Bull-Bear spread: Bullish by 8
Weekly sentiment survey participants are typically polled on Tuesdays and/or Wednesdays.
Data courtesy of: American Association of Individual Investors (AAII).
FEDWATCH INTEREST RATE PREDICTION TOOL ..
What will the Fed announce re: any interest rate change on November 1st after its next meeting?
⬌ No change .. 94% probability
One week ago: 89%, one month ago: 63%
↑ 0.25% increase .. 6% probability
One week ago: 11%, one month ago: 37%
Where will interest rates be at the end of 2023?
⬌ Unchanged from now .. 70% probability
One week ago: 57%, one month ago: 60%
↑ Higher than now .. 30% probability
One week ago: 43%, one month ago: 40%
Data courtesy of CME FedWatch Tool. Based on the Fed Funds rate (currently 5.375%). Calculated from Federal Funds futures prices as of Friday.
US TREASURY INTEREST RATE YIELD CURVE ..
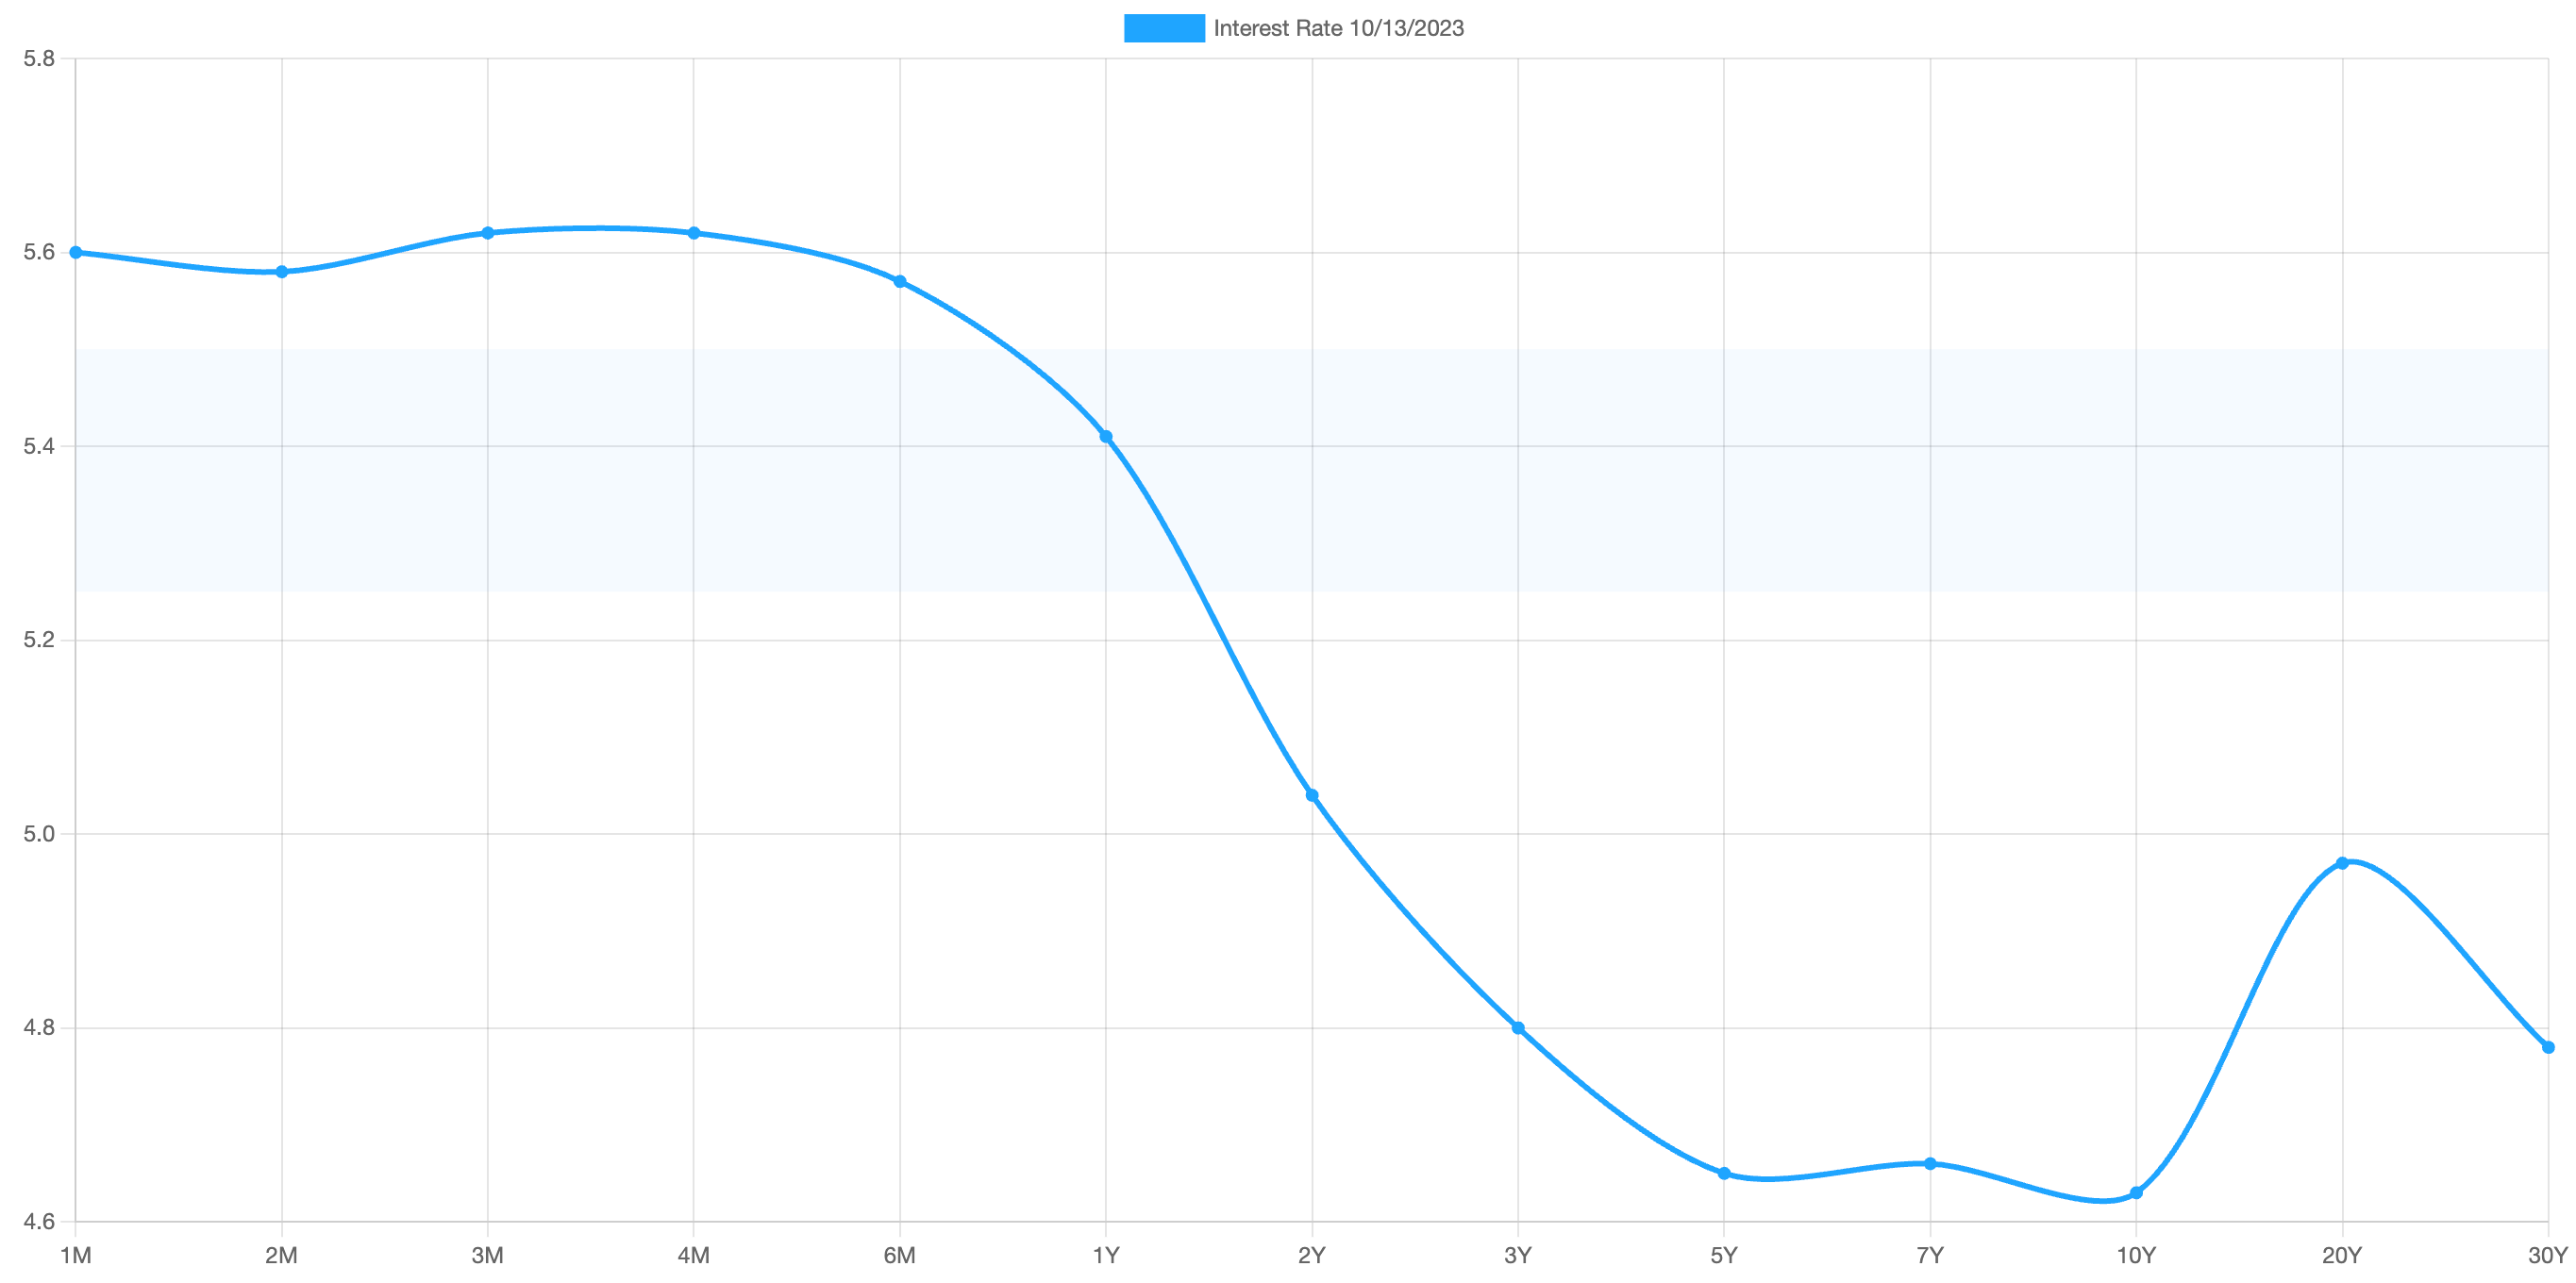
The interest rate yield curve remains “inverted” (i.e. shorter term interest rates are generally higher than longer term ones) with the highest rate (5.62%) being paid currently for the 4-month duration and the lowest rate (4.63%) for the 10-year.
The closely-watched and most commonly-used comparative measure of the spread between the 2-year and the 10-year rose from 0.30% to 0.41%, indicating a steepening in the inversion of the curve during the last week.
Historically, an inverted yield curve has been regarded as a leading indicator of an impending recession, with shorter term risk deemed to be unusually higher than longer term. The steeper the inversion, the greater the deemed risk of recession.
The curve has been inverted since July 2022 based on the 2 year vs. 10 year spread.
Data courtesy of ustreasuryyieldcurve.com as of Friday. Light shaded area shows the current Federal Funds rate range.
ARTICLE OF THE WEEK ..
WWW.ANGLIAADVISORS.COM | SIMON@ANGLIAADVISORS.COM | CALL OR TEXT: (929) 677 6774 | FOLLOW ANGLIA ADVISORS ON INSTAGRAM
This material represents a highly opinionated assessment of the financial market environment based on assumptions and prevailing data at a specific point in time and is always subject to change at any time. No warranty of its accuracy or completeness is given. It is never to be interpreted as an attempt to forecast any future events, nor does it offer any kind of guarantee of any future results, circumstances or outcomes.
The material contained herein is not necessarily complete and is wholly insufficient to be exclusively relied upon as research or investment advice or as a sole basis for any investment or other financial decisions. The user assumes the entire risk of any decisions made or actions taken based in whole or in part on any of the information provided in this or any Anglia Advisors communication of any kind. Under no circumstances is any of Anglia Advisors’ content ever intended to constitute tax, legal or medical advice and should never be taken as such. Neither the information contained or any opinion expressed herein constitutes a solicitation for the purchase of any security or asset class.
Posts may contain links or references to third party websites or may post data or graphics from them for the convenience and interest of readers. While Anglia Advisors may have reason to believe in the quality of the content provided on these sites, the firm has no control over, and is not in any way responsible for, the accuracy of such content nor for the security or privacy protocols that external sites may or may not employ. By making use of such links, the user assumes, in its entirety, any kind of risk associated with accessing them or making use of any information provided therein.
Those associated with Anglia Advisors, including clients with managed or advised investments, may maintain positions in securities and/or asset classes mentioned in this post.

If you enjoyed this post, why not share it with someone or encourage them to subscribe themselves?


