


There are three main factors that have propelled the S&P 500 higher in 2024 .. i) solid economic data, ii) impending Federal Reserve interest rate cuts, and iii) AI enthusiasm. Last week provided challenges for all three of those narratives. With key earnings reports, central bank interest rate decisions taking place in Washington DC, London and Tokyo and a pivotal Jobs Report, it always looked like it was going to be a highly volatile week. From that perspective at least, it didn’t disappoint.
Stocks cautiously meandered around with no real purpose on Monday and ended up essentially unchanged, with traders acutely aware that potentially impactful economic data and crucial earnings reports were all on the docket for the following few days, rendering this session something of a lame duck.
The real business of the week began on Tuesday with the Job Openings and Labor Turnover Survey (JOLTS) which came in unchanged and as expected showing 8.2m open job positions in the U.S., further evidence of no imminent recession. Paypal, Jet Blue and Pfizer released impressive earnings. Procter & Gamble, Starbucks and Merck, not so much. These were only appetizers, however. The main course was Microsoft after the closing bell.
Dragged down again by tech and AI, stocks dipped partly due to pre-earnings positioning, but also as a result of the increasing geopolitical temperature in both the Middle East and Venezuela and the potential effect that could have on oil prices and thereby the global economy.
Microsoft’s Q2 sales and earnings were fine, but its mostly AI-related capital expenditure was off the charts, up by 55% from a year earlier with a perceived lack of resulting direct revenue in return. When markets opened on Wednesday, Microsoft notably failed to participate in what was otherwise a substantial rebound in the beaten-down tech sector in advance of the Fed declaration at 2pm ET.
Before attention turned fully to Fed’s interest rate announcement, the first of the week’s three big global central bank resolutions was made by the Bank of Japan, which raised the local interest rate by 0.25% to its highest level since 2008.
As was universally anticipated, there was no change in interest rates from the Fed with only very limited tweaks to its accompanying policy statement, giving Wall Street little to work with. Chairman Powell successfully navigated a rather feisty press conference, playfully dropping plenty of breadcrumbs about a September cut without actually confirming it (“A reduction in the policy rate could be on the table as soon as the next meeting in September.").
As so often happens, the Fed gave an inch and markets took a mile and stocks extended their considerable session gains, powered by Nvidia which shattered the all-time record for a one-day increase in any company’s value, adding $330 billion in just six and a half hours.
Oh and by the way, Meta/Facebook announced earnings after the closing bell and it was smiles all around as estimates were surpassed and the stock screamed higher when markets opened the next day. The Bank of England completed the global central bank divergence full house, narrowly voting on Thursday to cut interest rates in the UK for the first time since early 2020.
Unexpectedly cool manufacturing data and a hot weekly jobless claims number triggered a lunchtime collapse in stock prices. There was also a growing sense that investors might be exiting stocks (particularly the highly-valued ones) as a profit-taking exercise and rushing into increasingly attractive bonds as Treasury yields fall sharply in response to expected Fed policy. All of Wednesday’s gains were quickly wiped out.
The tech earnings parade concluded after the close with releases from Apple, Amazon and Intel. In descending order of good news:
Apple beat estimates on overall sales and profitability, but the company is clearly still having problems with iPhone sales in China and the fact that (shocker!) no-one seems to be buying any Vision Pro headsets at $3500 a pop.
Amazon showed decent sales growth in Q2 but missed on revenue and profitability and gave rather gloomy income projections for the rest of the year.
Intel’s report was a complete catastrophe. The company missed estimates on just about every imaginable metric, announced mass layoffs and spending cuts, admitted that it was late to the AI party, gave grim forward guidance and made the kryptonite decision to suspend its dividend (there’s nothing Wall Street hates more than this).
Asian markets crashed overnight in their worst session in years. Europe did little better. The pre-opening bell Jobs Report over here on Friday was all that stood between the U.S. markets and a similar fate. It utterly failed to do so. Payrolls rose 114k in July, way below the 175k estimate and the two previous months were also revised downwards. The unemployment rate rose from 4.1% to 4.3%, its highest level in nearly three years.
Treasury yields tumbled in breathtaking fashion, accelerating the stocks → bonds exodus referred to above. The sudden growth scare that I have been warning about for months may well have arrived. The Fed’s decision on Wednesday to delay cutting interest rates until mid-September was suddenly viewed as a grave policy mistake and there were loud shouts for a double rate cut in September, a full 0.50% rather than just 0.25%. There were even some calls for the Fed to make an unscheduled interim cut ahead of the meeting, something I must say is highly unlikely.
It was a brutal sea of red when the stock market opened, with much of Wall Street’s venom reserved for Intel which fell over 25% in the first two minutes of trading and Amazon which dropped 10%. There was absolutely nowhere to hide with Small Caps getting heavily whacked as well. All the major stock indexes, particularly the NASDAQ, closed the day and the week badly battered and bruised. For those keeping score, more than $2 trillion in value has been obliterated from the NASDAQ-100 index in the last three weeks alone.
With a September interest rate cut now assured (it’s just a question of how big it is), any bad economic news has now shifted in Wall Street’s eyes from being good news since it that could prompt a rate cut to just being straight-up bad news.
If you thought July was wild ride, strap in for August.
OTHER NEWS ..
Ignorant politicking .. At his press conference on Wednesday, Fed chairman Jerome Powell understandably bristled when he was faced with questions about the possibility that there could be a political element to any interest rate decision in advance of the November election. There is only one more rate policy announcement between now and then (September 18th), with the next one taking place two days after the event.
The frankly embarrassing ignorance and pathetic showboating instincts of politicians on both sides was on full display last week. Democrats moaning at the Fed: “if you don’t cut interest rates in advance of the election, it’s a political call!”. Republicans whining to the Fed: “if you do cut interest rates before the election, it’s a political call!”. This conversation is being exacerbated by increasing speculation, driven by Friday’s Jobs Report, that there could even be a double rate cut in September, 0.50% rather than just 0.25%.
The Fed’s job is to act in an informed and dispassionate manner and everyone else is welcome to react however they want. What would be an economically damaging move would be to NOT make any changes that are informed by the data regardless of any perceived political consequences one way or another. Aggrieved politicians just need to deal with it and STFU.
Americans Earn A Lot More Money Than They Think .. The Economic Innovation Group published an interesting report that compares U.S. workers with the rest of the world and showed that the lowest paid workers in the U.S., who live in Mississippi, still earn more than the average worker in Germany and Canada. Other low earnings states such as Oklahoma, West Virginia and South Carolina still have higher average incomes than Belgium, Denmark and Austria. Only workers in Luxembourg and Switzerland earn more than the lowest paid U.S. workers.
Of course, it’s also true that one reason for this disparity is that Americans work longer hours than people in other countries. However, it’s striking how people in so-called lower income states have meaningfully higher wages than those in some of the world’s biggest developed economies.
ARTICLE OF THE WEEK ..
Don’t fall for this stock-picking nonsense.
THIS WEEK’S UPCOMING CALENDAR ..
This week will be a break from meaningful economic data but Q2 earnings season continues relentlessly with results from around 80 S&P 500 companies including CVS, Eli Lilly, Disney, Novo Nordisk, Shopify, Monster Beverage, NRG Energy, Warner Bros, Super Micro Computer, Caterpillar, Occidental Petroleum, Uber, AirBnb, Paramount, BioNTech, CSX, Simon Properties, Devon Energy and Wynn Resorts.
LAST WEEK BY THE NUMBERS ..
Last week’s market color courtesy of finviz.com

Last week’s best performing U.S. sector: Utilities (two biggest holdings: NextEra Energy, Southern Co.) for the second week in a row - up 4.1% for the week.
Last week’s worst performing U.S. sector: Technology (two biggest holdings: Microsoft, Nvidia) - down 5.3% for the week.
SPY, the S&P 500 Large Cap ETF, tracks the S&P 500 index, made up of 500 stocks from among the largest U.S. companies. Its price fell 2.5% last week, is up 12.1% so far this year and ended the week 5.7% below its all-time record closing high (07/16/2024).
IWM, the Russell 2000 Small Cap ETF, tracks the Russell 2000 index, made up of the bottom two-thirds in terms of company size of a group made up from among 3,000 largest U.S. stocks. Its price fell 7.3% last week, is up 4.1% so far this year and ended the week 13.9% below its all-time record closing high (11/08/2021).
AVERAGE 30-YEAR FIXED MORTGAGE RATE ..
6.73%
One week ago: 6.78%, one month ago: 6.95%, one year ago: 6.90%
Data courtesy of: FRED Economic Data, St. Louis Fed as of last Thursday.
FEAR & GREED INDEX ..
“Be fearful when others are greedy and be greedy when others are fearful.” Warren Buffet.

The Fear & Greed Index from CNN Business can be used as an attempt to gauge whether or not stocks are fairly priced and to determine the mood of the market. It is a compilation of seven of the most important indicators that measure different aspects of stock market behavior. They are: market momentum, stock price strength, stock price breadth, put and call option ratio, junk bond demand, market volatility and safe haven demand.
Extreme Fear readings can lead to potential opportunities as investors may have driven prices “too low” from a possibly excessive risk-off negative sentiment.
Extreme Greed readings can be associated with possibly too-frothy prices and a sense of “FOMO” with investors chasing rallies in an excessively risk-on environment . This overcrowded positioning leaves the market potentially vulnerable to a sharp downward reversal at some point.
A “sweet spot” is considered to be in the lower-to-mid “Greed” zone.
Data courtesy of CNN Business as of Friday’s market close.
FEDWATCH INTEREST RATE TOOL ..
Will interest rates be lower than they are now after the Fed’s next meeting on September 18th?
Yes .. 100% probability (100% a week ago)
No .. 0% probability (0% a week ago)
Where is the Fed Funds interest rate most likely to be at the end of 2024?
4.125% (1.25% lower than where we are now, implying five 0.25% rate cuts before the end of 2024)
One week ago: 4.625% (implying three rate cuts), one month ago: 4.875% (implying two rate cuts)
All data based on the Fed Funds rate (currently 5.375%). Calculated from Federal Funds futures prices as of the market close on Friday. Data courtesy of CME FedWatch Tool.
% OF S&P 500 STOCKS TRADING ABOVE THEIR 50-DAY MOVING AVERAGE:
56% (279 of the S&P 500 stocks ended last week above their 50D MA and 221 were below)
One week ago: 70%, one month ago: 45%, one year ago: 77%
% OF S&P 500 STOCKS TRADING ABOVE THEIR 200-DAY MOVING AVERAGE:
69% (344 of the S&P 500 stocks ended last week above their 200D MA and 156 were below)
One week ago: 75%, one month ago: 65%, one year ago: 66%
Closely-watched measures of market breadth and participation, providing a real-time look at how many of the S&P 500 index stocks are trending higher or lower, as defined by whether the stock price is above or below their more sensitive 50-day (short term) and less sensitive 200-day (long term) moving averages which are among the most widely-followed of all stock market technical indicators.
The higher the reading, the better the deemed health of the overall market trend, with 50% considered to be a key pivot point. Readings above 90% or below 15% are extremely rare.
WEEKLY US INVESTOR SENTIMENT (outlook for the upcoming 6 months) ..
↑Bullish: 45% (43% a week ago)
⬌ Neutral: 30% (25% a week ago)
↓Bearish: 25% (32% a week ago)
Net Bull-Bear spread: ↑Bullish by 20 (Bullish by 11 a week ago)
For context: Long term averages: Bullish: 38% — Neutral: 32% — Bearish: 30% — Net Bull-Bear spread: Bullish by 8
Survey participants are typically polled during the first half of the week.
Data courtesy of: American Association of Individual Investors (AAII).
US TREASURY INTEREST RATE YIELD CURVE ..
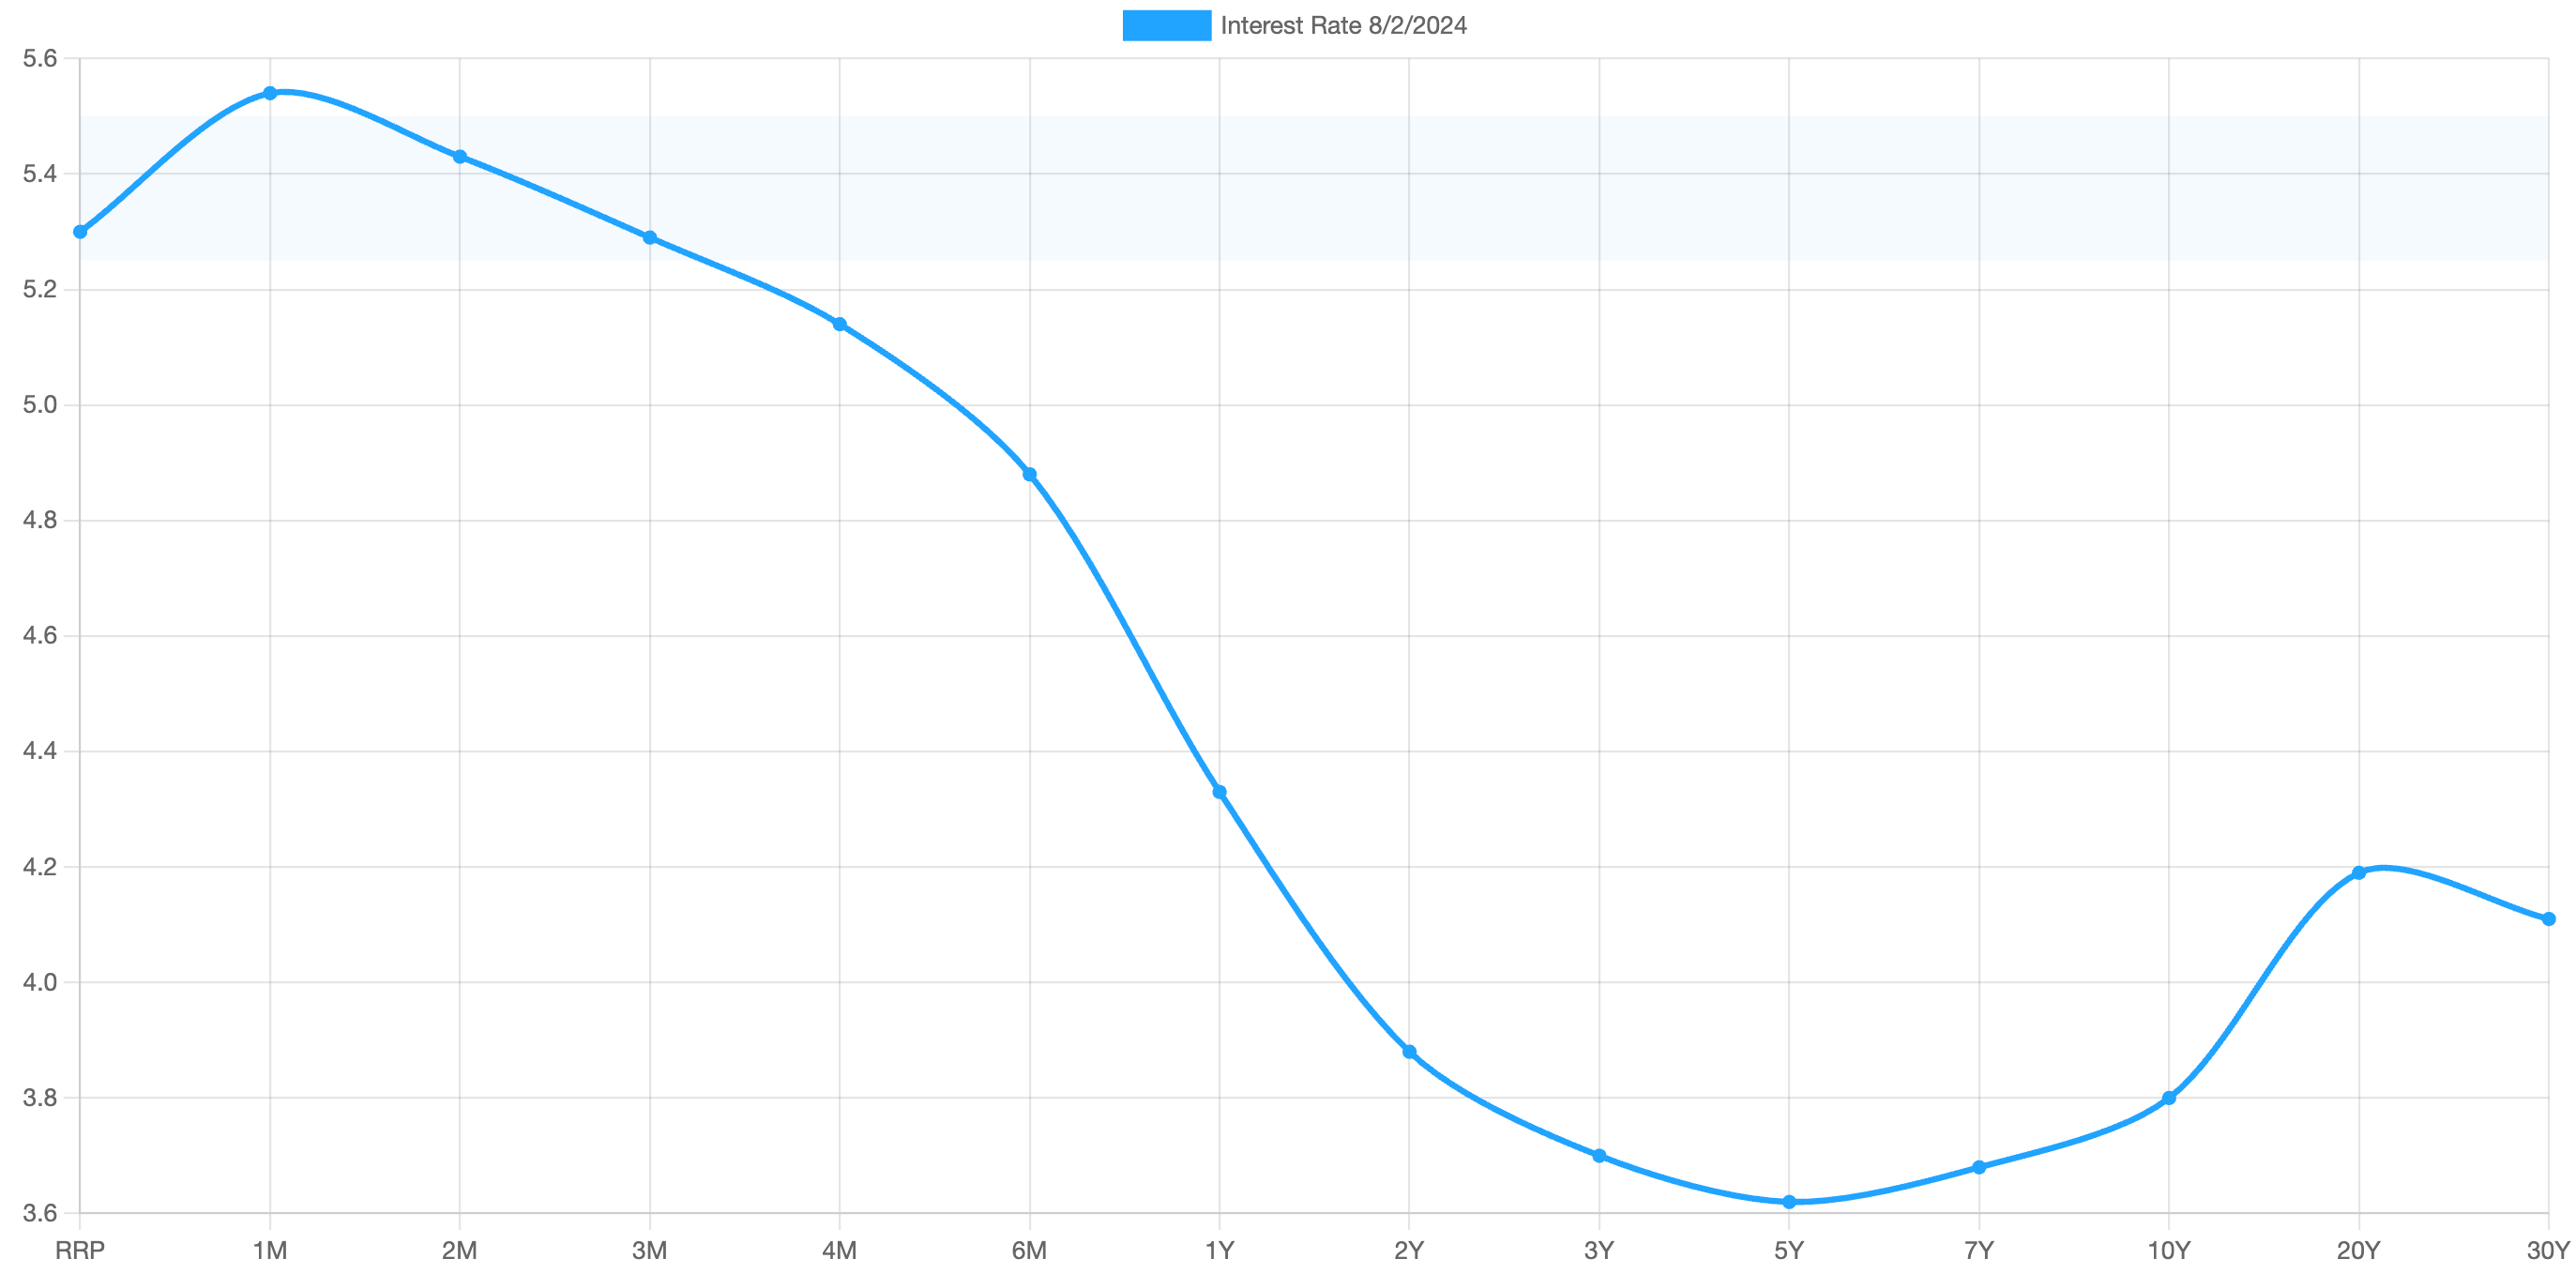
The highest rate on the yield curve (5.54%) is being paid for the 1-month duration and the lowest rate (3.62%) is for the 5-year.
The most closely-watched and commonly-used comparative measure of the spread between the higher 2-year and the lower 10-year rose from 0.16% to 0.17%, indicating a steepening in the inversion of the curve last week.
The interest rate yield curve remains unusually “inverted” (i.e. shorter term interest rates are generally higher than longer term ones). Based on the 2-year vs. 10-year spread, the curve has been inverted since July 2022.
Historically, an inverted yield curve is not the norm and has been regarded by many as a leading indicator of an impending recession, with shorter term risk regarded to be unusually higher than longer term. The steeper the inversion, the greater the deemed risk of recession.
Data courtesy of ustreasuryyieldcurve.com as of Friday. The lightly shaded area on the chart shows the current Federal Funds rate range.
WWW.ANGLIAADVISORS.COM | SIMON@ANGLIAADVISORS.COM | CALL OR TEXT: (646) 286 0290 | FOLLOW ANGLIA ADVISORS ON INSTAGRAM
This material represents a highly opinionated assessment of the financial market environment based on assumptions and prevailing information and data at a specific point in time and is always subject to change at any time. Although the content is believed to be correct at the time of publication, no warranty of its accuracy or completeness is given. It is never to be interpreted as an attempt to forecast any future events, nor does it offer any kind of guarantee of any future results, circumstances or outcomes.
The material contained herein is not necessarily complete and is wholly insufficient to be exclusively relied upon as research or investment advice or as a sole basis for any investment or other financial decisions. The user assumes the entire risk of any decisions made or actions taken based in whole or in part on any of the information provided in this or any Anglia Advisors communication of any kind. Under no circumstances is any of Anglia Advisors’ content ever intended to constitute tax, legal or medical advice and should never be taken as such. Neither the information contained or any opinion expressed herein constitutes a solicitation for the purchase of any security or asset class. No advice may be rendered by Anglia Advisors unless or until an executed Client Engagement Agreement is in place.
Posts may contain links or references to third party websites or may post data or graphics from them for the convenience and interest of readers. While Anglia Advisors might have reason to believe in the quality of the content provided on these sites, the firm has no control over, and is not in any way responsible for, the accuracy of such content nor for the security or privacy protocols that external sites may or may not employ. By making use of such links, the user assumes, in its entirety, any kind of risk associated with accessing them or making use of any information provided therein.
Those associated with Anglia Advisors, including clients with managed or advised investments, may maintain positions in securities and/or asset classes mentioned in this post.

If you enjoyed this post, why not share it with someone or encourage them to subscribe themselves?


