


The stock market playbook is being followed exactly as we would expect and in the way that I have been banging on about in my recent weekly reports. The plain fact is that, around 4500, the S&P 500 index is priced for near-term perfection with zero room for any kind of disappointments, meaning that even the most modest of negatives (an uptick in market interest rates, some lackluster earnings, a less impressive economic report) or simply news or data that isn’t constantly positive, can cause market choppiness and sometimes significant pullbacks - not because the news is that bad in an absolute sense, but instead because there’s just no margin for error at current levels.
The strong spring/early summer rally included a very healthy dose of “chasing” and increased money flows as under-exposed traders, investors and institutions scrambled to add stock exposure in response to very negative sentiment abruptly turning positive.
That dynamic has now been exhausted and if we get more “not positive” or “we-didn’t-see-that-coming” episodes over the next few weeks, then a continued decline in the S&P 500 back towards more fundamental support (between 4,300-4,400) actually makes sense and should not be a surprise.
Positively though, as long as the “Three Pillars” of the rally remain in place (1. No Landing / Soft Landing, 2. Disinflation, 3. Fed Done/Almost Done with Rate Hikes), then any such decline would probably not necessarily indicate that the rally was about to reverse - but could be viewed more as a temporary setback in a still positively-trending market.
The hard landing vs. soft landing question remains the most important one of all for markets over the medium- and longer-term for this simple reason; if there’s a soft landing then a further 10%-ish stock market rally is possible. If there’s a hard landing then it really doesn’t matter what the Fed does because any rate cuts will already be too late - and a market decline of 10% to 20%+ is likely.
Looking at the data as I do, the current conclusion hasn’t changed: a soft landing is still more likely than a hard landing. There are no real signs that US consumer spending is materially slowing and business spending appears to be healthy. That said, there has been a degree of additional deterioration on the employment front that we need to keep an eye on, but at this point it’s not enough to signal a shift to a hard landing narrative.
To reiterate, this does not mean a hard landing won’t happen. But so far, it isn’t happening. Growth is moderating at an acceptable pace but one that could be a cause for concern if the rate of economic contraction meaningfully accelerates.
Tesla (TSLA) shares tumbled on Monday after long-time CFO Zach Kirkhorn surprisingly quit. Declining COVID vaccine demand hit the stock prices of Moderna (MRNA) and BioNTech (BNTX).
Elsewhere there were notable upside surprises for Berkshire Hathaway (BRK.B), Eli Lilly (LLY) and Wynn Resorts (WYNN) and notable disappointments for Palantir (PLTR), Beyond Meat (BYND) and Tyson Foods (TSN).
A bit of a Q2 earnings pattern is emerging. In general, earnings beats are being rewarded less than usual and earnings misses are being punished more than usual. The reason is that so many stocks have already gone up big in that spring/early summer rally based on anticipation and reality is beginning to butt into the picture. It’s classic “Buy The Rumor, Sell The News”. As more and more earnings are released, we move from the rumor phase to the news phase.
Credit agency Moody's Investors Service downgraded the credit ratings of ten small and midsize US banks on Monday and is actively considering the possibility of downgrading some larger lenders. Financial stocks across the board initially responded by plunging in price.
Moody's cited several factors for the review, including elevated funding expenses, potential regulatory vulnerabilities and the ever-growing risks associated with commercial real estate loans due to continued diminishing demand for office space. The optimists’ view is that the Moody's call drives home the point that credit conditions are tight enough, which could well help deter the Fed from further interest rate hikes, which will ultimately benefit stock prices.
The Consumer Price Index (CPI) measure of retail inflation came out on Thursday. On an annual basis, consumer prices rose 3.2% in July, slightly up from the previous month's 3.0% gain. Gas prices have been climbing in recent weeks, which could pull the headline rate higher in the August data.
The closely-watched Core CPI inflation figure, which excludes more volatile food and energy costs, was up 4.7% year-on-year, down a touch from June but still over double the Fed’s target. Once again, the biggest contributor to the gains was shelter costs.
CPI’s wholesale cousin, the Producer Price Index (PPI) measure of wholesale inflation experienced by manufacturers rose 0.3% in July, a bit higher than expected and the largest gain since January.
Core PPI, which excludes food/energy prices and trade services rose 2.7% from a year earlier, well down from the previous month’s rate of 5.8%.
The inflation reports didn't really move the needle much at all, so stocks ultimately finished flat over the second half of the week. Until we get a number as near as dammit to the Fed's 2% target, however, inflation and its associated effect on the economy and the Fed’s propensity to play around with interest rates and thereby impact the stock market, will not go away.
OTHER NEWS ..
Taking Credit .. Total US consumer credit card balances (SEE EXPLAINER: FINANCIAL TERM OF THE WEEK) increased by $45 billion last quarter, the most of all debt types, to surpass $1 trillion (that’s $1,000,000,000,000) for the first time ever. Delinquency rates are also on the rise and have now returned to pre-COVID stimulus levels.
We Thought We’d Seen The Last Of This .. More trouble is brewing in Congress as a small number of extremist Republicans are once again plotting to try and cause a government shutdown in advance of federal funding running out on September 30th. A few investment analysts are even putting this brinkmanship into their late-2023 outlooks with some forecasting probabilities as high as a 40% chance of a government shutdown by October and 60% by December.
While this does not risk causing a debt default like the standoff caused when the same individuals pulled this stunt earlier this year, it could still be economically damaging to the rest of us. Members of Congress opted to head off for their August vacations without being anywhere near resolving this issue, so will be under the gun again when they get back. Cue more tiresome bullshit grandstanding from all sides.
Still Waiting .. The long-awaited economic recovery in China is still not materializing. July exports fell by the most since February 2020, while imports also slid by more than economists had expected. The weakness in imports undermines the hope that domestic demand will lead the bounce for China’s economy, which is taking a hit from a slump in the real estate market and softening consumption growth. The latest inflation data showed China’s consumer and producer prices moving lower for the first time since 2020. Such deflation would likely further slow an already struggling economy.
Back You Go! .. A New York judge has revoked the bail of former crypto billionaire Sam Bankman-Fried and sent him to jail at a particularly nasty federal detention facility in Brooklyn, NY after finding that “on at least two occasions” he attempted to intimidate key government witnesses in the case against him, including his on-again/off-again girlfriend and made illegal contact with some of his media buddies - all while on bail at his mom and dad’s beautiful, historic one-acre home with a pool in Palo Alto, CA.
SBF’s trial on multiple criminal counts, which could well result in decades of jail time for the disgraced founder of the crypto exchange FTX and previously a darling of politicians and entertainment and sporting celebs, is scheduled to begin on October 2nd. FTX collapsed last year following exposure of astonishingly widespread fraud, theft, negligence and mismanagement, resulting in billions of dollars of losses for investors.
UNDER THE HOOD - THE TECHNICALS ..
The S&P 500 index SPX closed on Friday at 4464, down a little on the week. The next upside resistance points are to be found at 4475, 4490 and 4560. Downside support levels are at 4438, 4415 and 4402.
Volatility and volume have both remained low and breadth measures have remained high during this recent market retreat and the Lowry’s Demand/Supply balance (see LAST WEEK BY THE NUMBERS below) is not really shifting much at all. These conditions are actually more in keeping with a healthy pullback in relief of previously-overbought conditions rather than a technically damaging one.
Shorter term technical indicators may be deteriorating somewhat, but the bigger picture longer term ones are still holding up well. There is, however, a clear trajectory of support moving away from the higher momentum, larger cap, mostly tech darlings of the first half of 2023 to the more value-oriented, smaller cap, steadier profitability former laggards.
Anglia Advisors clients are welcome to reach out to me to discuss market conditions further.
THIS WEEK’S UPCOMING CALENDAR ..
The financial calendar cools down a bit this week, but a wave of retail earnings reports and a bit of economic data will still keep investors busy.
Home Depot, Walmart, Target, TJX, Ross Stores, Cisco Systems, Applied Materials, Deere, Estee Lauder, Agilent and Cardinal Health all report this week.
We’ll see Retail Sales data for July this week. The estimate is for a rise of 0.4% month-over-month. Also out this week is the latest Housing Market Index for August.
On Wednesday, the Fed will release the minutes from its late-July monetary-policy meeting, when the headline interest rate was raised by a quarter of a percent.
LAST WEEK BY THE NUMBERS ..
Last week’s market color courtesy of finviz.com
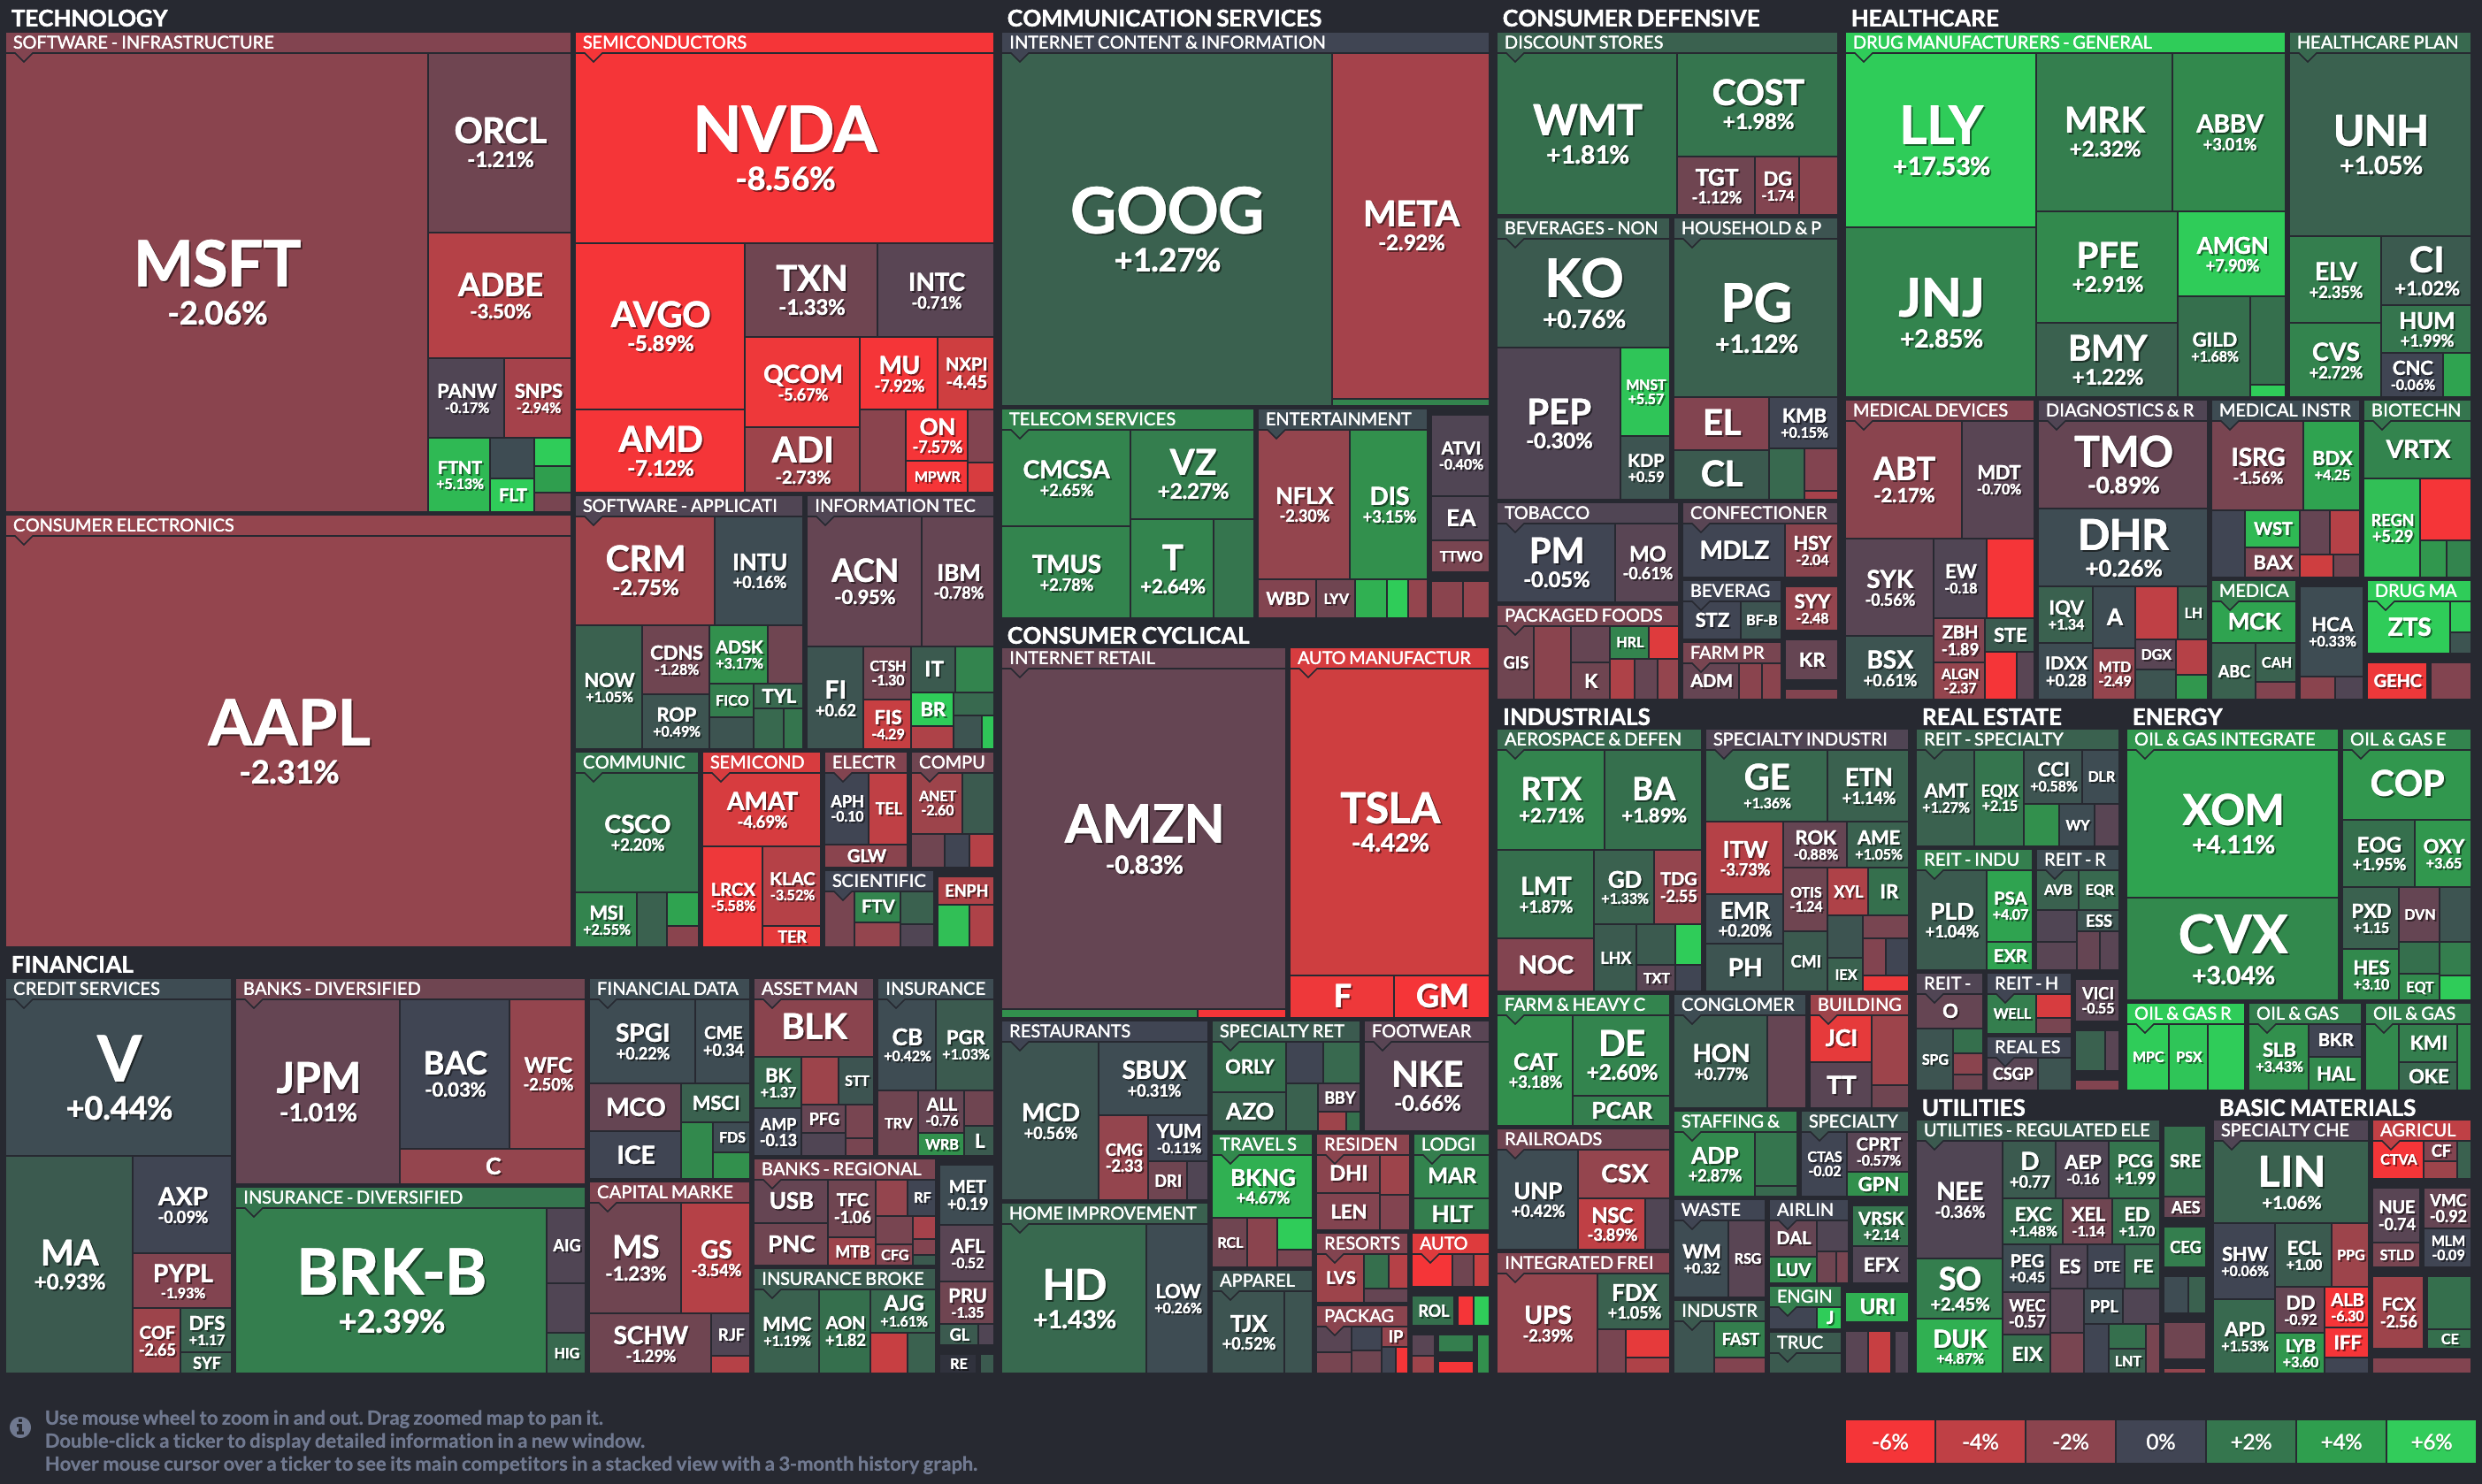
Last week’s best performing US sector: Energy (two biggest holdings: Exxon Mobil, Chevron) for the second week in a row - up 3.3% for the week.
Last week’s worst performing US sector: Technology (two biggest holdings: Microsoft, Apple) - down 2.87% for the week.
The proprietary Lowry's measure for US Market Buying Power is currently at 161 and fell by 3 points last week and that of US Market Selling Pressure is now at 126 and rose by 3 points over the course of the week.
SPY, the S&P 500 Large Cap ETF, is made up of the stocks of the 500 largest US companies. It remains above its 50-day and 90-day moving averages and above its long term trend line, with a RSI of 46***. SPY ended the week 6.7% below its all-time high (01/03/2022).
IWM, the Russell 2000 Small Cap ETF, is made up of the bottom two-thirds in terms of company size of the group of the 3,000 largest US stocks. It remains above its 50-day and 90-day moving averages and above its long term trend line, with a RSI of 46***. IWM ended the week 21.3% below its all-time high (11/05/2021).
*** RSI (Relative Strength Index) above 70: technically overbought, RSI below 30: technically oversold
The VIX, the commonly-accepted measure of expected upcoming stock market risk and volatility (often referred to as the “fear index”) implied by S&P 500 index option trading, ended the week 1.1 points lower at 14.8. It is above its 50-day moving average but below both its 90-day and its long term trend line.
AVERAGE 30-YEAR FIXED RATE MORTGAGE ..
6.96%
(one week ago: 6.90%, one month ago: 6.96%, one year ago: 5.25%)
Data courtesy of: FRED Economic Data, St. Louis Fed as of Thursday of last week.
FEAR & GREED INDEX ..
“Be fearful when others are greedy and be greedy when others are fearful.” Warren Buffet.

The Fear & Greed Index from CNN Business can be used as an attempt to gauge whether or not stocks are fairly priced and to determine the mood of the market. It is a compilation of seven different indicators that measure some aspect of stock market behavior. They are market momentum, stock price strength, stock price breadth, put and call options, junk bond demand, market volatility and safe haven demand.
Extreme Fear readings can lead to potential opportunities as investors may have driven prices “too low” from a possibly excessive risk-off negative sentiment.
Extreme Greed readings can be associated with a sense of “FOMO” and investors chasing rallies in an excessively risk-on environment, possibly leaving the market vulnerable to a sharp downward correction at some point.
Data courtesy of CNN Business.
AAII US INVESTOR SENTIMENT (outlook for the upcoming 6 months) ..
↑Bullish: 45% (49% a week ago)
⬌ Neutral: 30% (30% a week ago)
↓Bearish: 25% (21% a week ago)
Net Bull-Bear spread: ↑Bullish by 20 (Bullish by 28 a week ago)
For context: Long term averages: Bullish: 38% — Neutral: 32% — Bearish: 30% — Net Bull-Bear spread: Bullish by 8
Weekly sentiment survey participants are usually polled on Tuesdays and/or Wednesdays.
Data courtesy of: American Association of Individual Investors (AAII).
FEDWATCH INTEREST RATE PREDICTION TOOL ..
What are the latest market expectations for what the Fed will announce re: interest rate changes (Fed Funds rate, currently 5.375%) on September 20th after its next meeting?
⬌ No change .. 90% probability
(one week ago: 87%, one month ago: 82%)
↑ 0.25% increase .. 10% probability
(one week ago: 13%, one month ago: 13%)
Where will interest rates (Fed Funds rate, currently 5.375%) be at the end of 2023?
↓ Lower than now .. 8% probability
(one week ago: 9%, one month ago: 11%)
⬌ Unchanged from now .. 59% probability
(one week ago: 67%, one month ago: 52%)
↑ Higher than now .. 33% probability
(one week ago: 24%, one month ago: 37%)
Data courtesy of CME FedWatch Tool. Calculated from Federal Funds futures prices as of Friday.
US TREASURY INTEREST RATE YIELD CURVE ..

The interest rate yield curve remains “inverted” (i.e. shorter term interest rates are generally higher than longer term ones) with the highest rate (5.54%) being paid currently for the 4-month duration and the lowest rate (4.16%) for the 10-year.
The closely-watched and most commonly-used comparative measure of the spread between the 2-year and the 10-year remained unchanged at 0.73%, indicating no change in the inversion of the curve during the last week.
Historically, an inverted yield curve has been regarded as a leading indicator of an impending recession, with shorter term risk deemed to be unusually higher than longer term. The steeper the inversion, the greater the deemed risk of recession.The curve has been inverted since July 2022 based on the 2 year vs. 10 year spread.
Data courtesy of ustreasuryyieldcurve.com as of Friday.
ARTICLE OF THE WEEK ..
“Before you argue that expense tracking or goal setting or “manifesting” your future wealth are more important than income, remember to bring data. I’ll have mine.” Nick Magiulli on why your income can be pretty much everything.
EXPLAINER: FINANCIAL TERM OF THE WEEK ..
A weekly feature using information found on Investopedia to try to help explain Wall Street gobbledygook (may be edited at times for clarity).
While useful for making purchases over time, credit card debt does carry some of the industry’s highest interest rates.
Credit card debt typically accounts for a significant portion of credit utilization on a borrower’s credit profile.
Paying down substantial portions of outstanding credit card debt is one of the best ways to rapidly improve your credit score.
Generally, credit card debt refers to the accumulated outstanding balances that many borrowers carry over from month to month. Credit card debt can be useful for borrowers seeking to make purchases with deferred payments over time. This type of debt does carry some of the industry’s highest interest rates. However, credit card borrowers do have the option to pay off their balances each month to save on interest over the long term.
Credit cards are one of the most popular forms of revolving credit and offer numerous benefits for borrowers. Credit cards are issued with revolving credit limits that borrowers can utilize as needed. Payments are typically much lower than a standard non-revolving loan. Users also have the option to pay off balances to avoid high-interest costs. Additionally, most credit cards come with reward incentives such as cash back or points that can be used toward future purchases or even to pay down outstanding balances.
Lenders report credit card debt level balances to credit bureaus each month along with a borrower’s relevant credit activity. Thus, credit cards can be an excellent way for borrowers to build out a favorable credit profile over time. However, negative activity such as delinquent payments, high balances, and a high number of hard inquiries in a short period of time can also lead to problems for credit card borrowers.
Credit card debt is highly influential in determining a borrower’s credit score since it will typically account for a significant portion of credit utilization on a borrower’s credit profile. Credit bureaus track each individual credit account by itemized trade lines on a credit report. The aggregation of outstanding credit card debt from these trade lines is the borrower’s total credit card debt, which is used by credit bureaus to calculate their credit utilization ratio by dividing it by the aggregate amount of credit limits of all credit cards owned by the borrower. Credit card utilization is an essential component of a borrower’s credit score.
WWW.ANGLIAADVISORS.COM | SIMON@ANGLIAADVISORS.COM | CALL OR TEXT: (929) 677 6774 | FOLLOW ANGLIA ADVISORS ON INSTAGRAM
This material represents a highly opinionated assessment of the financial market environment based on assumptions and prevailing data at a specific point in time and is always subject to change at any time. No warranty of its accuracy or completeness is given. It is never to be interpreted as an attempt to forecast any future events, nor does it offer any kind of guarantee of any future results, circumstances or outcomes.
The material contained herein is not necessarily complete and is wholly insufficient to be exclusively relied upon as research or investment advice or as a sole basis for any investment or other financial decisions. The user assumes the entire risk of any decisions made or actions taken based in whole or in part on any of the information provided in this or any Anglia Advisors communication of any kind. Under no circumstances is any of Anglia Advisors’ content ever intended to constitute tax, legal or medical advice and should never be taken as such. Neither the information contained or any opinion expressed herein constitutes a solicitation for the purchase of any security or asset class.
Posts may contain links or references to third party websites or may post data or graphics from them for the convenience and interest of readers. While Anglia Advisors may have reason to believe in the quality of the content provided on these sites, the firm has no control over, and is not in any way responsible for, the accuracy of such content nor for the security or privacy protocols that external sites may or may not employ. By making use of such links, the user assumes, in its entirety, any kind of risk associated with accessing them or making use of any information provided therein.
Clients of, and those associated with, Anglia Advisors may maintain positions in securities and asset classes mentioned in this post.

If you enjoyed this post, why not share it with someone or encourage them to subscribe themselves?


