


It was a fourth straight week of higher stock prices with markets in a sweet spot right now as recent data has shown that growth is slowing but still positive, corporate earnings and outlooks are proving to be very strong and disinflation may have slowed, but it has not stalled.
This is also a market that once again seems to be happy talking itself into the idea that the Fed is going to cut interest rates in the not-too-distant future (a first cut in September and then another one sometime before year-end is currently the futures market’s best guess). Fed officials are sticking to the script, however, continuing to hammer home the higher-for-longer mantra in their speaking engagements last week.
Even as Wednesday’s release of the Consumer Price Index (CPI) measure of retail inflation loomed into view on Monday, there was not a lot of enthusiasm on the part of traders to take a strong view one way or another ahead of the numbers and the outcome was a fifth consecutive trading day of barely any movement in the major indexes, but with the S&P 500 still managing to hold above the important 5200 level. Beneath the index level, the news of the day was dominated by a resurgence of meme stock mania (see OTHER NEWS below).
Tuesday morning’s starter to the main course that was the following day’s CPI, was the Producer Price Index (PPI) measure of wholesale inflation experienced in April by manufacturers which came in hotter than expected, rising +0.5% for the month and +2.2% for the year. However, the prior month’s number was revised down to a very chilly -0.1% and that seemed to balance things out as far as Wall Street was concerned. The net effect ended up being positive for stocks, with a late rally carrying the indexes higher, albeit still within a pretty tight range.
When CPI came out pre-market on Wednesday, we learned that the annualized headline inflation rate ticked slightly lower to +3.4%, the first time it has cooled this year. The important annual Core inflation rate (ex-food and energy) came in at +3.6%. All of this was very much in the same ZIP code as expectations.
Also released on Wednesday were the latest Retail Sales figures that were unexpectedly flat in April along with a slight downward revision to March, indicating that consumer spending was beginning to lose some momentum. This was viewed as a nice addition to the CPI-generated narrative of potentially cooling retail price increases and a possible acceleration of the timeline for interest rate cuts from the Fed.
Markets breathed a collective sigh of relief at the lack of an unpleasant inflation upside surprise and the welcome signs of still-intact disinflation, pushing stocks higher at the open and it only got better from there. We reached new all-time closing highs for the S&P 500 (for the 23rd time so far this year but the first time since March), the NASDAQ (for the eighth time so far this year) and even the stupid Dow Jones Industrial Average (DJIA) which got to within spitting distance of the 40,000 level for the first time and is now double what it was less than eight years ago, even without Nvidia, Meta/Facebook and Alphabet/Google being in the index.
Stock markets returned to snooze mode on Thursday, following a series of little twists and turns and closed slightly lower as traders digested the week’s gains. This was despite a very healthy earnings report driven by international and e-commerce strength from the bellwether stock, Walmart (WMT), pushing the stock price up to its highest level ever.
Another generally quiet one for stocks on Friday too, although by the closing bell, the S&P 500 index had closed above 5300 for the first time and we also saw the first-ever close above 40,000 for the DJIA, thanks to a very positive literally final minute of the session, which brought yet another solid Wall Street week to an end.
These new highs for most of the indexes have just eclipsed levels last seen in March as the 5.5% “correction” in stocks came to an end in the space of about a month, so what has happened since then?
The first Fed rate cut is now not expected until September, not June (as it was in March).
The Fed is now only expected to cut once or twice, not four or five times (as it was in March).
The unemployment rate has now risen to 3.9%, tying the highest level in months.
CPI inflation for last month is now at 3.4% annualized, up from 3.1% in March’s reading for February.
Earnings expectations remain pretty much unchanged.
Not one of these factors is “better” now than it was in March, indeed some of them are noticeably “worse”. So, why are stocks higher today than they were in late March?
The answer lies in all the happy talk. Investors have convinced themselves that we are in the midst of a near stock-perfect Goldilocks environment that’s still characterized by 1) stable growth and earnings, 2) falling inflation, 3) upcoming Fed rate cuts and 4) AI enthusiasm. While all four of those aspects of this market are probably in a worse state today than they were in March, they’re not “worse enough” to force these investors to think they aren’t still all happening. Put differently, the environment may not be as good as it was in March, but it’s still good enough to push stocks higher.
The problem, as JP Morgan‘s Jamie Dimon pointed out last week, is what happens to markets when it becomes clear that one or more of those four factors is no longer in place, because Wall Street seems to have not really baked in that possibility in the course of an ongoing seven-month rally in stock prices.
OTHER NEWS .. MEME STOCK EDITION
Here We Go Again? .. Shares of GameStop (GME) skyrocketed over 100% in value in just the first 30 minutes of trading on Monday morning, ending the day on 30X its normal trading volume, after Keith Gill, the key driver of the meme stock craze of 2021, known by his online persona of “Roaring Kitty” and recently portrayed by Paul Dano in the enjoyable if somewhat factually incomplete movie, “Dumb Money”, apparently posted a cryptic tweet for the first time after basically having disappeared online almost three years ago. I say “apparently” because as the week wore on, doubts began to emerge out there as to whether it was actually him doing the tweeting, had he sold his account name or perhaps got hacked?
The tweet raised speculation that retail investors may again run up shares of GameStop and some of the other members of the old Meme Team like AMC Entertainment (AMC) and Hertz (HTZ), which also soared that day for no rational reason. The mania continued into Tuesday with more big price spikes - but reality suddenly set in on Wednesday when prices corrected back down and hard, wiping out a large portion of the gains in the first few minutes of trading.
The stock market continued to punch any meme stock day traders who had decided on Tuesday to hop on the bandwagon in the face on Thursday and Friday sending their stock prices cascading lower. GME ended Friday’s session more than 54% below where it had been just 72 hours earlier to a price representing just a 16% increase on the week, having been up as much as 180% at one point. There’s not a lot of “Diamond Hands” HODLing of the stock happening here.
These meme stock movements make for fun stories and amusing investor profiles for financial journalists but from an actual market standpoint, the price action just hints at a lingering complacency amongst investors. As was pointed out on many occasions last week, one wordless post on X/Twitter shouldn’t increase a company’s market capitalization by over $4 billion in a matter of minutes and, frankly, the outlook for GameStop’s business is particularly bleak right now (it has a $10 billion market cap and in the last year only reported $6.7 million in net income. It’s price to earnings multiple got to more than 1,000X last week, compared to the stock market’s 21X - obviously completely unsustainable).
This nonsense happens in frothy markets when there’s money sloshing around, like there was in post-stimulus-check, low-interest-rate America in 2021 when people were starved of ways of entertaining themselves. Now we are coming off a stock market rally dating back to the lows recorded in October of last year and potential interest cuts coming up.
But sequels rarely match the original and this little attempt at a redux may possibly even be over already. We shall see. But just like last time (you can read this book to learn what actually happened), I’m pretty confident that most of the YOLO crowd will eventually lose their shirts once again.
ARTICLE OF THE WEEK ..
A crash course in what have sometimes been called; “the four most dangerous words in investing” .. This Time It’s Different. Is it really?
THIS WEEK’S UPCOMING CALENDAR ..
Earnings season is slowing down but there are still some notable results due from tech leaders and retailers this week such as Target, Zoom Video, Intuit, Lowe’s, AutoZone, TJX, Snowflake, Workday and Ross Stores. But the Big Daddy will be Nvidia, whose earnings report and outlook come out on Wednesday. Wall Street will be hanging on every single word.
Not much in the way of economic data highlights, although Wednesday will see the release of the Federal Reserve minutes from the last meeting of its interest rate setting committee back on May 1st.
LAST WEEK BY THE NUMBERS ..
Last week’s market color courtesy of finviz.com

Last week’s best performing U.S. sector: Technology (two biggest holdings: Microsoft, Apple) for the second week in a row - up 2.8% for the week.
Last week’s worst performing U.S. sector: Industrials (two biggest holdings: Caterpillar, GE) - down 0.2% for the week.
SPY, the S&P 500 Large Cap ETF, tracks the S&P 500 index, made up of 500 stocks from among the largest U.S. companies. Its price rose 1.7% last week, is up 11.4% so far this year and ended the week at its all-time record high
IWM, the Russell 2000 Small Cap ETF, tracks the Russell 2000 index, made up of the bottom two-thirds in terms of company size of a group made up from among 3,000 largest U.S. stocks. Its price rose 1.9% last week, is up 3.7% so far this year and ended the week 14.2% below its all-time record high (11/08/2021)
DXY, the U.S. Dollar index, is an index that measures the value of the U.S. Dollar against a weighted basket of six other major currencies (the Euro, the Japanese Yen, the British Pound, the Canadian Dollar, the Swedish Krone and the Swiss Franc). It was down 0.7% last week, is up 3.1% so far this year and is up 15.9% over the last three years.
AVERAGE 30-YEAR FIXED MORTGAGE RATE ..
7.02%
One week ago: 7.09%, one month ago: 7.10%, one year ago: 6.39%
Data courtesy of: FRED Economic Data, St. Louis Fed as of last Thursday.
FEAR & GREED INDEX ..
“Be fearful when others are greedy and be greedy when others are fearful.” Warren Buffet.
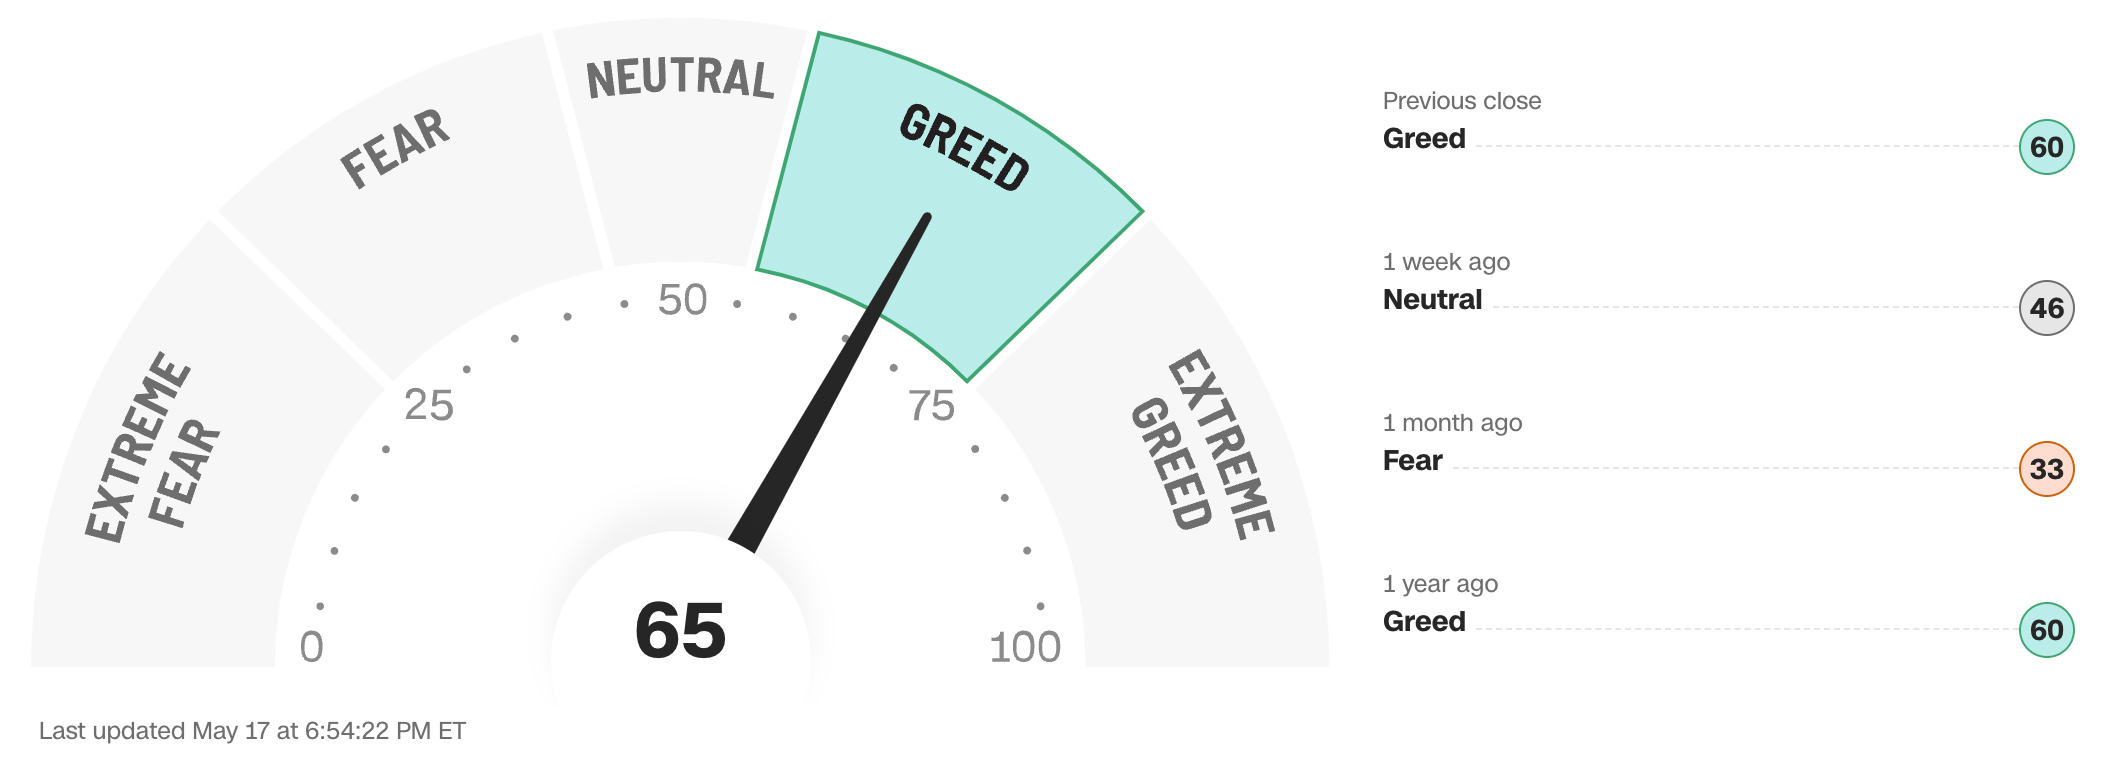
The Fear & Greed Index from CNN Business can be used as an attempt to gauge whether or not stocks are fairly priced and to determine the mood of the market. It is a compilation of seven of the most important indicators that measure different aspects of stock market behavior. They are: market momentum, stock price strength, stock price breadth, put and call option ratio, junk bond demand, market volatility and safe haven demand.
Extreme Fear readings can lead to potential opportunities as investors may have driven prices “too low” from a possibly excessive risk-off negative sentiment.
Extreme Greed readings can be associated with possibly too-frothy prices and a sense of “FOMO” with investors chasing rallies in an excessively risk-on environment . This overcrowded positioning leaves the market potentially vulnerable to a sharp downward reversal at some point.
A “sweet spot” is considered to be in the lower-to-mid “Greed” zone.
Data courtesy of CNN Business as of Friday’s market close.
FEDWATCH INTEREST RATE TOOL ..
Will interest rates be lower than they are now after the Fed’s next meeting on June 12th?
Yes .. 9% probability (3% a week ago)
No .. 91% probability (97% a week ago)
Will interest rates be lower than they are now after the Fed’s following meeting on July 31st?
Yes .. 30% probability (25% a week ago)
No .. 70% probability (75% a week ago)
Where is the Fed Funds interest rate most likely to be at the end of 2024?
4.875% (0.50% lower than where we are now, implying two rate cuts before the end of 2024)
One week ago: 5.125% (implying one rate cut), one month ago: 4.875% (implying two rate cuts)
All data based on the Fed Funds rate (currently 5.375%). Calculated from Federal Funds futures prices as of the market close on Friday. Data courtesy of CME FedWatch Tool.
The 50-day moving average of the S&P 500 remains above the 200-day. This is a continued indication of an ongoing technical uptrend.
% OF S&P 500 STOCKS TRADING ABOVE THEIR 50-DAY MOVING AVERAGE ..
64% (320 of the S&P 500 stocks ended last week above their 50D MA and 180 were below)
One week ago: 57%, one month ago: 28%, one year ago: 47%
% OF S&P 500 STOCKS TRADING ABOVE THEIR 200-DAY MOVING AVERAGE ..
79% (396 of the S&P 500 stocks ended last week above their 200D MA and 104 were below)
One week ago: 77%, one month ago: 66%, one year ago: 45%
Closely-watched measures of market breadth and participation, providing a real-time look at how many of the S&P 500 index stocks are trending higher or lower, as defined by whether the stock price is above or below their more sensitive 50-day (short term) and less sensitive 200-day (long term) moving averages which are among the most widely-followed of all stock market technical indicators.
The higher the reading, the better the deemed health of the overall market trend, with 50% considered to be a key pivot point. Readings above 90% or below 15% are extremely rare.
WEEKLY US INVESTOR SENTIMENT (outlook for the upcoming 6 months) ..
↑Bullish: 41% (41% a week ago)
⬌ Neutral: 36% (35% a week ago)
↓Bearish: 23% (24% a week ago)
Net Bull-Bear spread: ↑Bullish by 18 (Bullish by 17 a week ago)
For context: Long term averages: Bullish: 38% — Neutral: 32% — Bearish: 30% — Net Bull-Bear spread: Bullish by 8
Survey participants are typically polled during the first half of the week.
Data courtesy of: American Association of Individual Investors (AAII).
HIGH YIELD CREDIT SPREAD ..
3.08%
One week ago: 3.14%, one month ago: 3.42%, one year ago: 4.79%
This closely-watched spread is a strong indicator of the risk inherent in the professional marketplace and the extent to which such risk is growing or easing. The high-yield credit spread is the difference between the interest rates offered for riskier low-grade, high yield (“junk”) bonds and those for stable high-grade, lower yield bonds, including deemed risk-free government bonds, of similar maturity.
A reading that is high/increasing indicates that “junkier” bond issuers are being forced to move their yields higher to compensate for a greater risk of default and is considered to be a reflection of broadly deteriorating economic and market conditions which could well lead to lower stock prices.
A reading that is low/decreasing indicates a reduced necessity for higher yields. This reflects less prevailing market risk and more stable or improving conditions in the overall economy and for stock prices.
For context .. this reading was regularly below 3.00% for much of the 1990s, got as high as 10.59% after 9/11 and the subsequent Dotcom Crash of 2002, peaked at 21.82% in the Great Financial Crisis in December 2008 and spiked from 3.62% to 10.87% in the space of about a month during the February/March 2020 COVID crash. The historical average since 1996 is a little over 4.00%.
Data courtesy of: FRED Economic Data, St. Louis Fed as of Friday’s market close.
US TREASURY INTEREST RATE YIELD CURVE ..
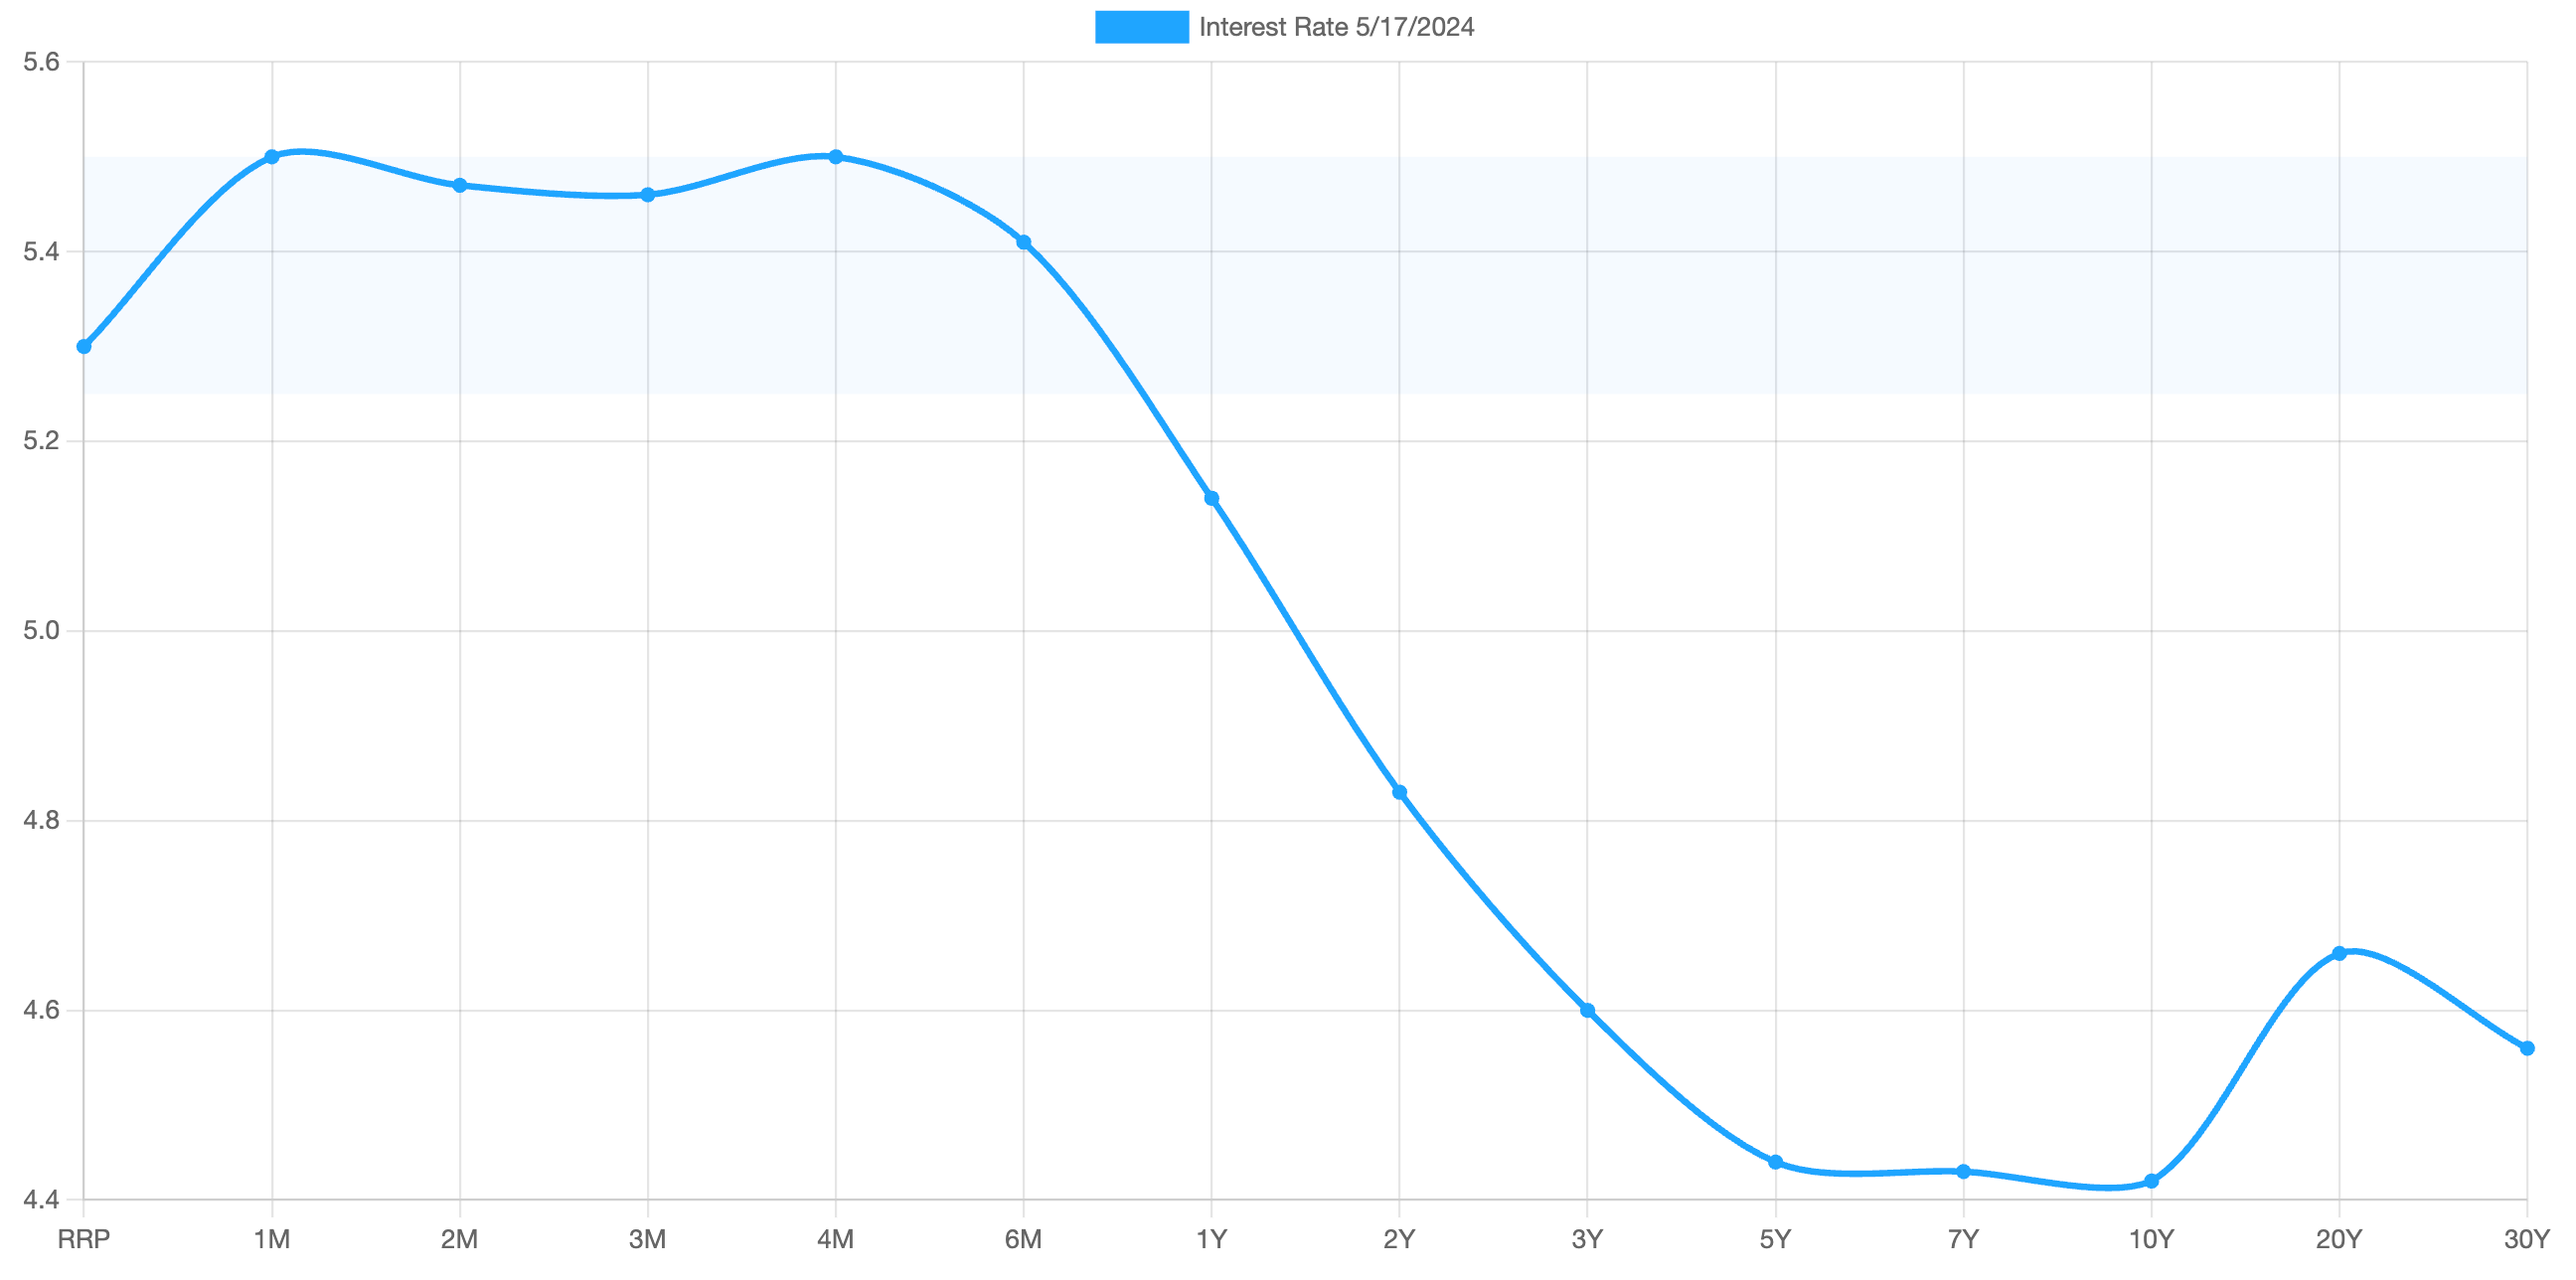
The highest rate on the yield curve (5.50%) is being paid for the 1-month duration and the lowest rate (4.42%) is for the 10-year.
The most closely-watched and commonly-used comparative measure of the spread between the higher 2-year and the lower 10-year rose from 0.37% to 0.41%, indicating a steepening in the inversion of the curve last week.
The interest rate yield curve remains unusually “inverted” (i.e. shorter term interest rates are generally higher than longer term ones). Based on the 2-year vs. 10-year spread, the curve has been inverted since July 2022.
Historically, an inverted yield curve is not the norm and has been regarded by many as a leading indicator of an impending recession, with shorter term risk regarded to be unusually higher than longer term. The steeper the inversion, the greater the deemed risk of recession.
Data courtesy of ustreasuryyieldcurve.com as of Friday. The lightly shaded area on the chart shows the current Federal Funds rate range.
WWW.ANGLIAADVISORS.COM | SIMON@ANGLIAADVISORS.COM | CALL OR TEXT: (646) 286 0290 | FOLLOW ANGLIA ADVISORS ON INSTAGRAM
This material represents a highly opinionated assessment of the financial market environment based on assumptions and prevailing data at a specific point in time and is always subject to change at any time. Although the content is believed to be correct at the time of publication, no warranty of its accuracy or completeness is given. It is never to be interpreted as an attempt to forecast any future events, nor does it offer any kind of guarantee of any future results, circumstances or outcomes.
The material contained herein is not necessarily complete and is wholly insufficient to be exclusively relied upon as research or investment advice or as a sole basis for any investment or other financial decisions. The user assumes the entire risk of any decisions made or actions taken based in whole or in part on any of the information provided in this or any Anglia Advisors communication of any kind. Under no circumstances is any of Anglia Advisors’ content ever intended to constitute tax, legal or medical advice and should never be taken as such. Neither the information contained or any opinion expressed herein constitutes a solicitation for the purchase of any security or asset class.
Posts may contain links or references to third party websites or may post data or graphics from them for the convenience and interest of readers. While Anglia Advisors might have reason to believe in the quality of the content provided on these sites, the firm has no control over, and is not in any way responsible for, the accuracy of such content nor for the security or privacy protocols that external sites may or may not employ. By making use of such links, the user assumes, in its entirety, any kind of risk associated with accessing them or making use of any information provided therein.
Those associated with Anglia Advisors, including clients with managed or advised investments, may maintain positions in securities and/or asset classes mentioned in this post.

If you enjoyed this post, why not share it with someone or encourage them to subscribe themselves?


