


There’s a very accurate saying that that you can win just about any financial argument you like by simply adjusting the start and end dates of a scenario. There’s a perfect example of this on show right now with the most important question of all to investors.
Is what we have seen over the last few weeks a temporary pullback within what is still a bull (rising) market that dates back to March of this year .. or .. is what we have seen over the last few months a temporary rally within what is still a bear (falling) market that dates back to the end of 2021?
The highly-respected and influential Charles Schwab Chief Investment Analyst, Liz Ann Sonders, climbed off the fence last week and put herself squarely in the second camp, saying that she now thinks that what we are currently witnessing is the death of the March-July rally and a reversion back to the declining trend that began in late 2021. The implication being, of course, that the S&P 500 lows of October 2022 (which are about 20% below where we are now) could well be tested again.
Terrified as I am to go up against Liz Ann who I admire immensely, I am personally still hanging on to the opposite view to her (albeit by a narrower and narrower thread); that 2023’s stock market rally is currently being interrupted rather than terminated.
On Monday, oversold stocks bounced back from a miserable couple of weeks with the most-beaten down names coming back the most vigorously. This was despite yet another day of rising market rates with 16-year interest rate highs being reached by the 10 Year Treasury Bond. By the next day, however, a “Sell The Rally” mentality seemed to have taken over with stock investors taking the opportunity of Monday’s spike to sell and lock in profits.
Tuesday’s sour tone was not helped by Standard & Poor’s ratings agency downgrading the credit ratings of several regional banking lenders including KeyCorp (KEY), Comerica (CMA), Valley National Bancorp (VLY), UMB Financial (UMBF), and Associated Banc-Corp (ASB), citing liquidity concerns.
Wednesday was dominated by giddy excitement over the upcoming after-the-close earnings release of chip maker Nvidia (NVDA) and markets shifted nicely higher again in anticipation. After the bell, we learned that the company had indeed absolutely crushed earnings and revenue expectations. It reported $13.5 billion in revenue for Q2, up an astonishing 88% from Q1. It also projected Q3 revenue to hit $16 billion. Sales were more than double those from the same quarter a year previously. All these numbers blew away analysts’ estimates.
But any broader feel-good effects from Nvidia’s outstanding results proved to be only fleeting once things opened on Thursday. The market doesn’t generally discount the same information twice (remember it was the spectacular Q1 results from Nvidia that had already driven the stock price up by nearly 50% since May) and by lunchtime, markets were down in the dumps again as concerns grew about what Chairman Jerome Powell might say (and not say) the next day at the Federal Reserve’s equivalent of its Burning Man festival in Jackson Hole, Wyoming. Wednesday’s handsome market gains were quickly extinguished by a pretty ugly Thursday decline.
Powell made his much-anticipated speech on Friday morning and it can be summed up in four words: “This ain't over yet.” He sent no explicit signals about the Fed's immediate intentions on interest rates, but his comments set the stage for the central bank to hold things steady or raise interest rates further in the months ahead, if needed - while dismissing the possibility of interest rate cuts any time soon.
Markets weren’t sure how to react at first. Stocks, bonds and the US dollar all see-sawed in the hours following the speech before finally seeming to decide that actually Powell hadn’t really said anything new and stocks shifted solidly higher in the afternoon, helped by investors finally deciding to flip the recent script and “Buy The Dip” (see EXPLAINER: FINANCIAL TERM OF THE WEEK below). It was this that helped rescue what was a volatile, topsy-turvy five days. The S&P 500 and NASDAQ-100 both somehow ended up in the green for the week.
Bottom line, the market of 2023 in many ways resembles the current political climate in this country in that it is being defined by hyperbolic extremes. We started the year with everyone deathly afraid of a catastrophic and unavoidable recession, 1970’s style inflation and 1970’s-style interest rates. None of that happened and at some point markets decided that the Wicked Witch was dead and it was now blue skies all the way. Stocks ripped higher on a runaway train powered mostly by overly-positive sentiment (partly due to AI-mania) and extreme greed as measured by the FEAR & GREED INDEX (see below). But just because Armageddon did not come to pass when it was expected to, it is still entirely possible that:
a significant and rather painful economic slowdown will occur,
inflation will not magically crash to late 20-teens levels in the near future,
the Fed may actually be telling the truth and will not suddenly set about cutting interest rates soon (which is what markets had priced in at the end of July when the S&P 500 was flirting with closing above 4,600).
The eventual truth likely lies in the middle somewhere and that’s where markets are sitting right now, as demonstrated by the day-to-day indecisive up/down/up/down/up dynamic that we saw last week. Where we go from here - and how quickly - in the coming weeks is critical to the health, or even the continued existence, of the 2023 rally.
OTHER NEWS ..
Car Trouble .. Auto-loan delinquencies are surging. Just one new car model now sells for less than $20k - down from about a dozen just five years ago. Considerably higher interest rates are only making buyers’ situations even more difficult. The average interest rate charged for a new car loan is now 9.5%, according to Cox Automotive. There aren’t many bargains on the used-car lot either, where the average vehicle lists for about $27k - up more than 30% from pre-pandemic levels. For used car loans, the average interest rate is higher, at almost 14%.
These numbers could explain why, despite a strong jobs market and robust wage growth, seasonally-adjusted rates of severe delinquency for car loans are the highest since James Blunt squealed that you’re beautiful in 2006. Clearly, an increasing number of consumers cannot afford the auto loans that they are taking on.
Airbnb Crackdown .. Thousands of New York City Airbnb listings are vanishing from the marketplace. The city is about to clamp down on all Airbnb rentals. NYC officials say that, starting on September 5th, they will be more aggressively enforcing rules on short-term rentals, including already-existing requirements that hosts must first register with the city and not rent out an entire apartment or home. Hosts are also required to be present at the property during their guests’ short-term stays. In response and in preparation for the crackdown, NYC listings are being rapidly removed from the platform.
New York’s enforcement is one of the more high-profile recent examples of cities coming down hard on short-term rentals. There were recently over 38k Airbnb listings in the city, not counting hotels that list on the platform. The annual net revenue for these listings is over $85 million. The city estimates there are about 11k illegal short-term rentals citywide.
How Much To Move? .. The lowest annual pay that would entice the average American worker to switch jobs hit a record high $78,645 in July. The so-called “national reservation wage” is up from $72,900 a year earlier, a New York Fed survey showed. And while the pay demand by women rose 11%, twice as fast as for men, they’re not asking for as much. Men want about $91k to jump jobs, while women are looking for about $25k less.
UNDER THE HOOD ..
The S&P 500 index SPX closed on Friday at 4406, up a little for the week. The next upside resistance points are to be found at 4425, 4439 and 4453. Downside support levels are at 4355, 4320 and 4290.
Despite passing the milestone last week of 600 days without a new market high (something that felt like almost a weekly occurrence at times back in late 2020 and much of 2021), most meaningful indicators of demand, breadth, and momentum remain above their March lows, and while that condition persists, the dominant uptrend should remain intact from a technician’s standpoint.
Stock markets shifted quickly from fully overbought to fully oversold in the space of less than four weeks culminating in last Thursday’s big down day. Friday’s rebound may well have been partly as a result of that oversold condition.
This has created an important technical inflection point for the stock market. It passed its first test, but if it fails to consistently and decisively rebound from any future fully oversold short term conditions, then the primary trend could well change direction once again, this time for the worse.
Anglia Advisors clients are welcome to reach out to me to discuss market conditions further.
THIS WEEK’S UPCOMING CALENDAR ..
New data on the U.S. labor market will be this week's highlight, as well as a few more earnings reports plus the latest inflation data.
Best Buy, Hewlett Packard, Salesforce, Broadcom, Dollar general and Campbell Soup will all report this week.
The Bureau of Labor Statistics (BLS) will publish the results of the July Job Openings and Labor Turnover Survey (JOLTS). Forecasts are for available job openings to hold about flat from a month earlier.
Then on Jobs Day Friday, a gain of 175k payrolls for August is expected - which would be another small deceleration from the prior month. The unemployment rate is forecast to hold steady at 3.5%. Average hourly earnings are seen rising 0.4% month-over-month, matching July's pace.
A 0.3% rise in income and a 0.7% increase in spending for last month is expected in the latest release of the Federal Reserve’s preferred inflation measure, the Core Personal Consumption Expenditures (Core PCE) price index (the one that excludes food and energy prices), which would indicate core inflation to be at 4.2% year over year.
LAST WEEK BY THE NUMBERS ..
Last week’s market color courtesy of finviz.com

Last week’s best performing US sector: Real Estate (two biggest holdings: Prologis, American Tower) - up 1.59% for the week.
Last week’s worst performing US sector: Energy (two biggest holdings: Exxon Mobil, Chevron) - down 0.75% for the week.
The proprietary Lowry's measure for US Market Buying Power is currently at 146 and fell by 5 points last week and that of US Market Selling Pressure is now at 138 and rose by 1 point over the course of the week.
SPY, the S&P 500 Large Cap ETF, is made up of the stocks of the 500 largest US companies. It is below its 50-day moving average but still above its 90-day and its long term trend line, with a RSI of 45***. SPY ended the week 7.9% below its all-time high (01/03/2022).
IWM, the Russell 2000 Small Cap ETF, is made up of the bottom two-thirds in terms of company size of the group of the 3,000 largest US stocks. It is below its 50-day moving average, right at its 90-day but still above its long term trend line, with a RSI of 37***. IWM ended the week 24.1% below its all-time high (11/05/2021).
*** RSI (Relative Strength Index) above 70: technically overbought, RSI below 30: technically oversold
The VIX, the commonly-accepted measure of expected upcoming stock market risk and volatility (often referred to as the “fear index”) implied by S&P 500 index option trading, ended the week 1.6 points lower at 15.7. It is above its 50-day moving average, right at its 90 day but still below its long term trend line.
AVERAGE 30-YEAR FIXED RATE MORTGAGE ..
7.23%
(one week ago: 7.09%, one month ago: 6.81%, one year ago: 5.55%)
Data courtesy of: FRED Economic Data, St. Louis Fed as of Thursday of last week.
LATEST GROSS DOMESTIC PRODUCT (GDP) GROWTH ESTIMATE FOR THIS QUARTER ..
Q3: +5.9%
(Previous quarters .. Q2: +2.4% provisional .. Q1: +2.0% final)
This data comes from the Atlanta Fed which periodically issues its GDPNow model “now-cast”, which is a running algorithmic estimate of real seasonally-adjusted GDP growth for the current measured quarter based on multiple data points of recent economic releases. There are no subjective adjustments made to GDPNow—the estimate is based solely on the mathematical results of the model.
FEAR & GREED INDEX ..
“Be fearful when others are greedy and be greedy when others are fearful.” Warren Buffet.
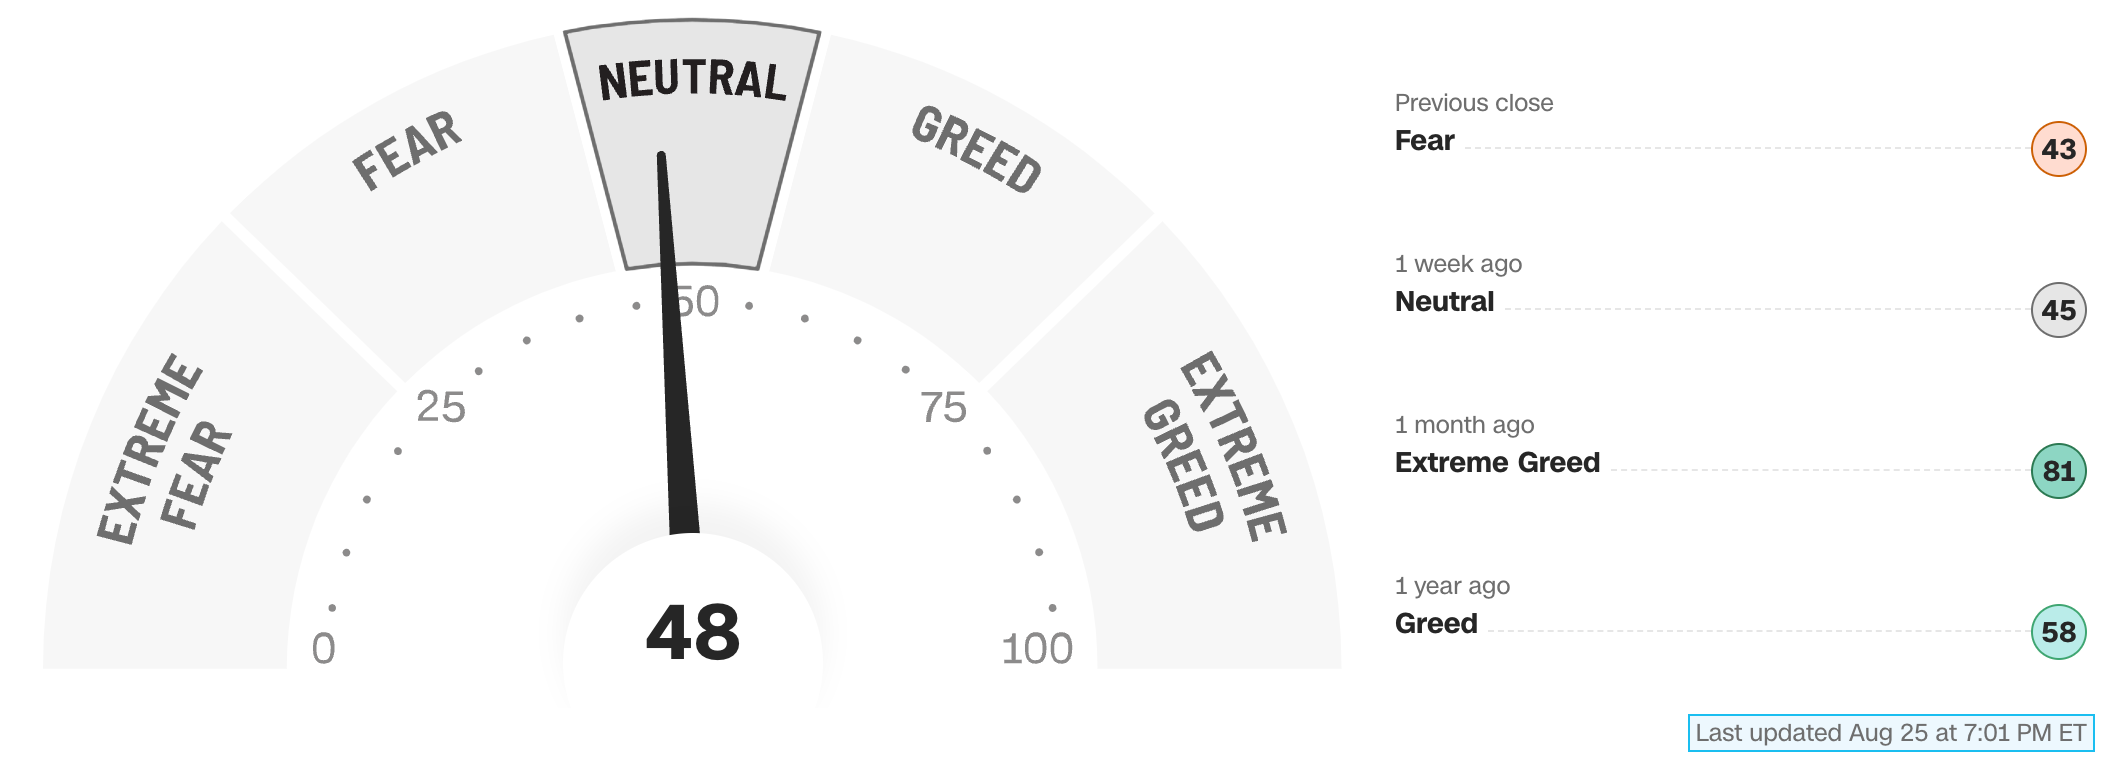
The Fear & Greed Index from CNN Business can be used as an attempt to gauge whether or not stocks are fairly priced and to determine the mood of the market. It is a compilation of seven different indicators that measure some aspect of stock market behavior. They are: market momentum, stock price strength, stock price breadth, put and call options, junk bond demand, market volatility and safe haven demand.
Extreme Fear readings can lead to potential opportunities as investors may have driven prices “too low” from a possibly excessive risk-off negative sentiment.
Extreme Greed readings can be associated with a sense of “FOMO” and investors chasing rallies in an excessively risk-on environment, possibly leaving the market vulnerable to a sharp downward correction at some point.
Data courtesy of CNN Business.
AAII US INVESTOR SENTIMENT (outlook for the upcoming 6 months) ..
↑Bullish: 32% (36% a week ago)
⬌ Neutral: 32% (34% a week ago)
↓Bearish: 36% (30% a week ago)
Net Bull-Bear spread: ↓Bearish by 4 (Bullish by 6 a week ago)
For context: Long term averages: Bullish: 38% — Neutral: 32% — Bearish: 30% — Net Bull-Bear spread: Bullish by 8
Weekly sentiment survey participants are typically polled on Tuesdays and/or Wednesdays.
Data courtesy of: American Association of Individual Investors (AAII).
FEDWATCH INTEREST RATE PREDICTION TOOL ..
What are the latest market expectations for what the Fed will announce re: interest rate changes (Fed Funds rate, currently 5.375%) on September 20th after its next meeting?
⬌ No change .. 81% probability
(one week ago: 89%, one month ago: 79%)
↑ 0.25% increase .. 19% probability
(one week ago: 11%, one month ago: 21%)
Where will interest rates (Fed Funds rate, currently 5.375%) be at the end of 2023?
↓ Lower than now .. 3% probability
(one week ago: 9%, one month ago: 5%)
⬌ Unchanged from now .. 43% probability
(one week ago: 60%, one month ago: 59%)
↑ Higher than now .. 54% probability
(one week ago: 31%, one month ago: 36%)
Data courtesy of CME FedWatch Tool. Calculated from Federal Funds futures prices as of Friday.
US TREASURY INTEREST RATE YIELD CURVE ..
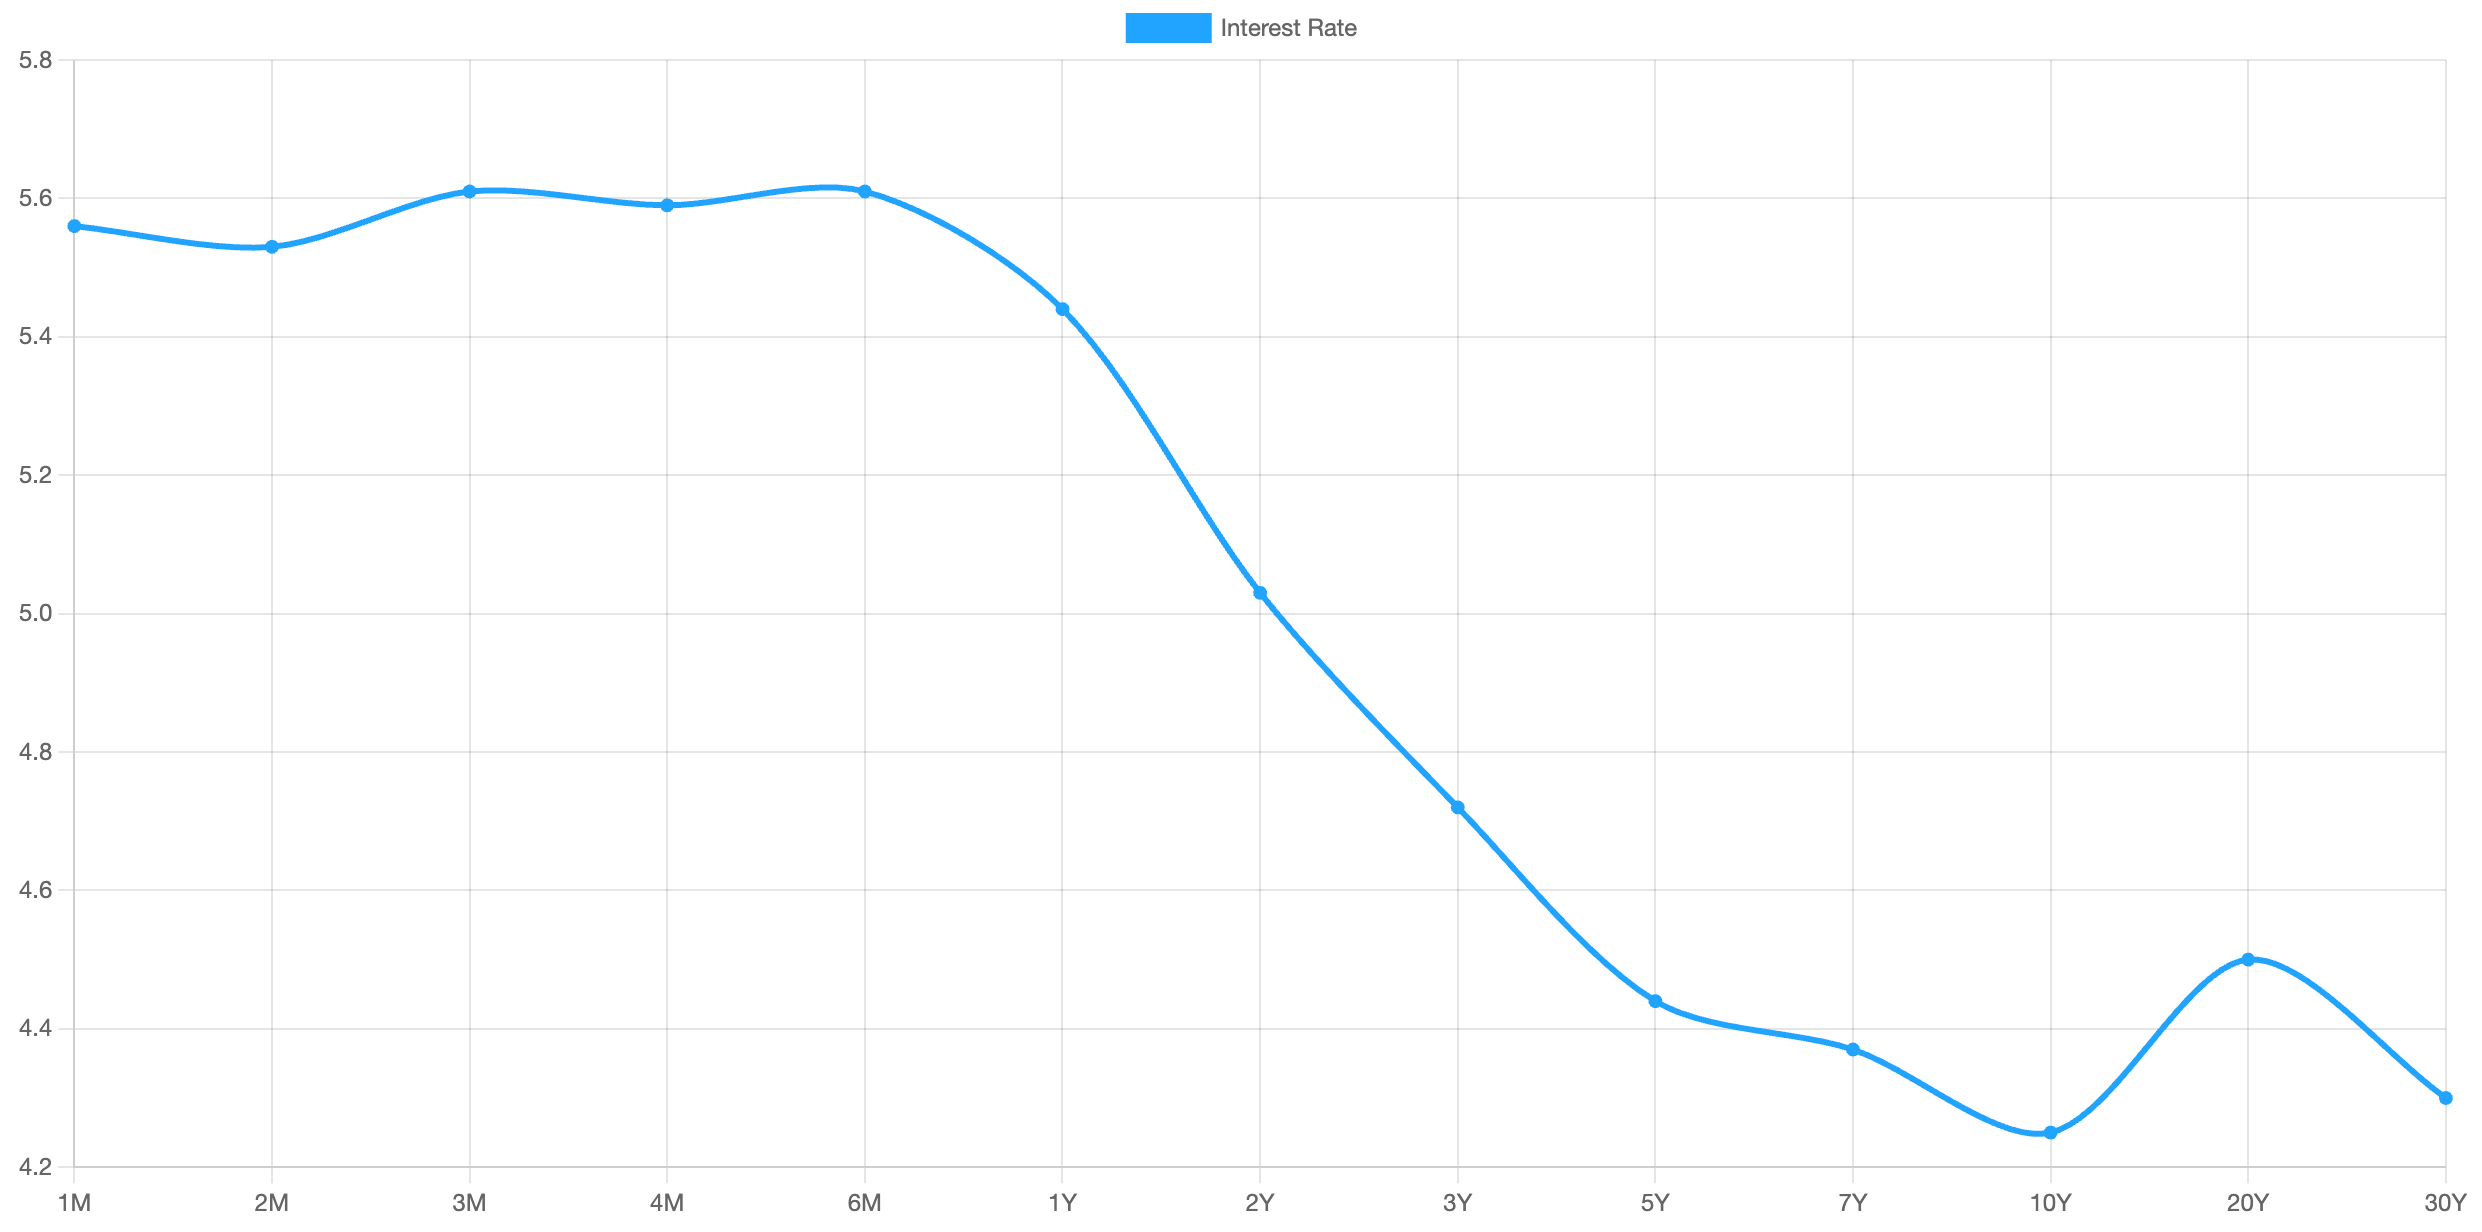
The interest rate yield curve remains “inverted” (i.e. shorter term interest rates are generally higher than longer term ones) with the highest rate (5.61%) being paid currently for the 3-month duration and the lowest rate (4.25%) for the 10-year.
The closely-watched and most commonly-used comparative measure of the spread between the 2-year and the 10-year rose from 0.66% to 0.78%, indicating a steepening in the inversion of the curve during the last week.
Historically, an inverted yield curve has been regarded as a leading indicator of an impending recession, with shorter term risk deemed to be unusually higher than longer term. The steeper the inversion, the greater the deemed risk of recession.
The curve has been inverted since July 2022 based on the 2 year vs. 10 year spread.
Data courtesy of ustreasuryyieldcurve.com as of Friday.
ARTICLE OF THE WEEK ..
What skills lead to the highest paying jobs in 2023?
EXPLAINER: FINANCIAL TERM OF THE WEEK ..
A weekly feature using information found on Investopedia to try to help explain Wall Street gobbledygook (may be edited at times for clarity).
Buying the dips refers to going long an asset or security after its price has experienced a short-term decline, in repeated fashion.
Buying the dips can be profitable in long-term uptrends, but unprofitable or tougher during secular downtrends.
Dip buying can lower one's average cost of owning a position, but the risk and reward of dip-buying should be constantly evaluated.
"Buy the dips" is a common phrase investors and traders hear after an asset has declined in price in the short-term. After an asset's price drops from a higher level, some traders and investors view this as an advantageous time to buy or add to an existing position. The concept of buying dips is based on the theory of price waves. When an investor buys an asset after a drop, they are buying at a lower price, hoping to profit if the market rebounds.
Buying the dips has several contexts and different odds of working out profitably, depending on the situation. Some traders say they are "buying the dips" if an asset drops within an otherwise long-term uptrend. They hope the uptrend will resume after the drop.
Others use the phrase when no secular uptrend is present, but they believe an uptrend may occur in the future. Therefore, they are buying when the price drops in order to profit from some potential future price rise.
If an investor is already long and buys on the dips, they are said to be averaging down, an investing strategy that involves purchasing additional shares after the price has dropped further, resulting in a lower net average price. If, however, dip-buying does not later see an upturn, it is said to be adding to a loser.
Like all trading strategies, buying the dips does not guarantee profits. An asset can drop for many reasons, including changes to its underlying value. Just because the price is cheaper than before doesn't necessarily mean the asset represents good value.
The problem is that the average investor has very little ability to distinguish between a temporary drop in price and a warning signal that prices are about to go much lower. While there may be unrecognized intrinsic value, buying additional shares simply to lower an average cost of ownership may not be a good reason to increase the percentage of the investor's portfolio exposed to the price action of that one stock. Proponents of the technique view averaging down as a cost-effective approach to wealth accumulation; opponents view it as a recipe for disaster.
A stock that falls from $10 to $8 might be a good buying opportunity, and it might not be. There could be good reasons why the stock dropped, such as a change in earnings, dismal growth prospects, a change in management, poor economic conditions, loss of a contract, and so forth. It may continue to drop—all the way to $0 if the situation is bad enough.
WWW.ANGLIAADVISORS.COM | SIMON@ANGLIAADVISORS.COM | CALL OR TEXT: (929) 677 6774 | FOLLOW ANGLIA ADVISORS ON INSTAGRAM
This material represents a highly opinionated assessment of the financial market environment based on assumptions and prevailing data at a specific point in time and is always subject to change at any time. No warranty of its accuracy or completeness is given. It is never to be interpreted as an attempt to forecast any future events, nor does it offer any kind of guarantee of any future results, circumstances or outcomes.
The material contained herein is not necessarily complete and is wholly insufficient to be exclusively relied upon as research or investment advice or as a sole basis for any investment or other financial decisions. The user assumes the entire risk of any decisions made or actions taken based in whole or in part on any of the information provided in this or any Anglia Advisors communication of any kind. Under no circumstances is any of Anglia Advisors’ content ever intended to constitute tax, legal or medical advice and should never be taken as such. Neither the information contained or any opinion expressed herein constitutes a solicitation for the purchase of any security or asset class.
Posts may contain links or references to third party websites or may post data or graphics from them for the convenience and interest of readers. While Anglia Advisors may have reason to believe in the quality of the content provided on these sites, the firm has no control over, and is not in any way responsible for, the accuracy of such content nor for the security or privacy protocols that external sites may or may not employ. By making use of such links, the user assumes, in its entirety, any kind of risk associated with accessing them or making use of any information provided therein.
Those associated with Anglia Advisors, including clients with managed or advised investments, may maintain positions in securities and/or asset classes mentioned in this post.

If you enjoyed this post, why not share it with someone or encourage them to subscribe themselves?


