


It is said on Wall Street that the goal of the market is to extract the maximum amount of pain from the greatest number of people. What this is getting at is that when everyone is positioned as bullish, the pain trade is for markets to move lower. When everyone is bearish, the pain trade is for them to go higher.
As such, the pain trade has been mostly inflicted on the bears so far in 2023 and is helping support stocks, despite decidedly dodgy economic fundamentals. Sentiment matters in the short-term and so the pain trade was to push the market higher to some degree, especially after general caution gave way to fully-fledged bearish sentiment following the bank failures in mid-March and increasing evidence that the economy may be starting to crash.
However, it seems that sentiment may shifting again after some surprisingly decent early earnings reports, recent hopeful inflation data and the end of rate hikes finally coming into view. It’s worth keeping an eye on sentiment in this regard (I show the latest AAII Investor Sentiment Index readings every week in this report, see below) as the direction of the pain trade may be about to flip.
For the moment markets remain resilient, but that resiliency has been underpinned by the aggressive idea of an imminent “Fed hike/pause/pivot/cut” interest rate narrative and an only-gradual slowing of economic growth. We won’t know if this thesis is correct until we can properly assess how deep the economic slowdown is going to be.
While the chances of the US completely avoiding a recession seem small, there is still a very legitimate possibility that it may only be a mild one. Consider the following ..
• The S&P 500 is up 25% from the pre-pandemic levels of January 2020.
• The National Home Price Index is up 38% from January 2020.
• Wages have risen 53% since January 2020.
• Pandemic stimulus across 476 million payments totaled more than $814 billion-worth of deposits which went straight into the pockets of American consumers.
• 90% of the $770 billion Paycheck Protection Program (PPP) loans have been completely or partially forgiven, injecting massive stimulus into the economy.
The critical point here is that consumers have simply had more money to work through before they have to start changing their behavior in response to inflation and the Fed’s interest rate hikes. This goes a long way to explaining why the Fed has had to raise interest rates again and again and again at a historically unprecedented rate of basically 0% to 5% in the space of a year, simply in order to get the attention of the American consumer who entered last year flush with stimulus money, a suddenly much more valuable home bought or re-financed using an ultra-low fixed rate mortgage, higher wages and a fatter investment portfolio. The result was that turbo-charged rate hike campaign that severely damaged both the stock and bond markets which made 2022 uniquely painful even for the most diversified of portfolios.
The first shots were fired last week in the upcoming congressional grandstanding about the debt ceiling (see EXPLAINER: FINANCIAL TERM OF THE WEEK below). “Let me be clear: a no-strings-attached debt limit increase cannot pass .. debt limit negotiations are an opportunity to examine our nation’s finances." bellowed House Speaker Kevin McCarthy during a speech at the New York Stock Exchange, of all places. Chuck Schumer shot right back,"If Speaker McCarthy doesn't change his course, he could well take this country to default."
Investors aren't yet paying any serious attention to the back-and-forth sniping, even though the last serious debt ceiling battle in 2011 did cause tumbling markets and a downgrade of US debt. While we can expect some occasional short-term market volatility at times when the irksome squealing reaches fever pitch, I think it is very important to maintain a distinction between tiresome short-term Washington gamesmanship and any potential long-term damage to investment portfolios.
Traders seem to have settled into the idea of a quarter-point rate increase from the Fed next month (that probability is now up to 89%, see FEDWATCH INTEREST RATE PREDICTION TOOL below) and early earnings have been mostly fine, with just a few disappointments here and there. The result has been a collective yawn for much of the last week or two. But with earnings about to hit full steam this week (see THIS WEEK’S UPCOMING CALENDAR below), investors will finally have plenty to think about beyond just inflation, interest rates and yield curves. Earnings season has a way of returning investors' attention to the fundamentals and the bottom line.
One of the single, most dominant market dynamics right now is the deeply inverted yield curve and, for that reason, starting this week I have begun to monitor it as one of my important data points shown in this report each week (see US TREASURY INTEREST RATE YIELD CURVE below).
OTHER NEWS ..
Due Diligence Queen .. Investors recently launched lawsuits against Sam Bankman-Fried, the disgraced crypto bro founder of FTX and also against those who shilled for him in return for very large compensation, including quarterback Tom Brady and his ex-wife, Gisele Bündchen, Larry David, Kevin “Mr. Wonderful” O’Leary, David “Big Papi” Ortiz, tennis player Naomi Osaka as well as the NBA’s Steph Curry and Shaquille O’Neal. They were all charged along with others with taking a lot of money in order to participate in the duping of the millions who lost billions when SBF’s crypto house of cards came tumbling down.
However, there was one person who was smart enough not to fall for the hype. It emerged last week that, unlike the afore-mentioned money-grubbing band of hoodwinked celebs who’ll obviously say anything for a buck without looking into what it is they are peddling or any of their highly-compensated advisors who push them to do so in order to earn their own slice of the pie through commissions, Taylor Swift apparently thought to actually ask about the status of the investments as “unregistered securities”, promotion of which for financial gain makes an individual liable to claims for damages. She obviously did not like the answer she got since she declined the opportunity to promote SBF and his fraudulent enterprise.
You can shove your savings account .. Higher interest rates have so far been good news for the big banks, which have been able to charge borrowers more on loans and credit cards, but not pay as much interest to depositors. Currently, the annual interest rate paid to customers by big bank savings accounts averages a miserly 0.37% as opposed to an easily available 4.35% or more elsewhere).
Unsurprisingly, the banks’ clientele is increasingly telling the banks to stick their savings accounts and is moving its money into deposits at these other institutions and instruments that pay a much higher interest rate with zero fees and sometimes much higher levels of FDIC or SIPC insurance coverage than the traditional $250k per account offered by high street banks.
Credit spike .. Despite increasing interest charges, Americans spent big on credit cards in Q1 2023, according to an article in the Wall Street Journal last week. Bank of America said that spending on its credit cards rose 6% from a year earlier. Credit card spending was up 13% year-on-year at JP Morgan, 7% at Citigroup and 16% at Wells Fargo. Overall credit card loan balances rose sharply at the four banks, a sign that a growing number of people are now not paying off their full balances each month.
UNDER THE HOOD ..
Anyone measuring the stock market’s health solely by the gains made in the S&P 500 is not seeing the big picture. While the index, along with its large-cap cousins, the Dow Jones Industrial Average (DJIA) and the NASDAQ, have enjoyed respectable gains since early March, this has obscured the fact that smaller stock indexes are still reeling from the bank-induced sell-off six weeks ago. When it is only the largest and most high profile portion of the market that is truly rallying, gains are typically unsustainable.
Lowry’s Percent of Large Cap Stocks 20% or More Below One Year Highs rose from 16% on the S&P 500 highs of February 2nd to 19% currently, indicating that less than one in five of Large Cap stocks are now in bear markets.
Lowry’s Percent of Mid Cap Stocks 20% or More Below One Year Highs rose from 23% on February 2nd to 34% currently, indicating that about one in three Mid Cap stocks are now in bear markets.
Lowry’s Percent of Small Cap Stocks 20% or More Below One Year Highs rose from 39% on February 2nd to 57% currently, indicating that well over half of all Small Cap stocks are now in bear markets.
So large caps are clearly responsible for propping up the major indexes. This type of behavior is the exact opposite of what occurs in the early stages of new bull markets when investors typically feel emboldened to take on more risk and reach for the most beaten-down, usually smaller stocks.
Such a selective rally indicates that the path of least resistance remains to the downside and that the recent advance may be on thin ice.
Anglia Advisors clients are welcome to reach out to me to discuss market conditions further.
THIS WEEK’S UPCOMING CALENDAR ..
Q1 2023 earnings season ramps up hard this week, with some 170 of the S&P 500 firms scheduled to report, including many of the largest. These include Microsoft, Alphabet/Google, Meta/Facebook, Amazon, Intel, Exxon Mobil, Coca-Cola, PepsiCo, Verizon, T-Mobile US, Boeing, eBay, McDonald’s, General Motors, Chevron, General Electric, Caterpillar, Comcast, Eli Lilly, UPS, Visa, Mastercard, Newmont, 3M, Texas Instruments and, interestingly, First Republic.
We will get our first estimate of three for Q1 Gross Domestic Product (GDP). It's expected to show a seasonally-adjusted annualized rate of economic growth of 1.8%, following a 2.1% increase for all of 2022.
Other notable economic data coming out this week will include the Consumer Confidence Index for April and the Durable Goods report for March.
AVERAGE 30-YEAR FIXED RATE MORTGAGE ..
6.39%
(one week ago: 6.27%, one month ago: 6.42%, one year ago: 5.11%)
Data courtesy of: FRED Economic Data, St. Louis Fed as of Thursday of last week.
US INVESTOR SENTIMENT (outlook for the upcoming 6 months) ..
↑Bullish: 27% (26% a week ago)
↔ Neutral: 38% (39% a week ago)
↓Bearish: 35% (35% a week ago)
Net Bull-Bear spread: ↓Bearish by 8 (Bearish by 9 a week ago)
Data courtesy of: American Association of Individual Investors (AAII).
For context: Long term averages: Bullish: 38% — Neutral: 32% — Bearish: 30% — Net Bull-Bear spread: Bullish by 8
Weekly sentiment survey participants are usually polled on Tuesdays and/or Wednesdays.
US TREASURY INTEREST RATE YIELD CURVE ..
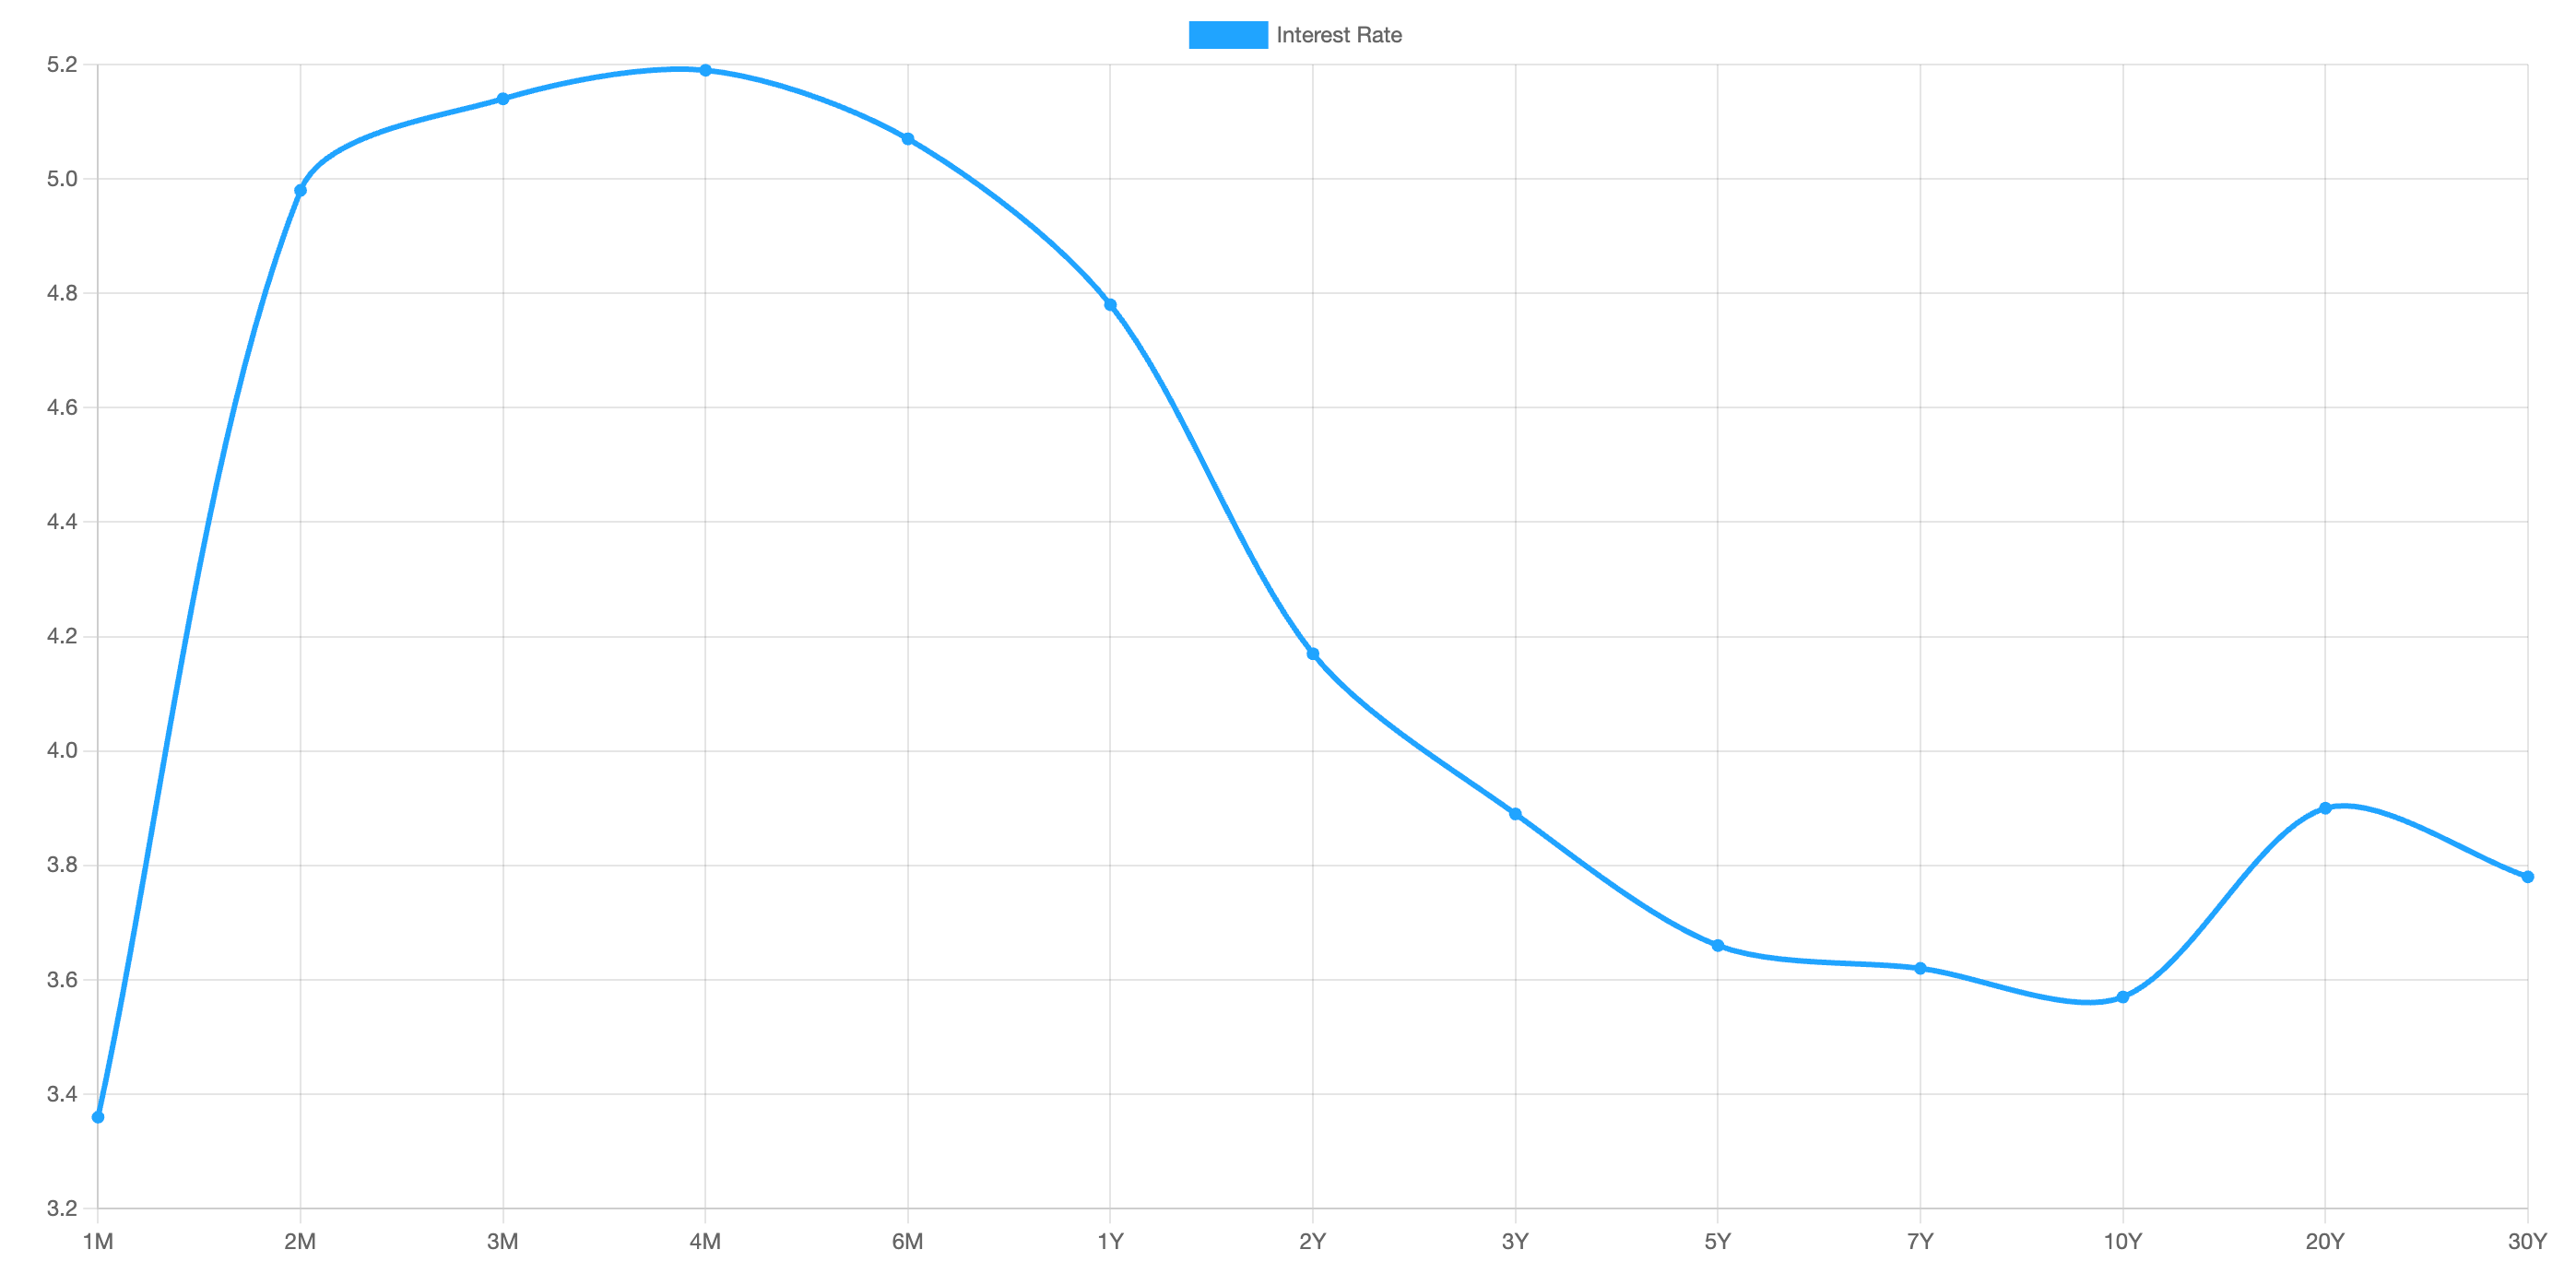
The interest rate yield curve remains “inverted” (i.e. most shorter term interest rates are higher than longer term ones) with the highest rate (5.19%) being paid currently for the 4-month duration and the lowest subsequent rate (3.57%) for the 10-year for a spread of 1.62% between the two.
A week ago this spread was 1.64%, indicating a slight flattening of the curve over the last five days.
The curve has been inverted since July 2022 based on the commonly-used comparative measure of the 2 year vs. the 10 year. Historically, an inverted yield curve has been regarded as a leading indicator of an impending recession, with shorter term risk unusually deemed to be higher than longer term.
Data courtesy of ustreasuryyieldcurve.com as of market close on Friday.
FEDWATCH INTEREST RATE PREDICTION TOOL ..
What are the latest market expectations for what the Fed will announce re: interest rate changes (Fed Funds rate, currently 4.875%) on May 3rd after its next meeting?
↔ No change .. 11% probability
(one week ago: 22%, one month ago: 36%)
↑ 0.25% increase .. 89% probability
(one week ago: 78%, one month ago: 60%)
Data courtesy of CME FedWatch Tool. Calculated from Federal Funds futures prices as of market close on Friday.
LAST WEEK BY THE NUMBERS ..
Last week’s market color courtesy of finviz.com:

- Last week’s best performing US sector: Consumer Defensive (two biggest holdings: Proctor & Gamble, Pepsico) - up 1.8% for the week
- Last week’s worst performing US sector: Energy (two biggest holdings: Exxon Mobil, Chevron) - down 2.6% for the week
- The proprietary Lowry's measure for US Market Buying Power is currently at 160 and fell by 10 points last week and that of US Market Selling Pressure is now at 145 and rose by 1 point over the course of the week.
- SPY, the S&P 500 ETF, remains above its 50-day and 90-day moving averages and above its long term trend line. SPY ended the week 13.7% below its all-time high (01/03/2022).
- QQQ, the NASDAQ-100 ETF, remains above its 50-day and 90-day moving averages and above its long term trend line. QQQ ended the week 21.6% below its all-time high (11/19/2021).
- VIX, the commonly-accepted measure of anticipated stock market risk and volatility (often referred to as the “fear index”), implied by S&P 500 index option trading, ended the week 0.3 points lower at 16.8. It remains below its 50-day and 90-day moving averages and below its long term trend line.
ARTICLE OF THE WEEK ..
Try to make your investment portfolio resemble a really damaging house fire.
EXPLAINER: FINANCIAL TERM OF THE WEEK ..
A weekly feature using information found on Investopedia to try to help explain Wall Street gobbledygook (may be edited at times for clarity).
The debt ceiling is the maximum amount of money that the United States can borrow cumulatively by issuing bonds. The debt ceiling was created under the Second Liberty Bond Act of 1917 and is also known as the debt limit or statutory debt limit.
If U.S. government national debt levels bump up against the ceiling, then the Treasury Department must resort to other extraordinary measures to pay government obligations and expenditures until the ceiling is raised again.
The debt ceiling has been raised or suspended numerous times over the years to avoid the worst-case scenario: a default by the U.S. government on its debt.
Congress had free rein over the country’s finances before the debt ceiling was created. In 1917, the debt ceiling was created during World War I to make the federal government fiscally responsible.
Over time, the debt ceiling has been raised whenever the United States has approached the limit. By hitting the limit and failing to pay interest payments to bondholders, the United States would be in default, lowering its credit rating and increasing the cost of its debt.
There has been controversy over whether the debt ceiling is constitutional. According to the 14th Amendment of the Constitution, “The validity of the public debt of the United States, authorized by law...shall not be questioned.” The majority of democratic countries do not have a debt ceiling, making the United States one of the few exceptions.
Implementing a debt ceiling is practical, allowing the U.S. Treasury to easily issue bonds without having Congress approve it each and every time the federal government needs to raise money—a pretty cumbersome process. With a debt ceiling, the boundaries are in place for a more efficient monetary approval process.
However, the debt ceiling has been notoriously fluid and raised a few times, raising questions on whether it’s effective as a tool to ensure fiscal responsibility. The U.S. has reached record-high levels of debt over time.
Pros:
Holds the nation’s finances in check
Can be used to fund federal operations
Improves efficiency in the government’s ability to fund obligations including Social Security and Medicare benefits
Cons:
Can be easily raised, encouraging fiscal irresponsibility
Lowers the U.S. credit rating and increases its cost of debt
Controversy over whether the debt ceiling is constitutional
There have been a number of showdowns over the debt ceiling, some of which have led to government shutdowns. The conflict is usually between the White House and Congress, and the debt ceiling is used as leverage to push partisan budgetary agendas.
For example, in 1995, the Republican members of Congress, whose views were vocalized by then-House Speaker Newt Gingrich, used the threat of refusing to allow an increase in the debt ceiling to negotiate increased government spending cuts.
Then-President Bill Clinton refused to make the cuts, which led to a shutdown of the government. The White House and Congress eventually agreed on a balanced budget with modest spending cuts and tax increases.
WWW.ANGLIAADVISORS.COM | SIMON@ANGLIAADVISORS.COM | CALL OR TEXT: (929) 677 6774 | FOLLOW ANGLIA ADVISORS ON INSTAGRAM
This material represents a highly opinionated assessment of the financial market environment based on assumptions and prevailing data at a specific point in time and is always subject to change at any time. No warranty of its accuracy is given. It is never to be interpreted as an attempt to forecast any future events, nor does it offer any kind of guarantee of any future results, circumstances or outcomes.
The material contained herein is wholly insufficient to be exclusively relied upon as research or investment advice or as a sole basis for any kind of investment decision or action. The user assumes the entire risk of any decisions or actions taken based on the information provided in this or any Anglia Advisors communication of any kind. Under no circumstances is any of Anglia Advisors’ content ever intended to constitute tax, legal or medical advice and should never be taken as such.
Posts may contain links or references to third party websites for the convenience and interest of readers. While Anglia Advisors may have reason to believe in the quality of the content provided on these sites, the firm has no control over, and is not in any way responsible for, the accuracy of such content nor for the security or privacy protocols that external sites may or may not employ. By making use of such links, the user assumes, in its entirety, any kind of risk associated with accessing them or making use of any information provided therein.
Clients of, and those associated with, Anglia Advisors may maintain positions in securities and asset classes mentioned in this post.

If you enjoyed this post, why not share it with someone or encourage them to subscribe themselves?


