


Despite the best efforts of the whining Congressional arsonists on both sides, the Biden/McCarthy debt deal cruised comfortably through the House of Representatives and the Senate and straight to Biden’s desk for signature yesterday, bringing an end to the whole completely unnecessary psychodrama.
Markets had briefly begun repricing the risk of there still being some kind of US government default, even a self-inflicted very short one, but it soon became clear that, while the burn-it-all-down crew of politicians might soon try to exact some form of internal revenge on their own “ideological traitors” who agreed to these compromises, their rather pathetic opposition to the successful passage of the deal was ultimately entirely impotent.
It’s important to realize that, yes, the market did briefly get a bit jittery but it never really priced in the worst-case debt ceiling scenario. Bringing the whole sorry episode to an end has merely removed a potential catastrophic negative and does not actually add anything new and positive into the macro set up.
What it does do is to now allow the focus of investors (not to mention that of the authors of weekly financial market reports) to return to proper concerns such as employment, whether the Fed hikes interest rates on June 14th and most important, the whole hard landing (inflation conquered at the cost of a meaningful recession) vs. soft landing (no recession or a very shallow one) thing.
Starting with employment; earlier last week, it had been announced that the number of unfilled job vacancies had surprisingly risen from 9.7 million in March to 10.1 million in April (forecasts had been for a decline to 9.4 million). That translated to 1.8 open jobs per unemployed worker in April.
Then on Friday we learned that the US economy created an astonishing 339k jobs in May, instead of the expected number of well below 200k. That is the 14th straight month that payroll numbers have beaten estimates. Plus the large April gains were revised even higher.
The unemployment rate, however, shifted higher, to 3.7%, up from 3.4%, reflecting an increase in the number of people who became unemployed in the last 30 days. Hourly wages only rose slightly, implying an increasingly under-control situation in this area.
Faced with these mixed signals, the stock market went with the recent path of least resistance and moved nicely higher on Friday in what was a rare across-the-board pop that saw most of the “soldiers” move forward into battle and not just the ”generals” as has been the case recently.
Moving on to the expectations for the Fed’s next interest rate announcement in less than two weeks’ time; there’s “no compelling reason” to pause rate hikes at the next Fed meeting, Cleveland Fed chief Loretta Mester said early in the week. The very-important-right-now futures market probability of such a pause at the next meeting swiftly declined as a result but then swung violently back the other way after multiple other Fed speakers like Governor Philip Jefferson, a centrist who often echoes Chair Jerome Powell’s views, proceeded to hint heavily that the Fed would indeed likely “skip” a June rate hike, but added that the rate-lifting cycle was likely not yet over.
Federal Reserve Bank of Philadelphia President Patrick Harker, a voting member of the committee that decides interest rate policy, even came right out and said it; “We should at least skip this meeting”.
The probability of no change in rates on June 14th ended the week at 72%, way more than double its reading of just a week ago (see FEDWATCH INTEREST RATE PREDICTION TOOL below). Inflation numbers ahead will likely solidify the Fed's next move.
In late February and early March, stocks were getting pounded because the February jobs report was a blowout and markets priced in more Fed rate hikes. The “terminal rate” expectations got as high as 5.625% and stocks dropped hard, as they should have. Then, Silicon Valley Bank and Signature Bank failed, soon to be followed by First Republic. Investors priced in a banking crisis and increased chances of recession/hard landing. Turns out neither of those things has happened - at least not yet. Meanwhile, economic data remains really, really resilient and Q1 2023 earnings fell by an awful lot less than had been feared by almost everyone.
Combine that with recent AI euphoria (see EXPLAINER: FINANCIAL TERM OF THE WEEK below) and, by virtue of the “pain trade” I outlined in my April 23rd report, you now have a NASDAQ that has ripped higher for six weeks in a row and an S&P 500 that is only a fraction away from being up 20% from its lows of October 2022, which would technically turn it from a bear market to a bull market by the accepted definition.
As regular readers will be bored of hearing from me by now, I will caveat the fact that headline indexes are strengthening by pointing out that the price of the average stock in the S&P 500 is actually negative for 2023 (vs. the index which is up close to 10%) and that the vast majority of the index’s gain comes from five or six stocks out of the 500. But nevertheless, a scenario whereby the other 495 or so stocks start to play catchup could be very interesting.
There are still many troublesome technical analysis concerns and worrying negative divergences which I continue to outline weekly in UNDER THE HOOD (below) and I am nowhere near calling the death of the bear, but you cannot help but be impressed with the stock market’s recent resilience right now.
OTHER NEWS ..
Grandmothers are the invisible glue .. Grandparents don’t get a lot of air time in the conversation about America’s child-care crisis. Yet some 42% of parents rely on their own parents to help care for children, a figure that is eerily close to the 40% of families that say they don’t have the child care they need.
Grandparents are critical to holding America’s creaking child-care system together, as reported by Bloomberg last week. They are often the first call when the regular day-care plan falls through, but the consequence is that many older women leave the workforce earlier than they’d like, putting their own financial security at risk. Working grandparents, like parents, would benefit from affordable and reliable child care, universal pre-school and paid parental leave.
About half of grandmothers are employed — some because they find work fulfilling, and many because they need the income. Many are also helping their adult children with expenses, including for the grandkids. That means many grandmothers are juggling caregiving with paid work, just as their daughters are. And some are leaving the workforce earlier than they would like to because of those caregiving responsibilities. Although workforce participation among women aged 25-54 just hit a new high again, women over 55 have not yet recovered from their pandemic-induced job losses.
The end of The Great Resignation .. Workers furiously quitting for new, likely higher-paying jobs is a thing of the past, it seems. The historic surge of quitters was a symptom of an on-fire labor market, where demand for workers far outstripped supply. But the quits rate fell to just 2.4% in April, according to last week’s Job Openings and Labor Turnover Survey (JOLTS) and puts us roughly back in line with the average rate of 2019. Even leisure and hospitality workers, once the poster children for the resignation boom, are seeing their quits rate return to pre-pandemic norms and well down from the peak last summer.
Accompanying this narrative is foot-traffic and rent data showing that the pandemic has shifted urban centers of gravity in major cities like New York, Los Angeles and Chicago, with residents no longer fleeing the cities en masse but rather moving away from increasingly sterile office districts to the city neighborhoods with a greater abundance of apartments, bars and restaurants.
UNDER THE HOOD ..
Very nearly half of all US stocks are now 20% or more below their one-year highs and are therefore considered to be in a bear market.
Read that again.
It should be clear to anyone that it is extremely hard for a broad market to move sustainably higher when the list of stocks falling into a bear market keeps getting longer and longer.
The price action of the high-valuation, mega-cap growth stocks is the likes of which we have not really seen since the dot-com bubble of the late 1990s and we all know how that ended. To that point, only the Technology and Communication Services sectors are trending higher relative to the benchmark index right now. Those dynamics are also not consistent with a shift to a sustainable, long-term bull market.
On the outside, the S&P 500 and the NASDAQ indexes look healthy, with rising trends even in the face of strong headwinds. However, there is disease beneath the visible skin. The problem is that we do not know how long the entire body can thrive before symptoms set in.
The path of least resistance is still higher for the stock indexes right now, technically speaking, but it is very much a “pain trade” as the 2023 rally is as hated as any in recent history, given rather underwhelming fundamentals. Many technicians are describing it as a “bull trap” within a long-term, still-intact bear market.
And between the inverted yield curve (see US TREASURY INTEREST RATE YIELD CURVE below), the lack of any of the traditional signs of a lasting bear market bottom (such as mass capitulation by buyers) having occurred in October 2022 and the negative technical signals flashing all over the place, the risk of a material shift lower in stock prices must still be respected.
Anglia Advisors clients are welcome to reach out to me to discuss market conditions further.
THIS WEEK’S UPCOMING CALENDAR ..
This week will be rather quiet before both major inflation data and a Federal Reserve interest rate decision on the same day next week. There are, however, still a few earnings and economic data releases to look forward to.
Earnings will include results from everybody’s favorite POS stock, GameStop on Monday followed by DocuSign, Vail Resorts, Campbell Soup, Ciena, J.M. Smucker, NIO and Gitlab
The economic data highlights of the week will be the Durable Goods report for April and the Services Purchasing Managers’ index for May.
AVERAGE 30-YEAR FIXED RATE MORTGAGE ..
6.79%
(one week ago: 6.57%, one month ago: 6.39%, one year ago: 5.09%)
Data courtesy of: FRED Economic Data, St. Louis Fed as of Thursday of last week.
US INVESTOR SENTIMENT (outlook for the upcoming 6 months) ..
↑Bullish: 29% (27% a week ago)
↔ Neutral: 34% (33% a week ago)
↓Bearish: 37% (40% a week ago)
Net Bull-Bear spread: ↓Bearish by 8 (Bearish by 13 a week ago)
Data courtesy of: American Association of Individual Investors (AAII).
For context: Long term averages: Bullish: 38% — Neutral: 32% — Bearish: 30% — Net Bull-Bear spread: Bullish by 8
Weekly sentiment survey participants are usually polled on Tuesdays and/or Wednesdays.
US TREASURY INTEREST RATE YIELD CURVE ..
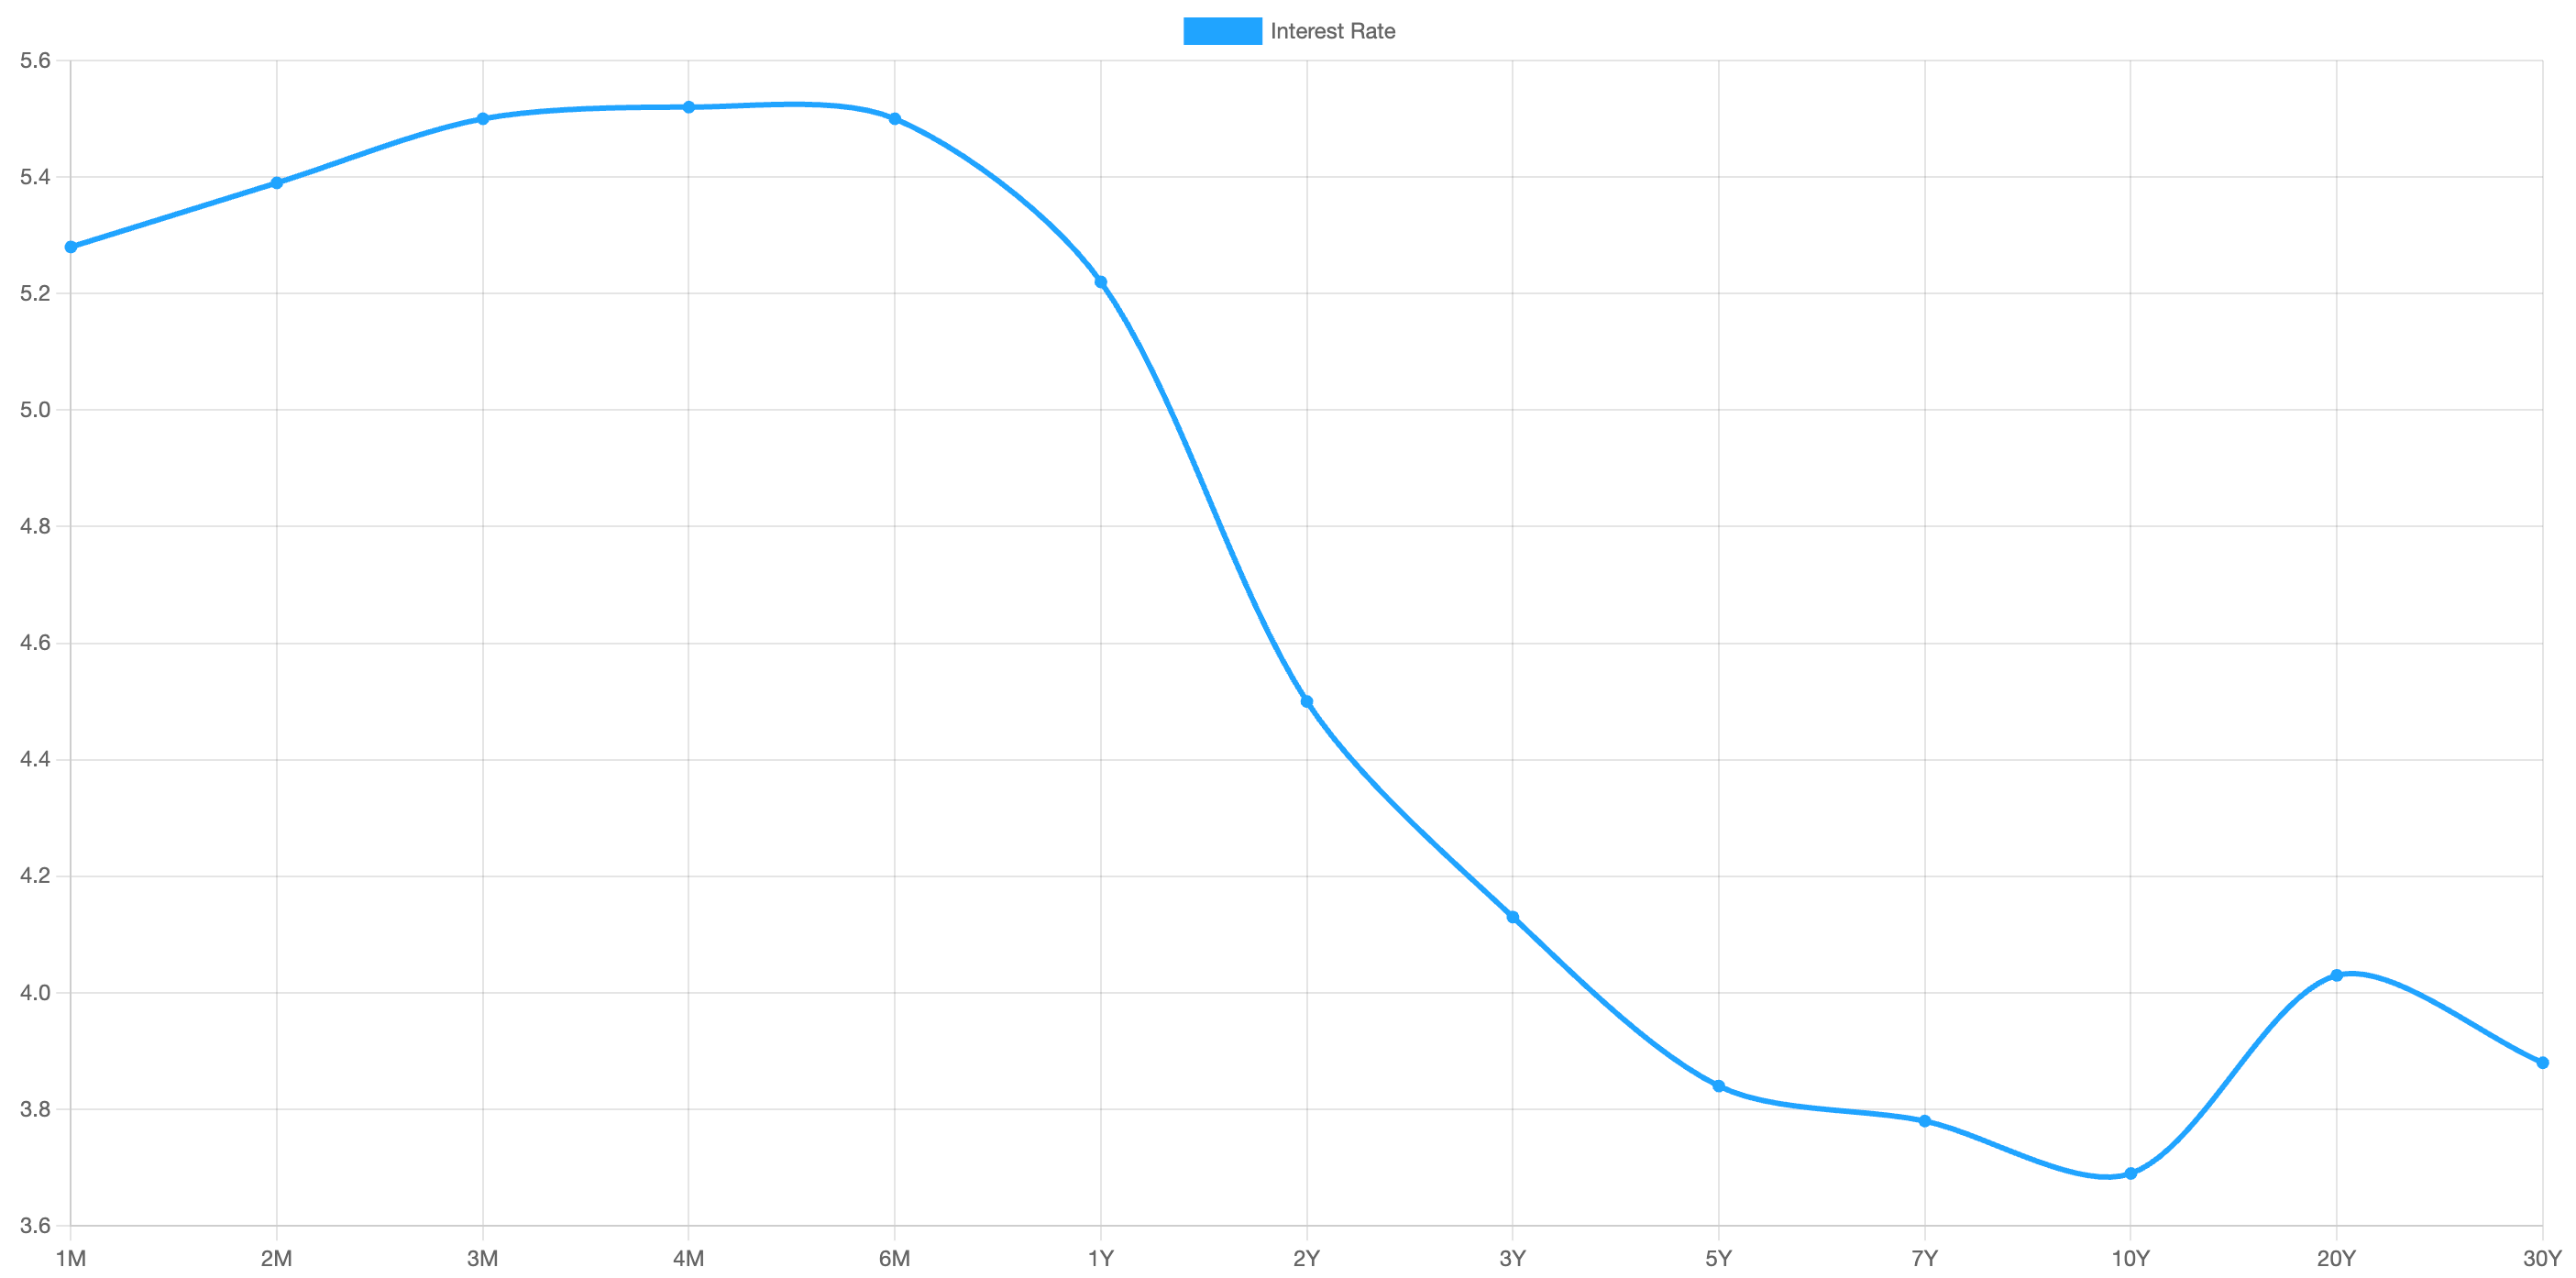
The interest rate yield curve remains “inverted” (i.e. most shorter term interest rates are higher than longer term ones) with the highest rate (5.52%) being paid currently for the 4-month duration and the lowest rate (3.69%) for the 10-year.
The closely-watched and most commonly-used comparative measure of the spread between the 2-year and the 10-year last week rose from 0.74% to 0.81%, indicating an overall steepening of the inversion of the curve during the last five days.
Historically, an inverted yield curve has been regarded as a leading indicator of an impending recession, with shorter term risk deemed to be unusually higher than longer term.
The curve has been inverted since July 2022 based on the 2 year vs. 10 year spread.
Data courtesy of ustreasuryyieldcurve.com as of Friday.
FEDWATCH INTEREST RATE PREDICTION TOOL ..
Where will interest rates (Fed Funds rate, currently 5.125%) be at the end of 2023?
↑ Higher than now .. 21% probability
(one week ago: 21%, one month ago: 0%)
↔ Unchanged from now .. 36% probability
(one week ago: 39%, one month ago: 1%)
↓ Lower than now .. 43% probability
(one week ago: 40%, one month ago: 99%)
What are the latest market expectations for what the Fed will announce re: interest rate changes (Fed Funds rate, currently 5.125%) on June 14th after its next meeting?
↑ 0.25% increase .. 28% probability
(one week ago: 71%, one month ago: 16%)
↔ No change .. 72% probability
(one week ago: 29%, one month ago: 77%)
↓ 0.25% cut .. 0% probability
(one week ago: 0%, one month ago: 7%)
Data courtesy of CME FedWatch Tool. Calculated from Federal Funds futures prices as of Friday.
LAST WEEK BY THE NUMBERS ..

Last week’s market color courtesy of finviz.com:
- Last week’s best performing US sector: Real Estate (two biggest holdings: Prologis, American Tower Corp) - up 2.9% for the week.
- Last week’s worst performing US sector: Consumer Defensive (two biggest holdings: Proctor and Gamble, Pepsico) for the second week in a row - up 0.1% for the week.
- The proprietary Lowry's measure for US Market Buying Power is currently at 149 and rose by 11 points last week and that of US Market Selling Pressure is now at 153 and fell by 6 points over the course of the week.
- SPY, the S&P 500 ETF, remains above its 50-day and 90-day moving averages and above its long term trend line with a RSI of 66**. SPY ended the week 10.5% below its all-time high (01/03/2022).
- QQQ, the NASDAQ-100 ETF, remains above its 50-day and 90-day moving averages and above its long term trend line with a technically over-bought RSI of 76**. QQQ ended the week 12.2% below its all-time high (11/19/2021).
** RSI (Relative Strength Index) above 70: technically over-bought, RSI below 30: technically over-sold
- VIX, the commonly-accepted measure of expected upcoming stock market risk and volatility (often referred to as the “fear index”), implied by S&P 500 index option trading, ended the week 3.3 points lower at 14.6. It remains below its 50-day and 90-day moving averages and below its long term trend line.
ARTICLE OF THE WEEK ..
Here’s what it can look like when Americans retire abroad.
EXPLAINER: FINANCIAL TERM OF THE WEEK ..
A weekly feature using information found on Investopedia to try to help explain Wall Street gobbledygook (may be edited at times for clarity).
Generative Artificial Intelligence (AI) is a type of artificial intelligence that can produce content such as audio, text, code, video, images, and other data. Whereas traditional AI algorithms may be used to identify patterns within a training data set and make predictions, generative AI uses machine learning algorithms to create outputs based on a training data set.
Generative AI can produce outputs in the same medium in which it is prompted (e.g., text-to-text) or in a different medium from the given prompt (e.g., text-to-image or image-to-video). Popular examples of generative AI include ChatGPT, Bard, DALL-E, Midjourney, and DeepMind.
Generative AI is a type of machine learning, which, at its core, works by training software models to make predictions based on data without the need for explicit programming.
Specifically, generative AI models are fed vast quantities of existing content to train the models to produce new content. They learn to identify underlying patterns in the data set based on a probability distribution and, when given a prompt, create similar patterns (or outputs based on these patterns).
Part of the umbrella category of machine learning called deep learning, generative AI uses a neural network that allows it to handle more complex patterns than traditional machine learning. Inspired by the human brain, neural networks do not necessarily require human supervision or intervention to distinguish differences or patterns in the training data.
Generative AI can be run on a variety of models, which use different mechanisms to train the AI and create outputs. These include generative adversarial networks (GANs), transformers, and Variational AutoEncoders (VAEs).
Widespread AI applications have already changed the way that users interact with the world; for example, voice-activated AI now comes pre-installed on many phones, speakers, and other everyday technology.
Similarly, users can interact with generative AI through different software interfaces. This has been one of the key innovations in opening up access and driving usage of generative AI to a wider audience. Whereas early versions of generative AI required technical or data science knowledge to interact with the software, AI developers are now designing user experiences in which prompts can be given and interactions can take place in plain language.
Here are some of the most popular recent examples of generative AI interfaces.
ChatGPT
Created by OpenAI, ChatGPT is an example of text-to-text generative AI: essentially, an AI-powered chatbot trained to interact with users via natural language dialogue. Users can ask ChatGPT questions, engage in back-and-forth conversation, and prompt it to compose text in different styles or genres, such as poems, essays, stories, or recipes, among others.
Released in November 2022, a free version of ChatGPT is available for use online. OpenAI also sells the application programming interface (API) for ChatGPT, among other enterprise subscription and embedding options.
DALL-E
DALL-E is an example of text-to-image generative AI that was released in January 2021 by OpenAI. It uses a neural network that was trained on images with accompanying text descriptions. Users can input descriptive text, and DALL-E will generate photorealistic imagery based on the prompt. It can also create variations on the generated image in different styles and from different perspectives.
DALL-E can also edit images, whether by making changes within an image (known in the software as Inpainting) or extending an image beyond its original proportions or boundaries (referred to as Outpainting).
Bard
Bard is a text-to-text generative AI interface based on Google’s large language model LaMDA (Language Model for Dialogue Applications). Like ChatGPT, Bard is a chatbot powered by AI technology that can answer questions or generate text based on user-given prompts. Google bills it as a “complementary experience to Google Search.”
In March 2023, Bard was released for public use in the United States and the United Kingdom, with plans to expand to more countries in more languages in the future. It made headlines in February 2023 after it shared incorrect information in a demo video, causing parent company Alphabet (GOOG, GOOGL) shares to plummet around 9% in the days following the announcement.
WWW.ANGLIAADVISORS.COM | SIMON@ANGLIAADVISORS.COM | CALL OR TEXT: (929) 677 6774 | FOLLOW ANGLIA ADVISORS ON INSTAGRAM
This material represents a highly opinionated assessment of the financial market environment based on assumptions and prevailing data at a specific point in time and is always subject to change at any time. No warranty of its accuracy or completeness is given. It is never to be interpreted as an attempt to forecast any future events, nor does it offer any kind of guarantee of any future results, circumstances or outcomes.
The material contained herein is not necessarily complete and is wholly insufficient to be exclusively relied upon as research or investment advice or as a sole basis for any kind of investment decision or action. The user assumes the entire risk of any decisions made or actions taken based on the information provided in this or any Anglia Advisors communication of any kind. Under no circumstances is any of Anglia Advisors’ content ever intended to constitute tax, legal or medical advice and should never be taken as such. Neither the information contained or any opinion expressed herein constitutes a solicitation for the purchase of any security or asset class.
Posts may contain links or references to third party websites for the convenience and interest of readers. While Anglia Advisors may have reason to believe in the quality of the content provided on these sites, the firm has no control over, and is not in any way responsible for, the accuracy of such content nor for the security or privacy protocols that external sites may or may not employ. By making use of such links, the user assumes, in its entirety, any kind of risk associated with accessing them or making use of any information provided therein.
Clients of, and those associated with, Anglia Advisors may maintain positions in securities and asset classes mentioned in this post.

If you enjoyed this post, why not share it with someone or encourage them to subscribe themselves?


