


A rather uneventful week was saved by a solid final day, although arguably the biggest event came after the close on Friday when a U.S. credit rating outlook downgrade was announced.
Stocks and bonds spent Monday aimlessly meandering around, looking for fresh direction following the previous week’s fiesta. Both Blackrock and Morgan Stanley were quick to come out with warnings that the end of October/early November super-rally could well swiftly reverse.
Tuesday was not much different. After another day of mostly directionless trading, the S&P 500 closed a little higher as Treasury yields and oil prices continued to trundle lower. The shift lower in the price of oil, which is flirting with multi-month lows, has caught a lot of people by surprise.
Given the turmoil in the Middle East and risk of the conflict turning into more of a regional crisis, the conventional wisdom had been that oil prices were going to move sharply higher and remain elevated. The exact opposite has happened, implying that geopolitical concerns are taking a back seat to growing fears of declining global demand for oil.
On Wednesday morning, Fed Chair Jerome Powell said precisely nada in a “nothing-burger” of a short speech. After initially resuming their trajectory of drifting gently higher, stocks eventually ran out of steam later in the day but with a late grind higher, the S&P 500 still managed to squeak out a minuscule gain, extending the index’s winning streak to eight trading days.
All good things must come to an end, however and the streak was broken on Thursday after Powell finally said something of substance in a climate protester-interrupted speech at the International Monetary Fund (IMF) HQ in Washington DC. “If it becomes appropriate to tighten policy further, we will not hesitate to do so,” is hardly a new revelation, but still served as a reminder to markets that the Fed has not yet formally issued an all-clear when it comes to raising interest rates. Market interest rates spiked and stocks bled lower all day in response.
On Friday after the market close, the United States’ credit rating outlook was downgraded from “stable” to “negative” by Moody’s Investors’ Services, following Fitch Ratings recent lead. The U.S. now has the same credit rating outlook at Moody’s as, for example, Argentina, El Salvador, Ukraine and Papua New Guinea. The credit ratings agency’s decision resulted from a recognition of the fact that, by the time you read my next weekly report, this country may not have a fully-functioning government thanks to the apparent willingness of Team Burn It All Down in Congress to throw the entire nation under the bus for their own political ends.
This followed what had been a remarkably solid day for markets as stocks rebounded hard, including a new all-time high for Microsoft (MSFT) as attention returned to October’s oversold conditions and a mostly very solid earnings season - and the recent sharp pullback in market interest rates resumed after Thursday’s hiccup.
This is a market searching for “what’s next?” and Moody’s may have just provided an uncomfortable answer to that. Otherwise it is likely to be either a) a growth scare that sends stocks lower, maybe even towards the October 2022 lows, or b) a resumption of the soft landing and disinflation narrative that pushed stocks higher this summer. For the rest of the year at least, markets will probably be playing a game of narrative roulette as the chatter changes week by week, sometimes even day by day.
This will only intensify as mid-November marks the beginning of the silly season when pundits’ and so-called experts’ 2024 predictions (otherwise known as complete guesswork with an appallingly poor track record of accuracy) start coming out, indeed some such nonsense has started polluting my inbox already.
We have seen this effect in microcosm over the last couple of weeks when we swiftly went from being deeply oversold to getting close to being overbought. Narratives would have told you everything is looking dismal two or three weeks ago. Be afraid, be very afraid. By last weekend, the narratives were all saying everything was fabulous. Blue skies all around.
The fact is that neither narrative set was appropriate or primarily governed by the prevailing facts or data. The pendulum is swinging too far, too fast. For the market to sustainably rally from here, it still needs what it hasn’t yet received: calm in the Treasury market. Neither the short, violent declines nor the sharp rises that we have seen recently are helpful to a stock market bullish turnaround.
Looking beyond the distracting noise and confusion of the narrative roulette game, we need to remain focused on the “Three Pillars” upon which the 2023 rally has been built (1. No Landing / Soft Landing, 2. Disinflation, 3. Fed Done/Almost Done with Rate Hikes). The current situation reflects some mild deterioration in the overall fundamentals, but the Three Pillars remain largely in place.
Things get better if:
data further confirms a no landing or soft landing,
core inflation data (ex- food and energy) continues to drop at a solid pace and nears 3% year-on-year,
the Fed further confirms no more hikes and softens its “higher for longer” language (and Treasury yields drift lower).
Things get worse if:
Economic data rolls over and points to a hard landing,
core inflation levels off or even bounces back higher,
the Fed puts a near-term rate hike back on the table and the 10-year Treasury yield moves back to 5%.
OTHER NEWS ..
More Retirees Than We Thought .. Over three-and-a-half years after COVID struck, the U.S. still has around 2 million more retirees than predicted according to Bloomberg, in one of the most striking and enduring changes to the nation’s labor force.
The so-called Great Retirement induced by the pandemic is made clear in the divergence between the actual number of retirees and that predicted by a Federal Reserve’s economic model. While down from a 2.8 million gap late last year, the divergence remains elevated today and currently sits at over 1.9m “excess retirees”.
For many older Americans, leaving the labor market is a one-way street and rejoining the workforce can be difficult, if not impossible. A decline in skills and work connections as well as widespread and rampant ageism in the workplace all make it harder for many older workers to get back in the workforce. In 2022, the mean duration to find a job for people age 65 and older was over 31 weeks, 9 weeks longer than the historical average.
The $100 Billion Market To Make Everyone Thinner Just Got More Crowded .. As reported on Bloomberg last week, Eli Lilly won U.S. approval to use the active ingredient in its diabetes drug, Zepbound, as a treatment for obesity and will make it available soon after Thanksgiving. It will cost $1,059.87 for a month’s supply. That’s cheaper than Wegovy, a similar drug made by Novo Nordisk, which is $1,349 for a month’s supply, but more expensive than Novo’s Ozempic which comes in at a “mere” $936.
The mania over weight-loss drugs is drawing responses from all kinds of industries, including airlines (who are very excited about the potential fuel cost savings brought about by flying slimmer passengers), dialysis centers (who see positive kidney-related effects of drugs like Ozempic) and big box chains like Walmart (who are fretting about their grocery sales in a world where people don’t get as hungry as they used to).
Eli Lilly was prevented from marketing its diabetes drug, Mounjaro, for obesity prior to Wednesday’s approval. The promise of these drugs has boosted the stocks of Lilly and Novo, indeed Lilly is now the most valuable health-care company in the world.
UNDER THE HOOD ..
The price rally over the previous week was impressive; trading volume was up and Small Cap stocks very briefly surged, two factors notably absent over the last few weeks. But the response was limited in core technical indicators, which merely bounced somewhat within the confines of still-intact down-trends and failed to follow through powerfully last week as technical defensive characteristics quickly re-emerged.
There is still a lack of hard evidence yet that investors want to sustainably flock back to smaller, riskier stocks which they kind of need to do in order to confirm a new bull run. Indeed, on Thursday of last week both the Mid Cap index and the Small Cap Index reached new multi-year lows in relative terms vs. the S&P 500 Large Cap Index. Large company outperformance is greater than it’s been in years.
Instead of buyers being inspired to scoop up heavily-discounted Small and Mid Cap stocks, they have returned to their comfort blanket of the most well-known and highly-capitalized stocks on the planet.
Anglia Advisors clients are welcome to reach out to me to discuss market conditions further.
THIS WEEK’S UPCOMING CALENDAR ..
Wrangling in Congress will likely be in the headlines all week with a Friday deadline to avoid a federal government shutdown.
There are still a few more Q3 earnings to report such as Walmart, Target, Cisco, Home Depot, Alibaba, TJX and Tyson Foods.
The main event on the economics calendar will be Tuesday's release of the October Consumer Price Index (CPI) measure of retail inflation. Estimates call for a 3.3% increase in the headline rate from a year ago. The Producer Price Index (PPI) measure of wholesale inflation experienced by manufacturers will be released the next day.
The latest Retail Sales numbers will be released on Wednesday.
ARTICLE OF THE WEEK ..
LAST WEEK BY THE NUMBERS ..
Last week’s market color courtesy of finviz.com

Last week’s best performing US sector: Technology (two biggest holdings: Apple, Microsoft) - up 3.8% for the week.
Last week’s worst performing US sector: Energy (two biggest holdings: Exxon Mobil, Chevron) - down 2.7% for the week.
The proprietary Lowry's measure for US stock market Buying Power fell by 13 points last week to 120 and that of US stock market Selling Pressure rose by 12 points to 158 over the course of the week.
SPY, the S&P 500 Large Cap ETF, is made up of the stocks of the 500 largest US companies. It is now above its 50-day and 90-day moving averages and is also above its long term trend line, with a RSI of 62***. SPY ended the week up 15.2% year-to-date and 7.8% below its all-time high (01/03/2022).
IWM, the Russell 2000 Small Cap ETF, is made up of the bottom two-thirds in terms of company size of the group of the 3,000 largest US stocks. It is below its 50-day and 90-day moving averages and is also below its long term trend line, with a RSI of 48***. IWM ended the week down 3.0% year-to-date and 30.3% below its all-time high (11/05/2021).
*** RSI (Relative Strength Index) above 70: technically overbought, RSI below 30: technically oversold
The VIX, the commonly-accepted measure of expected upcoming stock market risk and volatility (often referred to as the “fear index”) implied by S&P 500 index option trading, ended the week 0.7 points (5%) lower at 14.2. It is below its 50-day and 90-day moving averages and is also below its long term trend line.
AVERAGE 30-YEAR FIXED RATE MORTGAGE ..
7.50%
One week ago: 7.76%, one month ago: 7.57%, one year ago: 7.08%
Data courtesy of: FRED Economic Data, St. Louis Fed as of Thursday of last week.
FEAR & GREED INDEX ..
“Be fearful when others are greedy and be greedy when others are fearful.” Warren Buffet.

The Fear & Greed Index from CNN Business can be used as an attempt to gauge whether or not stocks are fairly priced and to determine the mood of the market. It is a compilation of seven different indicators that measure some aspect of stock market behavior. They are: market momentum, stock price strength, stock price breadth, put and call options, junk bond demand, market volatility and safe haven demand.
Extreme Fear readings can lead to potential opportunities as investors may have driven prices “too low” from a possibly excessive risk-off negative sentiment.
Extreme Greed readings can be associated with a sense of “FOMO” and investors chasing rallies in an excessively risk-on environment, possibly leaving the market vulnerable to a sharp downward correction at some point.
Data courtesy of CNN Business.
PERCENT OF S&P 500 STOCKS TRADING ABOVE THEIR LONG TERM MOVING AVERAGE (LTMA) ..
40% (of the largest 500 stocks in the U.S., 199 ended last week above their LTMA and 301 were below)
One week ago: 41%, one month ago: 43%, one year ago: 50%
A closely-watched measure of market breadth and participation, providing a real-time look at how many of the largest 500 publicly-traded stocks in the U.S. are trending higher or lower, as defined by whether the stock price is above or below the 200-day moving average which is among the most widely-followed of all stock market technical indicators.
The higher the reading, the better the deemed health of the overall market.
US INVESTOR SENTIMENT (outlook for the upcoming 6 months) ..
↑Bullish: 43% (24% a week ago)
⬌ Neutral: 30% (26% a week ago)
↓Bearish: 27% (50% a week ago)
Net Bull-Bear spread: ↑Bullish by 16 (Bearish by 26 a week ago)
For context: Long term averages: Bullish: 38% — Neutral: 32% — Bearish: 30% — Net Bull-Bear spread: Bullish by 8
Weekly sentiment survey participants are typically polled on Tuesdays and/or Wednesdays.
Data courtesy of: American Association of Individual Investors (AAII).
FEDWATCH INTEREST RATE PREDICTION TOOL ..
Where will interest rates be at the end of 2023?
⬌ Unchanged from now .. 86% probability
One week ago: 95%, one month ago: 73%
↑ Higher than now .. 14% probability
One week ago: 5%, one month ago: 27%
Data courtesy of CME FedWatch Tool. Based on the Fed Funds rate (currently 5.375%). Calculated from Federal Funds futures prices as of Friday.
US TREASURY INTEREST RATE YIELD CURVE ..
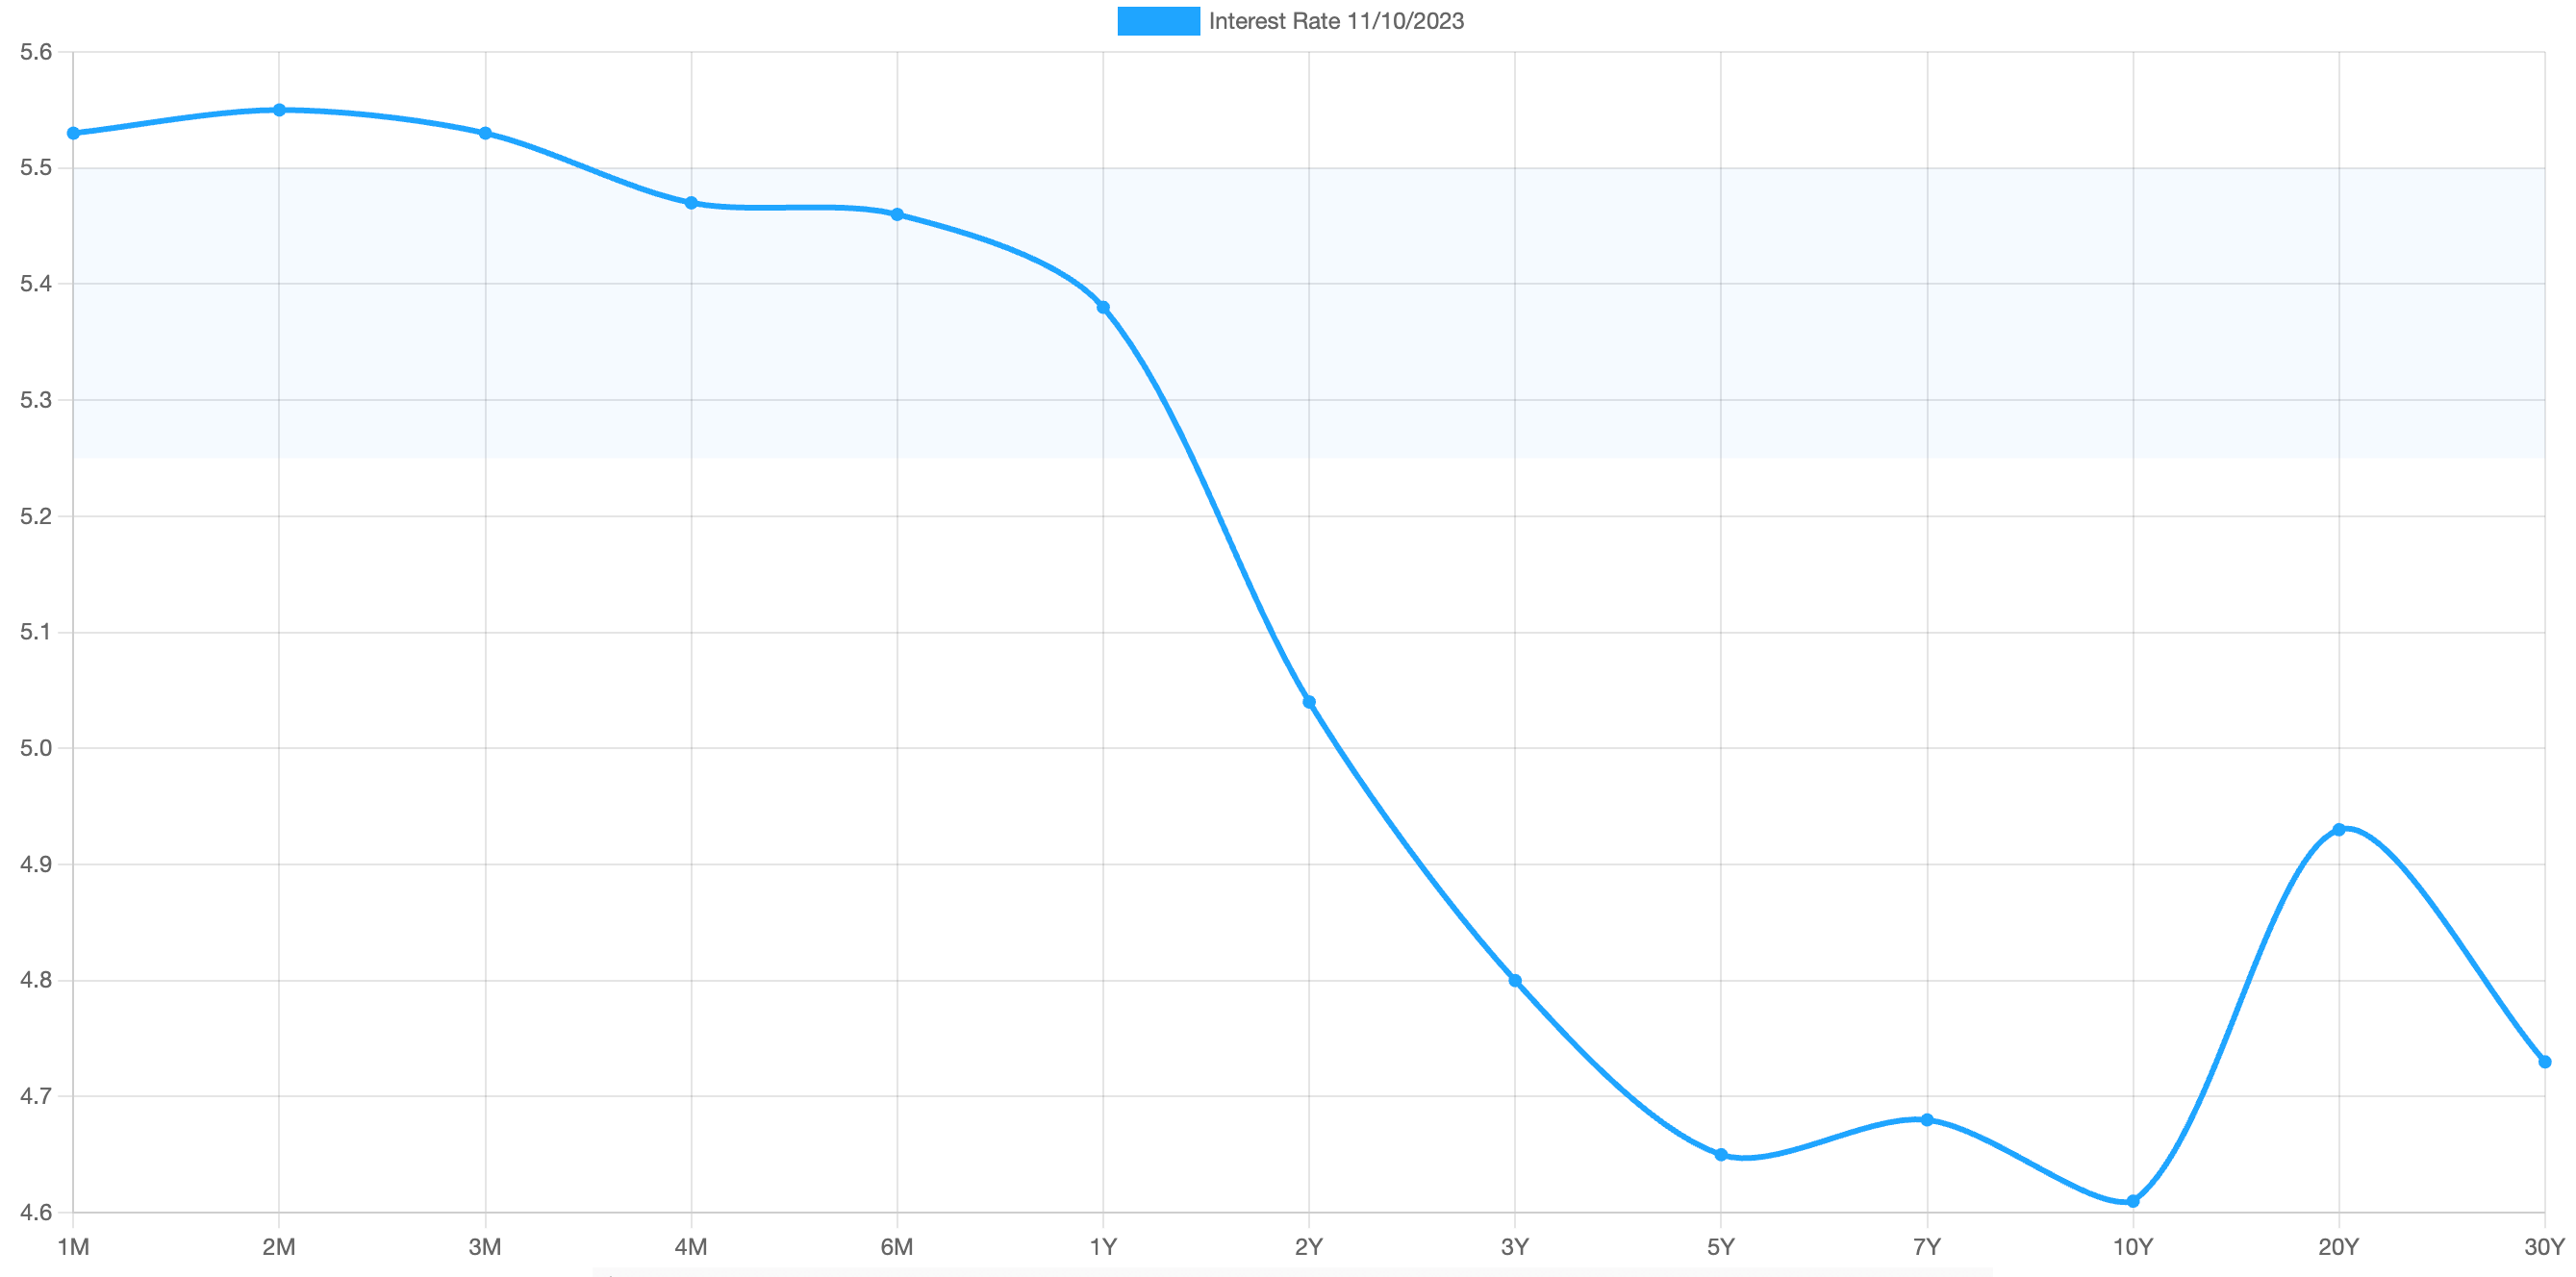
The interest rate yield curve remains “inverted” (i.e. shorter term interest rates are generally higher than longer term ones) with the highest rate (5.55%) being paid currently for the 2-month duration and the lowest rate (4.61%) for the 10-year.
The closely-watched and most commonly-used comparative measure of the spread between the 2-year and the 10-year rose sharply from 0.26% to 0.42%, indicating a meaningful steepening in the inversion of the curve during the last week.
Historically, an inverted yield curve has been regarded as a leading indicator of an impending recession, with shorter term risk deemed to be unusually higher than longer term. The steeper the inversion, the greater the deemed risk of recession.
The curve has been inverted since July 2022 based on the 2-year vs. 10-year spread.
Data courtesy of ustreasuryyieldcurve.com as of Friday. Light shaded area shows the current Federal Funds rate range.
WWW.ANGLIAADVISORS.COM | SIMON@ANGLIAADVISORS.COM | CALL OR TEXT: (929) 677 6774 | FOLLOW ANGLIA ADVISORS ON INSTAGRAM
This material represents a highly opinionated assessment of the financial market environment based on assumptions and prevailing data at a specific point in time and is always subject to change at any time. No warranty of its accuracy or completeness is given. It is never to be interpreted as an attempt to forecast any future events, nor does it offer any kind of guarantee of any future results, circumstances or outcomes.
The material contained herein is not necessarily complete and is wholly insufficient to be exclusively relied upon as research or investment advice or as a sole basis for any investment or other financial decisions. The user assumes the entire risk of any decisions made or actions taken based in whole or in part on any of the information provided in this or any Anglia Advisors communication of any kind. Under no circumstances is any of Anglia Advisors’ content ever intended to constitute tax, legal or medical advice and should never be taken as such. Neither the information contained or any opinion expressed herein constitutes a solicitation for the purchase of any security or asset class.
Posts may contain links or references to third party websites or may post data or graphics from them for the convenience and interest of readers. While Anglia Advisors may have reason to believe in the quality of the content provided on these sites, the firm has no control over, and is not in any way responsible for, the accuracy of such content nor for the security or privacy protocols that external sites may or may not employ. By making use of such links, the user assumes, in its entirety, any kind of risk associated with accessing them or making use of any information provided therein.
Those associated with Anglia Advisors, including clients with managed or advised investments, may maintain positions in securities and/or asset classes mentioned in this post.

If you enjoyed this post, why not share it with someone or encourage them to subscribe themselves?


