


Last week’s narrative was dominated by Nvidia’s earnings, which ended up being a splendid story. Markets in general, however, were flattish for the week, as investors seemed to lurch from one side of the canoe to the other, suddenly concerned again that interest rate cuts could be further away and less frequent than previously thought.
The most popular futures market-driven scenario now sees no interest rate cut until December, so only one reduction this year. For context, at the beginning of last week, expectations were around 80% for a first cut in September and two reductions for the year.
The week started with the geopolitical temperature elevated by the death of Iranian president Raisi and the application for an arrest warrant for war crimes for Netanyahu among others which pushed up the prices of oil and so-called “safe havens” like gold early on Monday, but the stock market continued to head steadily upward with more new record highs, especially for any index that included “the most important stock on planet Earth” , Nvidia (NVDA) as investors piled into the AI giant’s stock in anticipation of the earnings report later in the week. Another big index component, Microsoft (MSFT), impressed Wall Street with the announcement of some new AI-powered additions to its PC product line.
Stocks drifted slightly higher again on a rather dreary Tuesday which saw more all-time record highs for the S&P 500 and the NASDAQ, driven mainly by the fact that .. well, there was no real reason not to. Investors still couldn’t get enough of NVDA which touched its own new all-time high ahead of the release of its eagerly-awaited earnings report after the close the next day.
While breathlessly waiting for that report during the session on Wednesday, traders tried to keep themselves occupied by poring over a very disappointing pre-market earnings report from Target (TGT) and the minutes from the most recent Fed interest rate-setting meeting that seemed to show most committee members coalescing around the idea of higher-for-longer interest rates with very little sign of any dissent. Stock prices floated lower in response.
When we finally got to see Nvidia’s results on Wednesday evening, we received an emphatic answer to the question as to whether spending on AI computing remains strong. Q2 revenue was $27 billion, up 262% from a year earlier. Earnings were a staggering 461% higher than a year prior. Gross margins were massive at 79%. Sales forecasts and outlook were sensationally bullish. This all trashed even the highly-elevated market forecasts.
Oh, and the firm announced a 10-for-1 stock split. As one analyst put it, "It's Nvidia's world. Everyone else is just paying rent.”
NVDA surged more than 10% at the open on Thursday, but was very much the outlier for the session as the rest of the market revisited some fairly bleak retail earnings reports/outlooks and the somewhat rate-cut-unfriendly tone of the Fed minutes from the day before, emphasized by further statements during the day from Fed officials, once again sticking to the party line that it would not be wise for them to cut rates until they had a solid degree of confidence that inflation appeared to be under control. The implication being that, at this exact moment in time, they lack that confidence.
The indexes all moved sharply lower on Thursday as prices seemed to fall into an “air-pocket” created by the rapid resumption of price-chasing by investors since the beginning of May, with the S&P 500 falling back below 5300.
Most of Thursday’s damage was, however, repaired on what turned out to be an ultra-low volume but pretty cheery Friday ahead of a long weekend, mostly driven by gains in Big Tech (including, you guessed it, NVDA yet again).
It’s not that any events on Wednesday and Thursday were definitively market-negative. They weren’t. It’s just that investors once again got too giddy in their expectations and some of last week’s non-Nvidia-related developments simply served to partially correct that too-rosy view (see my “canoe” analogy in the opening paragraph).
Like it or not, the Fed is very much in a higher-for-longer interest rate mode. “Longer” likely means a few months but that’ll depend on the economic data. If data is too strong, “longer” may well mean until December of this year, or maybe even beyond then. What “longer” definitely does not mean is, for example, a July cut instead of a June one.
The only way the Fed cuts interest rates before September is if growth utterly collapses and if that happens, stocks will be on such a serious downward march already that something as trivial as a rate cut or two won’t be enough to rescue the situation.
We should not be surprised if the market’s recent wobbles continue for a while longer as investors start to talk themselves into yet another new interest rate paradigm. But, that’s likely a temporary condition and nothing last week materially and negatively altered the largely favorable intermediate term outlook for stocks.
OTHER NEWS ..
????? .. Half of Americans think that the U.S. stock market has fallen this year, according to a major poll published by Guardian/Harris last week and there are a number of other quite alarming economic and financial knowledge gaps among the group of people who are about to decide who becomes the most powerful individual on the planet.
According to the poll results;
49% of Americans falsely believe the S&P 500 index is down for the year. In reality, it’s up over 11% so far in 2024, after rising about 24% in 2023.
72% of Americans falsely believe that the rate of inflation in the U.S. is increasing. In fact, as measured by the Consumer Price Index (CPI), it is now two years deep into a process of falling sharply from a peak of 9.1% in June 2022 and has been fluctuating between 3% and 4% for the last year, moving lower to a reading of 3.4% earlier this month.
49% of Americans falsely believe that the rate of unemployment, which has been below 4% for the last two-and-a-half years according to the Bureau of Labor Statistics, is at a 50-year high, in spite of the fact that it’s actually at a 50-year low.
56% of Americans falsely believe that the U.S. is currently experiencing a recession, even though the broadest measure of the economy, quarterly Gross Domestic Product (GDP), has grown for eleven of the last thirteen quarters since the dark days of early COVID back in 2020 and grown solidly every single quarter uninterrupted for the last two years.
These high levels of apparent ignorance of what is actually happening are perhaps at least partly explained by the rather disturbing finding from the same poll that over 60% of Americans distrust what they are told in official government economic data releases.
Where On Earth? .. Oxford Economics last week released its inaugural Global Cities Index, which it claims is the most comprehensive evaluation of the world’s largest urban areas. The index was compiled using five broad categories - economics, human capital, quality of life, environment and governance - with higher weightings placed on economic factors such as GDP and employment growth.
.. and the winners of the best places to live in 2024 are (in order of the overall scores):
New York
London
San Jose
Tokyo
Paris
Seattle
Los Angeles
San Francisco
Melbourne
Zurich
ARTICLE OF THE WEEK ..
Biden or Trump? Based on history, the stock market won’t care.
THIS WEEK’S UPCOMING CALENDAR ..
Stock and bond markets will be closed on Monday for Memorial Day. One day settlement for U.S. securities transactions goes into effect on Tuesday when markets reopen. Expect a few teething problems.
Just a few laggards left to report this week for Q2 2024 such as Costco, Dell, Best Buy, Gap, HP Inc., Dollar General, Agilent and Ulta Beauty.
The economic-data highlight of the week will be Friday's Personal Consumption Expenditures (PCE) Price Index for April that the Fed relies on to measure inflation. The consensus estimate is for a year-on-year inflation rate of 2.7%, unchanged from the previous month.
Before that, we’ll get to see the second updated estimate (of three) for Q1 Gross Domestic Product (GDP) on Thursday.
LAST WEEK BY THE NUMBERS ..
Last week’s market color courtesy of finviz.com
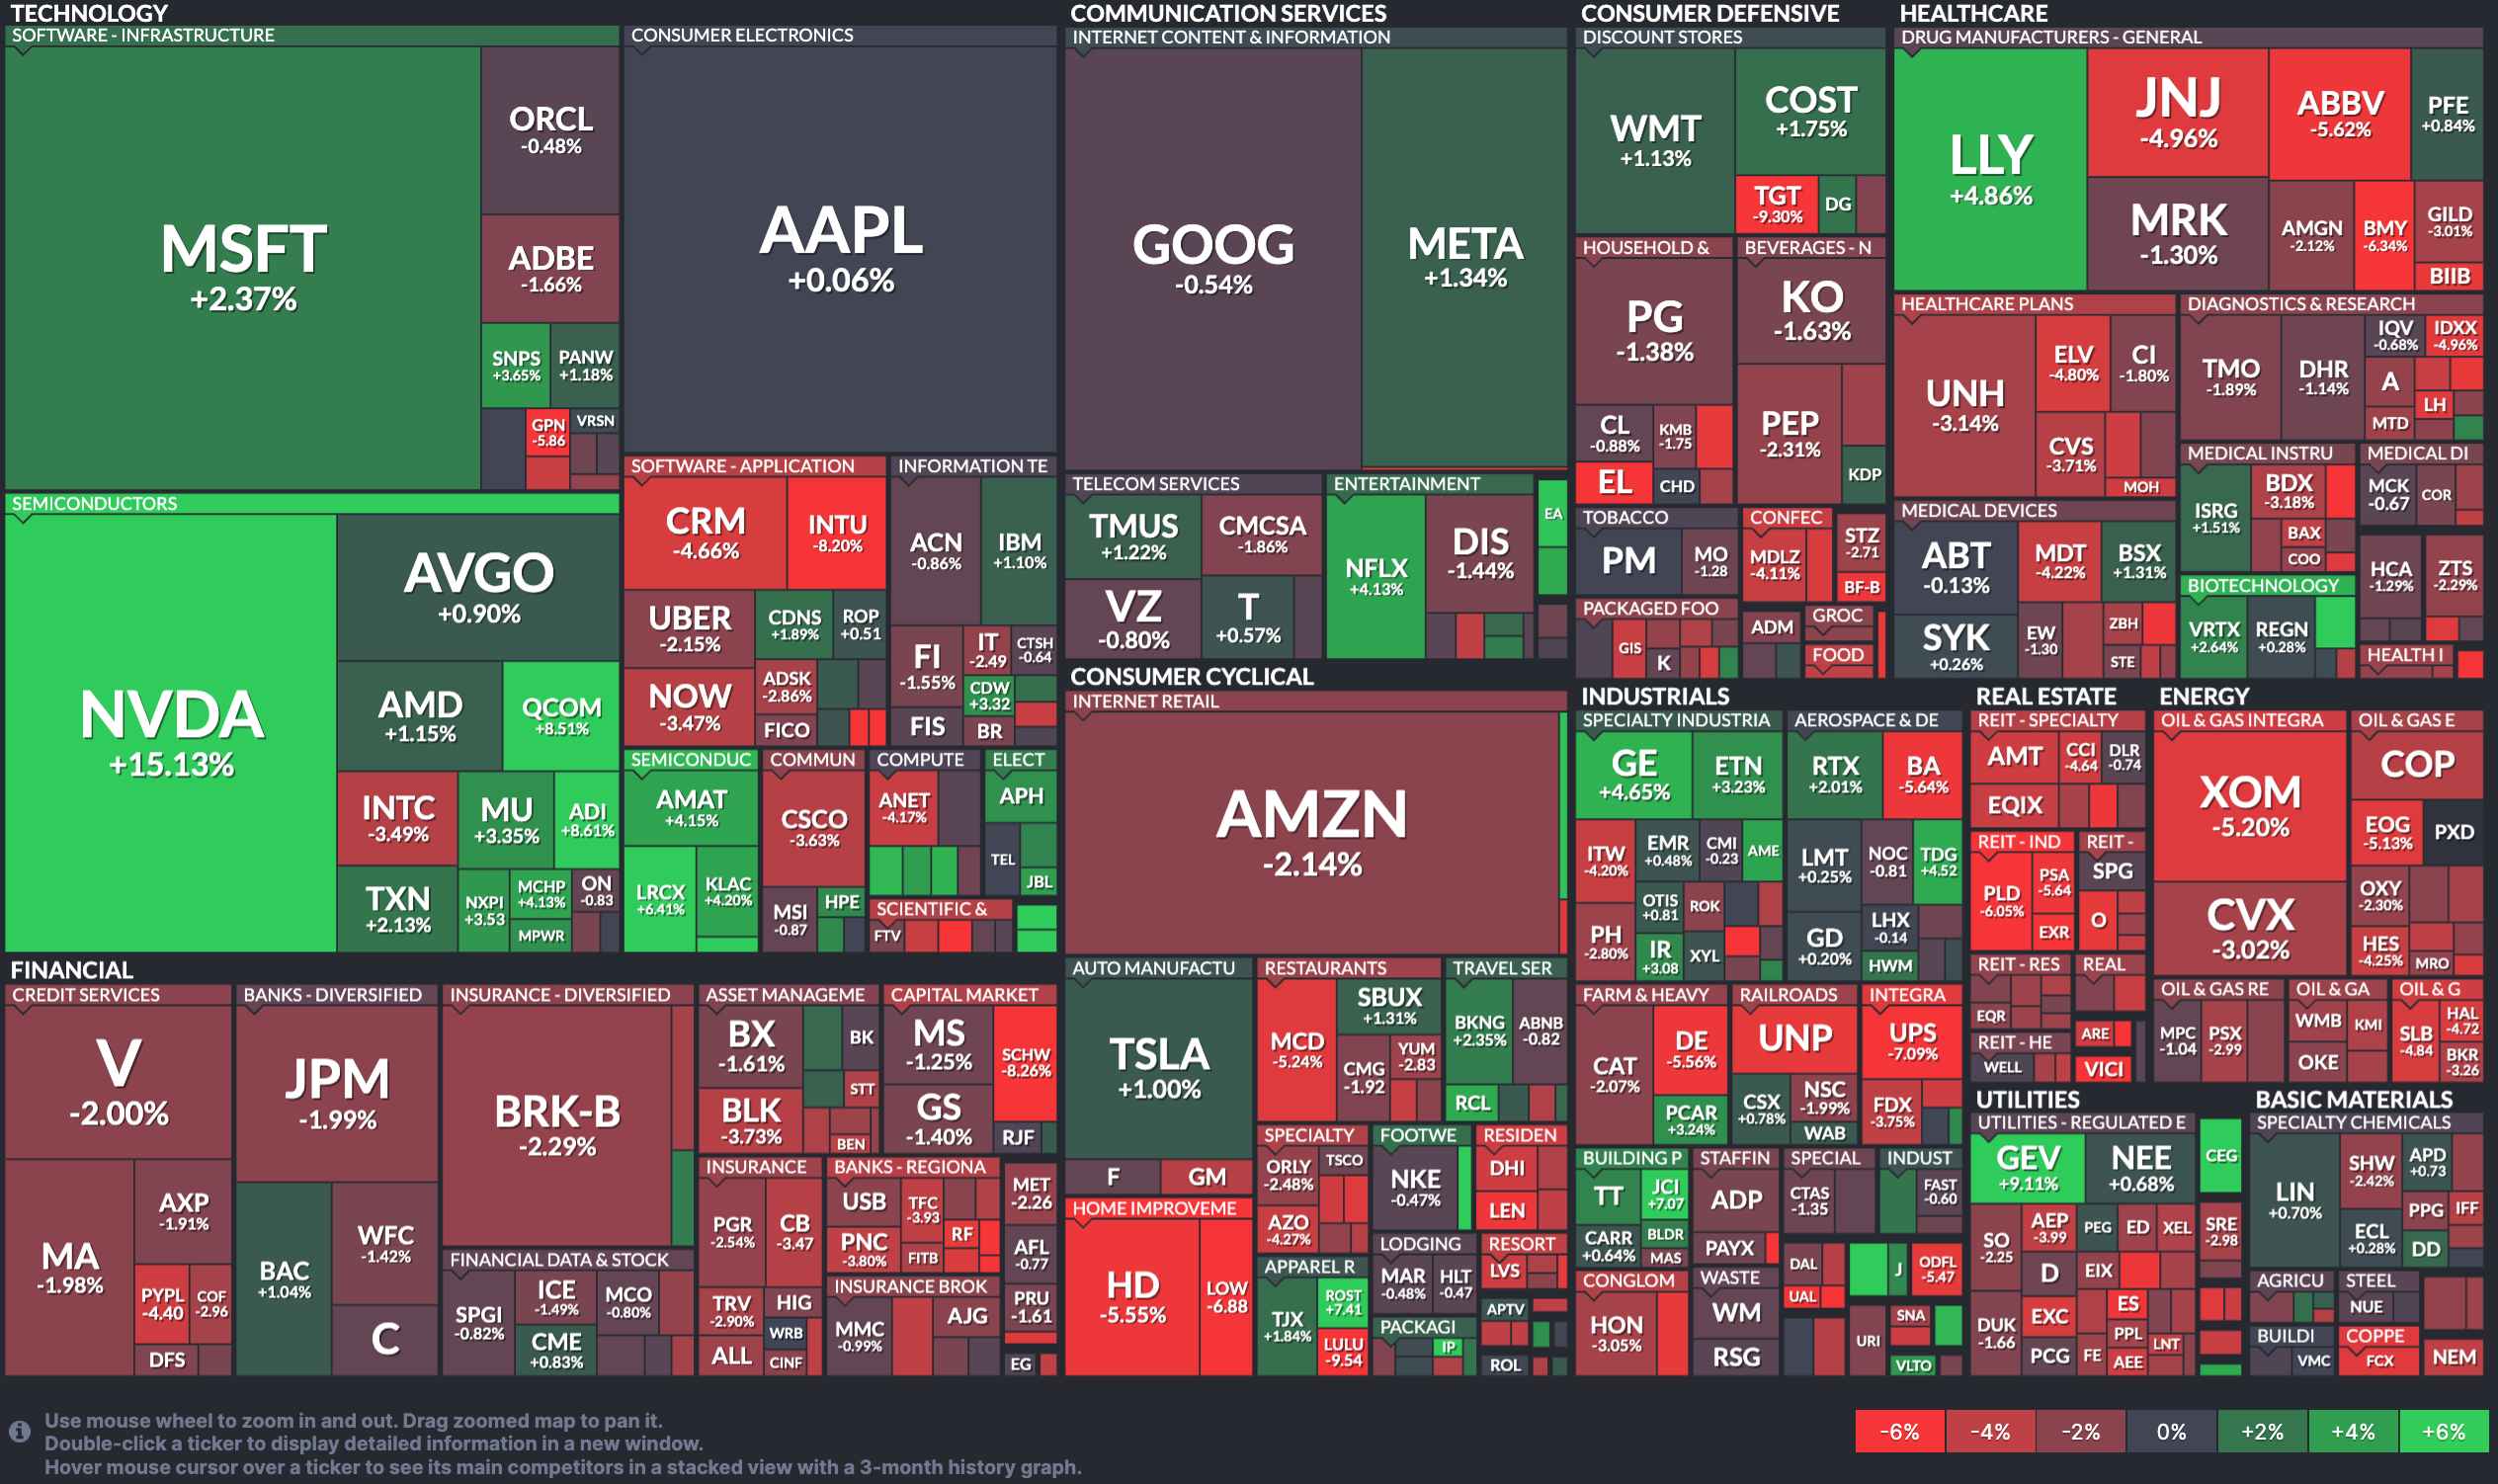
Last week’s best performing U.S. sector: Technology (two biggest holdings: Microsoft, Apple) for the third week in a row - up 1.7% for the week.
Last week’s worst performing U.S. sector: Energy (two biggest holdings: Exxon-Mobil, Chevron) - down 3.7% for the week.
SPY, the S&P 500 Large Cap ETF, tracks the S&P 500 index, made up of 500 stocks from among the largest U.S. companies. Its price was unchanged last week, is up 11.4% so far this year and ended the week 0.4% below its all-time record high (05/21/2024).
IWM, the Russell 2000 Small Cap ETF, tracks the Russell 2000 index, made up of the bottom two-thirds in terms of company size of a group made up from among 3,000 largest U.S. stocks. Its price fell 1.3% last week, is up 2.4% so far this year and ended the week 15.3% below its all-time record high (11/08/2021).
DXY, the U.S. Dollar index, is an index that measures the value of the U.S. Dollar against a weighted basket of six other major currencies (the Euro, the Japanese Yen, the British Pound, the Canadian Dollar, the Swedish Krone and the Swiss Franc). It was up 0.2% last week, is up 3.3% so far this year and is up 16.6% over the last three years.
AVERAGE 30-YEAR FIXED MORTGAGE RATE ..
6.94%
One week ago: 7.02%, one month ago: 7.17%, one year ago: 6.57%
Data courtesy of: FRED Economic Data, St. Louis Fed as of last Thursday.
FEAR & GREED INDEX ..
“Be fearful when others are greedy and be greedy when others are fearful.” Warren Buffet.
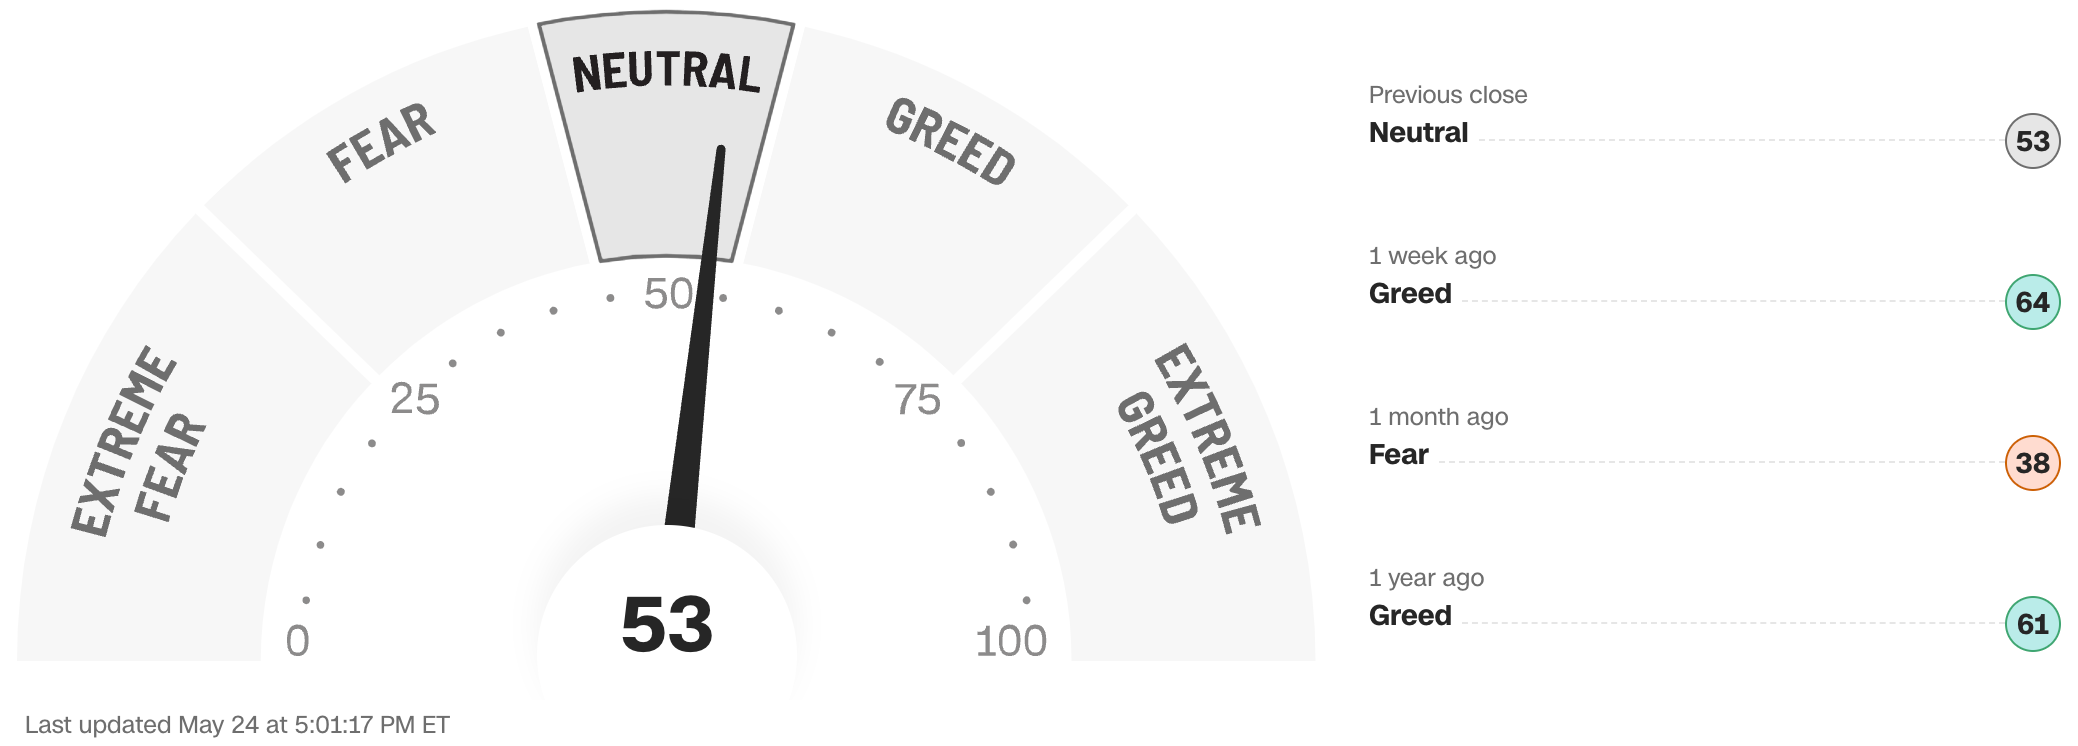
The Fear & Greed Index from CNN Business can be used as an attempt to gauge whether or not stocks are fairly priced and to determine the mood of the market. It is a compilation of seven of the most important indicators that measure different aspects of stock market behavior. They are: market momentum, stock price strength, stock price breadth, put and call option ratio, junk bond demand, market volatility and safe haven demand.
Extreme Fear readings can lead to potential opportunities as investors may have driven prices “too low” from a possibly excessive risk-off negative sentiment.
Extreme Greed readings can be associated with possibly too-frothy prices and a sense of “FOMO” with investors chasing rallies in an excessively risk-on environment . This overcrowded positioning leaves the market potentially vulnerable to a sharp downward reversal at some point.
A “sweet spot” is considered to be in the lower-to-mid “Greed” zone.
Data courtesy of CNN Business as of Friday’s market close.
FEDWATCH INTEREST RATE TOOL ..
Will interest rates be lower than they are now after the Fed’s next meeting on June 12th?
Yes .. 1% probability (9% a week ago)
No .. 99% probability (91% a week ago)
Will interest rates be lower than they are now after the Fed’s following meeting on July 31st?
Yes .. 10% probability (30% a week ago)
No .. 90% probability (70% a week ago)
Where is the Fed Funds interest rate most likely to be at the end of 2024?
5.125% (0.25% lower than where we are now, implying one rate cut before the end of 2024)
One week ago: 4.875% (implying two rate cuts), one month ago: 4.875% (implying two rate cuts)
All data based on the Fed Funds rate (currently 5.375%). Calculated from Federal Funds futures prices as of the market close on Friday. Data courtesy of CME FedWatch Tool.
The 50-day moving average of the S&P 500 remains above the 200-day. This is a continued indication of an ongoing technical uptrend.
% OF S&P 500 STOCKS TRADING ABOVE THEIR 50-DAY MOVING AVERAGE ..
50% (249 of the S&P 500 stocks ended last week above their 50D MA and 251 were below)
One week ago: 64%, one month ago: 45%, one year ago: 31%
% OF S&P 500 STOCKS TRADING ABOVE THEIR 200-DAY MOVING AVERAGE ..
71% (357 of the S&P 500 stocks ended last week above their 200D MA and 143 were below)
One week ago: 79%, one month ago: 73%, one year ago: 40%
Closely-watched measures of market breadth and participation, providing a real-time look at how many of the S&P 500 index stocks are trending higher or lower, as defined by whether the stock price is above or below their more sensitive 50-day (short term) and less sensitive 200-day (long term) moving averages which are among the most widely-followed of all stock market technical indicators.
The higher the reading, the better the deemed health of the overall market trend, with 50% considered to be a key pivot point. Readings above 90% or below 15% are extremely rare.
WEEKLY US INVESTOR SENTIMENT (outlook for the upcoming 6 months) ..
↑Bullish: 47% (41% a week ago)
⬌ Neutral: 27% (36% a week ago)
↓Bearish: 26% (23% a week ago)
Net Bull-Bear spread: ↑Bullish by 21 (Bullish by 18 a week ago)
For context: Long term averages: Bullish: 38% — Neutral: 32% — Bearish: 30% — Net Bull-Bear spread: Bullish by 8
Survey participants are typically polled during the first half of the week.
Data courtesy of: American Association of Individual Investors (AAII).
HIGH YIELD CREDIT SPREAD ..
3.10%
One week ago: 3.08%, one month ago: 3.19%, one year ago: 4.68%
This closely-watched spread is a strong indicator of the risk inherent in the professional marketplace and the extent to which such risk is growing or easing. The high-yield credit spread is the difference between the interest rates offered for riskier low-grade, high yield (“junk”) bonds and those for stable high-grade, lower yield bonds, including deemed risk-free government bonds, of similar maturity.
A reading that is high/increasing indicates that “junkier” bond issuers are being forced to move their yields higher to compensate for a greater risk of default and is considered to be a reflection of broadly deteriorating economic and market conditions which could well lead to lower stock prices.
A reading that is low/decreasing indicates a reduced necessity for higher yields. This reflects less prevailing market risk and more stable or improving conditions in the overall economy and for stock prices.
For context .. this reading was regularly below 3.00% for much of the 1990s, got as high as 10.59% after 9/11 and the subsequent Dotcom Crash of 2002, peaked at 21.82% in the Great Financial Crisis in December 2008 and spiked from 3.62% to 10.87% in the space of about a month during the February/March 2020 COVID crash. The historical average since 1996 is a little over 4.00%.
Data courtesy of: FRED Economic Data, St. Louis Fed as of Friday’s market close.
US TREASURY INTEREST RATE YIELD CURVE ..

The highest rate on the yield curve (5.56%) is being paid for the 1-month duration and the lowest rate (4.46%) is for the 10-year.
The most closely-watched and commonly-used comparative measure of the spread between the higher 2-year and the lower 10-year rose from 0.41% to 0.47%, indicating a steepening in the inversion of the curve last week.
The interest rate yield curve remains unusually “inverted” (i.e. shorter term interest rates are generally higher than longer term ones). Based on the 2-year vs. 10-year spread, the curve has been inverted since July 2022.
Historically, an inverted yield curve is not the norm and has been regarded by many as a leading indicator of an impending recession, with shorter term risk regarded to be unusually higher than longer term. The steeper the inversion, the greater the deemed risk of recession.
Data courtesy of ustreasuryyieldcurve.com as of Friday. The lightly shaded area on the chart shows the current Federal Funds rate range.
WWW.ANGLIAADVISORS.COM | SIMON@ANGLIAADVISORS.COM | CALL OR TEXT: (646) 286 0290 | FOLLOW ANGLIA ADVISORS ON INSTAGRAM
This material represents a highly opinionated assessment of the financial market environment based on assumptions and prevailing data at a specific point in time and is always subject to change at any time. Although the content is believed to be correct at the time of publication, no warranty of its accuracy or completeness is given. It is never to be interpreted as an attempt to forecast any future events, nor does it offer any kind of guarantee of any future results, circumstances or outcomes.
The material contained herein is not necessarily complete and is wholly insufficient to be exclusively relied upon as research or investment advice or as a sole basis for any investment or other financial decisions. The user assumes the entire risk of any decisions made or actions taken based in whole or in part on any of the information provided in this or any Anglia Advisors communication of any kind. Under no circumstances is any of Anglia Advisors’ content ever intended to constitute tax, legal or medical advice and should never be taken as such. Neither the information contained or any opinion expressed herein constitutes a solicitation for the purchase of any security or asset class. No advice may be rendered by Anglia Advisors unless or until an executed Client Engagement Agreement is in place.
Posts may contain links or references to third party websites or may post data or graphics from them for the convenience and interest of readers. While Anglia Advisors might have reason to believe in the quality of the content provided on these sites, the firm has no control over, and is not in any way responsible for, the accuracy of such content nor for the security or privacy protocols that external sites may or may not employ. By making use of such links, the user assumes, in its entirety, any kind of risk associated with accessing them or making use of any information provided therein.
Those associated with Anglia Advisors, including clients with managed or advised investments, may maintain positions in securities and/or asset classes mentioned in this post.

If you enjoyed this post, why not share it with someone or encourage them to subscribe themselves?


