


For the first three days of last week, the market’s price action felt a bit like a head-thumping hangover the morning after the month-long bender that was November. Then on Friday we got a very Goldilocks Jobs Report which sent prices spiraling upwards again and the S&P 500 had managed to squeak out a new 2023 high by Friday’s close.
A majority of S&P 500 stocks moved higher on Monday, but the index fell - dragged lower for once by the so-called Magnificent Seven (Apple, Microsoft, Alphabet/Google, Nvidia, Meta/Facebook, Amazon and Tesla) all of whom fell by more than 1% for the session.
A narrative developed, bolstered by some of the talking-head types on CNBC and Bloomberg TV, that maybe the expectations of when and by how much the Fed will begin cutting interest rates may be the teeny-tiniest bit over-optimistic and that when the Fed loudly insists that it will not go on a drunken, indiscriminate rate-slashing spree in the first half of 2024, there’s at least a small chance that they might actually mean it.
On Tuesday, we learned from the latest Job Openings and Labor Turnover Survey (JOLTS) that the number of job openings in the US dropped to 8.73 million in October, down from September's 9.55 million, the lowest level since March 2021 and well below the expectation of 9.40 million. Bond yields responded by coming down sharply with the 10 year Treasury interest rate, which had been over 5.0% as recently as October, falling below 4.2%. The S&P 500 index ticked lower again but most of the Magnificent Seven came right back, reversing Monday’s losses.
Wednesday saw another moderate drift lower in stock prices, completing a three-day losing streak for the first time in over a month. Indexes were driven lower partly by their energy-related components as the oil price dipped below $70 on excess supply concerns and a continuing sense that November’s meteoric rise in stocks may just have been overdone and that the upside from here could be more limited as a result.
Artificial Intelligence re-emerged as a market influence on Thursday as both Google and AMD announced new AI-related initiatives. There’s absolutely nothing 2023’s stock market loves more than even a sniff of a mention of anything to do with AI and all the indexes shifted higher, bringing the short losing streak to an end in the lead-up to the all-important Jobs Report the following day.
It landed before the market open on Friday. Payrolls rose 199k in the month, a little above estimates. The unemployment rate fell to 3.7%, below all forecasts and a four-month low as well as extending an historic 22-month stretch in which it has remained below 4% — the longest since Neil Diamond first let us know that good times never felt so good as they did with Caroline in 1969.
The combination of last week’s two big labor market reports keeps current interest rate expectations (no more hikes, cuts coming up pretty soon) in place and did not imply a loss of momentum. In other words, it didn’t really move the needle much and keeps the soft landing thesis very much on the table. We also got a consumer sentiment reading that soared higher as Americans grow more and more confident about where the economy is heading. Stocks moved higher on the back of this feast of good news.
Generally speaking, once Thanksgiving is in the rear view mirror, market participants simply want the year to end quietly, with no surprises and perhaps a few decent gains. The net result is that markets tend to temporarily ignore any data or commentary that might jeopardize the gains (assuming it’s not too bad) and embrace any data or commentary that pushes the bullish narrative, into year-end. I think we are in the midst of that right now, as shown by the bubbly reaction to a couple of AI stories and some pretty good, but hardly sensational, labor market news.
Once this peculiar period ends and January gets under way, things tend to normalize again. What will that normalization look like in early 2024? I think it is all less complex than it seems and will mostly be about expectation vs. actual facts.
Put very simply, if actual facts about economic/inflation data, earnings, bond yields and Fed interest rate policy turn out better than market assumptions, stocks will likely rally. If the actual facts disappoint compared to market assumptions - particularly if the baked-in idea of early rate cuts does not come to pass - then stocks will probably drop, maybe quite hard.
OTHER NEWS ..
Dow Left Behind in 2023 .. Sharp-eyed subscribers will have noticed that, while I frequently refer to indexes like the S&P 500, the NASDAQ and the Russell 2000 in my reports, I do not ever talk about the media’s favorite index, the Dow Jones Industrial Average. That’s because it’s a stupid index. It also hasn’t under-performed the far-superior S&P 500 by this much at any time since the end of the century.
While focusing on one year’s worth of performance data and drawing big conclusions is never a good idea (see ARTICLE OF THE WEEK below) it’s still interesting to note that the olden-timey classic Dow gauge of market performance is up only 10% this year, half that of its big S&P brother, whose 2023 performance itself is only half that of the NASDAQ-100. The biggest reason? The much heavier tech and communications services presence in the S&P 500's and especially the NASDAQ-100’s composition.
Why bother? .. The useless end-of-2024 predictions for the S&P 500 keep coming in. Their record of accuracy is rubbish. For the last five completed years, the prediction vs. actual outcome error ranged from 26% too low to 21% too high. On average, the median annual estimate was off by about 18 percentage points! That’s nearly double the index’s long-term average annual return. Please don’t take any notice of this stuff.
Like A Bad Smell .. Meme stock favorite and nonsense company GameStop came back into our consciousness last week. The good news for the “diamond hands” shareholders who bought in using their Robin Hood accounts during the pandemic, slurped all the Reddit-fueled Kool Aid and held on is that the stock surged 20% on Thursday alone. It’s also up 30% since Thanksgiving. The not-so-good news is that it is also still down more than 82% from its high in 2021.
Three Trill .. Shares of the technology giant Apple rose to close the week at $195.72 which put its market capitalization at over the $3 trillion level (that’s $3,000,000,000,000) and was its highest close since its all-time high in back in July.
UNDER THE HOOD ..
Buying Power’s path of least resistance remains to the upside after having reached new multi-month highs in recent days. However, Selling Pressure has a tendency to strengthen as indexes reach new high-water marks, such as the new 2023 high experienced by the S&P 500 last week. Sometimes the sellers only stick around for a short while, but it does make continued price acceleration harder.
Selectivity is still apparent, favoring Large Cap stocks, but buyers are beginning to find new targets in the Mid Cap and Small Cap space, narrowing the Large/Small gap. While core technical indicators still have work to do to erase negative divergences in place since July, a continuation of this recent resurgence in smaller stocks, thanks to their larger numbers, will be crucial for market-wide improvements in Demand and a sustained intermediate-term advance.
Anglia Advisors clients are welcome to reach out to me to discuss market conditions further.
THIS WEEK’S UPCOMING CALENDAR ..
This week is the last big one of the year when it comes to data, headlined by the Federal Reserve's December rate meeting with a decision due on Wednesday afternoon. The market overwhelmingly expects it to keep the Federal Funds rate steady at a target range of 5.25%-5.50%.
Attention will be on Chairman Jerome Powell's press conference that afternoon and on the Federal Open Market Committee's latest quarterly so-called “Dot Plot”, the Fed officials' latest projections for the economy and the members’ anticipated trajectory for interest rates.
The European Central Bank and Bank of England follow with their own monetary-policy decisions on Thursday.
Earnings reports next week will come from Oracle, Adobe, Costco and Darden Restaurants.
On Tuesday, the Consumer Price Index (CPI) measure of retail inflation for November will be released. The average forecast calls for an unchanged 4.0% year-over-year rise in the Core CPI, which excludes food and energy. The next day, the Producer Price Index (PPI) measure of wholesale inflation experienced by manufacturers is expected to slow slightly from a month earlier.
The most recent Retail Sales data will come out on Thursday.
ARTICLE OF THE WEEK ..
Investors’ biggest mistake at this time of year; looking at the stock market over the course of just twelve months. “You can’t talk about 2023 without looking at 2022.”
LAST WEEK BY THE NUMBERS ..
Last week’s market color courtesy of finviz.com
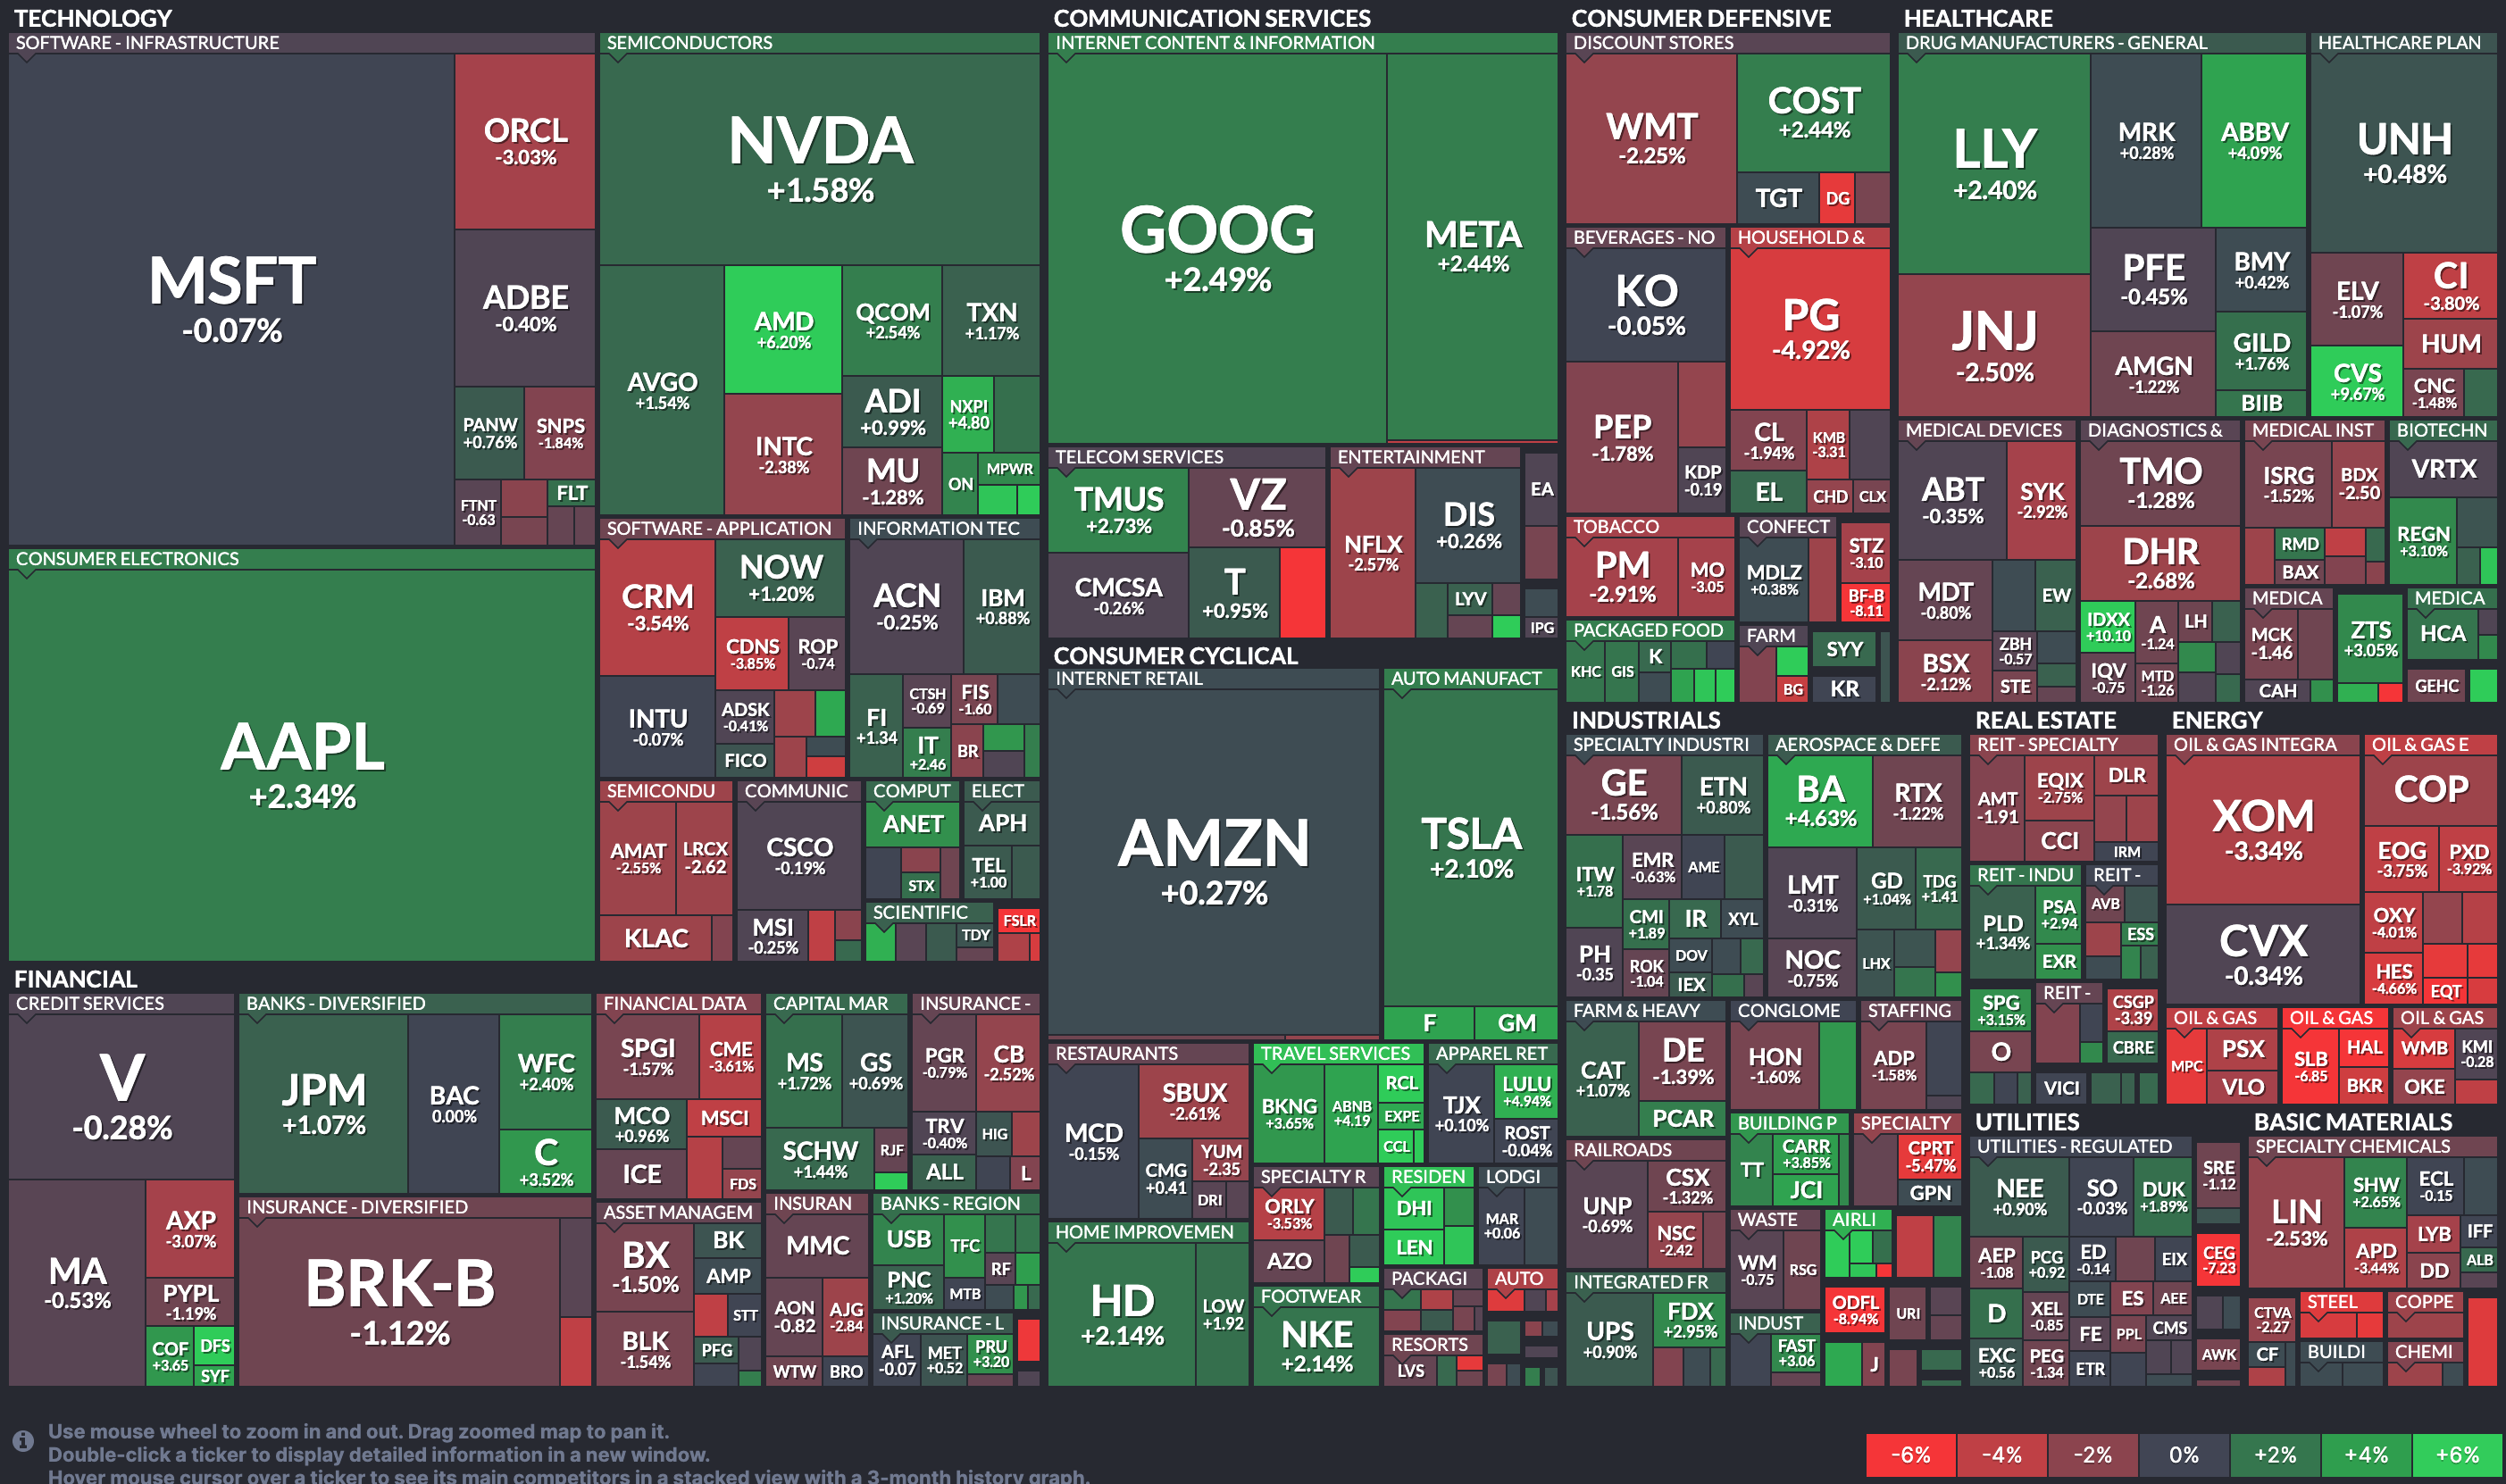
Last week’s best performing US sector: Communication Services (two biggest holdings: Alphabet/Google, Meta/Facebook) - up 1.8% for the week.
Last week’s worst performing US sector: Energy (two biggest holdings: Exxon Mobil, Chevron) - down 2.8% for the week.
The proprietary Lowry's measure for US stock market Buying Power fell by 4 points last week to 150 and that of US stock market Selling Pressure rose by 4 points to 128 over the course of the week.
SPY, the S&P 500 Large Cap ETF, is made up of the stocks of the 500 largest US companies. It ended the week up 21.7% year-to-date (total return) and 3.7% below its all-time high (01/03/2022). SPY is above its 50-day and 90-day moving averages and is also above its long term trend line, with a RSI of 70***
IWM, the Russell 2000 Small Cap ETF, is made up of the bottom two-thirds in terms of company size of the group of the 3,000 largest US stocks. It ended the week up 8.3% year-to-date (total return) and 23.0% below its all-time high (11/05/2021). IWM is above its 50-day and 90-day moving averages and is also above its long term trend line, with a RSI of 67***
*** RSI (Relative Strength Index) above 70: strong but technically overbought, RSI below 30: weak but technically oversold
The VIX, the commonly-accepted measure of expected upcoming stock market risk and volatility (often referred to as the “fear index”) implied by S&P 500 index option trading, ended the week 0.2 points (2%) lower at 12.4. It is below its 50-day and 90-day moving averages and is also below its long term trend line.
AVERAGE 30-YEAR FIXED MORTGAGE RATE ..
7.03%
One week ago: 7.22%, one month ago: 7.50%, one year ago: 6.33%
Data courtesy of: FRED Economic Data, St. Louis Fed as of Thursday of last week.
FEAR & GREED INDEX ..
“Be fearful when others are greedy and be greedy when others are fearful.” Warren Buffet.
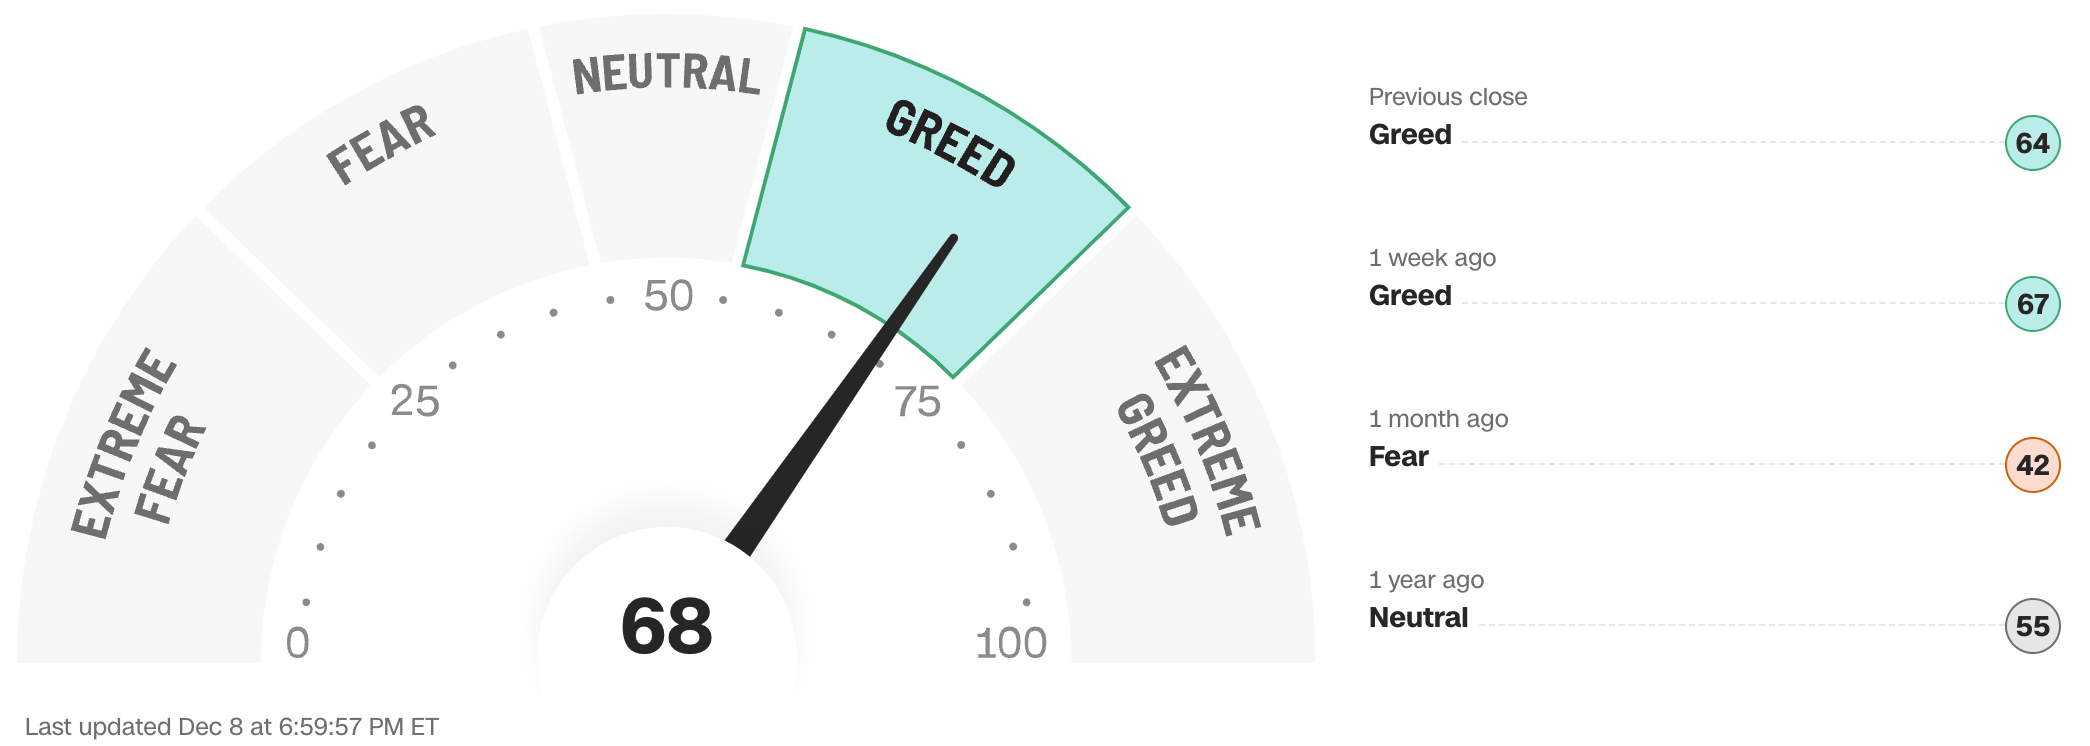
The Fear & Greed Index from CNN Business can be used as an attempt to gauge whether or not stocks are fairly priced and to determine the mood of the market. It is a compilation of seven different indicators that measure some aspect of stock market behavior. They are: market momentum, stock price strength, stock price breadth, put and call options, junk bond demand, market volatility and safe haven demand.
Extreme Fear readings can lead to potential opportunities as investors may have driven prices “too low” from a possibly excessive risk-off negative sentiment.
Extreme Greed readings can be associated with a sense of “FOMO” and investors chasing rallies in an excessively risk-on environment, possibly leaving the market vulnerable to a sharp downward correction at some point.
Data courtesy of CNN Business.
PERCENT OF S&P 500 STOCKS TRADING ABOVE THEIR LONG TERM MOVING AVERAGE (LTMA) ..
62% (310 of the 500 largest stocks in the U.S. ended last week above their LTMA and 190 were below)
One week ago: 63%, one month ago: 37%, one year ago: 54%
A closely-watched measure of market breadth and participation, providing a real-time look at how many of the largest 500 publicly-traded stocks in the U.S. are trending higher or lower, as defined by whether the stock price is above or below the 200-day moving average which is among the most widely-followed of all stock market technical indicators.
The higher the reading, the better the deemed health of the overall market, with 50% considered to be a key pivot point.
WEEKLY US INVESTOR SENTIMENT (outlook for the upcoming 6 months) ..
↑Bullish: 47% (49% a week ago)
⬌ Neutral: 25% (32% a week ago)
↓Bearish: 28% (19% a week ago)
Net Bull-Bear spread: ↑Bullish by 19 (Bullish by 30 a week ago)
For context: Long term averages: Bullish: 38% — Neutral: 32% — Bearish: 30% — Net Bull-Bear spread: Bullish by 8
Survey participants are typically polled during the first half of the week.
Data courtesy of: American Association of Individual Investors (AAII).
FEDWATCH INTEREST RATE PREDICTION TOOL ..
Where will interest rates be at the end of 2023 (one more Fed decision day, on December 13th)?
⬌ Unchanged from now .. 98% probability
One week ago: 99%, one month ago: 90%
↑ Higher than now .. 2% probability
One week ago: 1%, one month ago: 10%
Data courtesy of CME FedWatch Tool. Based on the Fed Funds rate (currently 5.375%). Calculated from Federal Funds futures prices as of Friday.
US TREASURY INTEREST RATE YIELD CURVE ..

The highest rate on the yield curve (5.54%) is being paid for the 1-month duration and the lowest rate (4.23%) is for the 10-year.
The most closely-watched and commonly-used comparative measure of the spread between the 2-year and the 10-year rose last week from 0.34% to 0.48%, indicating a steepening in the inversion of the curve.
The interest rate yield curve remains unusually “inverted” (i.e. shorter term interest rates are generally higher than longer term ones). Based on the 2-year vs. 10-year spread, the curve has been inverted since July 2022.
Historically, an inverted yield curve is not the norm and has been regarded by many as a leading indicator of an impending recession, with shorter term risk deemed to be unusually higher than longer term. The steeper the inversion, the greater the deemed risk of recession.
Data courtesy of ustreasuryyieldcurve.com as of Friday. Lightly shaded area shows the current Federal Funds rate range.
WWW.ANGLIAADVISORS.COM | SIMON@ANGLIAADVISORS.COM | CALL OR TEXT: (929) 677 6774 | FOLLOW ANGLIA ADVISORS ON INSTAGRAM
This material represents a highly opinionated assessment of the financial market environment based on assumptions and prevailing data at a specific point in time and is always subject to change at any time. No warranty of its accuracy or completeness is given. It is never to be interpreted as an attempt to forecast any future events, nor does it offer any kind of guarantee of any future results, circumstances or outcomes.
The material contained herein is not necessarily complete and is wholly insufficient to be exclusively relied upon as research or investment advice or as a sole basis for any investment or other financial decisions. The user assumes the entire risk of any decisions made or actions taken based in whole or in part on any of the information provided in this or any Anglia Advisors communication of any kind. Under no circumstances is any of Anglia Advisors’ content ever intended to constitute tax, legal or medical advice and should never be taken as such. Neither the information contained or any opinion expressed herein constitutes a solicitation for the purchase of any security or asset class.
Posts may contain links or references to third party websites or may post data or graphics from them for the convenience and interest of readers. While Anglia Advisors may have reason to believe in the quality of the content provided on these sites, the firm has no control over, and is not in any way responsible for, the accuracy of such content nor for the security or privacy protocols that external sites may or may not employ. By making use of such links, the user assumes, in its entirety, any kind of risk associated with accessing them or making use of any information provided therein.
Those associated with Anglia Advisors, including clients with managed or advised investments, may maintain positions in securities and/or asset classes mentioned in this post.

If you enjoyed this post, why not share it with someone or encourage them to subscribe themselves?


