


A steady stream of earnings reports last week, along with continued positive economic and inflation data, set up the stock market for another shift higher. But it all felt a bit forced, with small, incremental gains rather than solid leaps forward. There’s a sense that markets may have hit an air pocket in their upward glidepath as we wait to see if rising Large Cap stocks can pull the rest of the market up with them.
Even in the face of deepening hostilities in the Middle East and a resulting firmness in the oil price, Monday saw the S&P 500 add to its all-time high set the previous Friday on optimism surrounding upcoming tech earnings later in the week and momentum from the previous Friday’s big gains. The session was also notable for an impressive turnaround in recently-beaten-down Small Cap stocks which quite handily outperformed their Large Cap cousins on the day.
On Tuesday, stocks remained stuck in a narrow range as Wall Street tried to drink from a firehose of very mixed earnings reports from many of the big dogs, while also keeping an eye (ok, maybe just half an eye) on the New Hampshire Republican primary that day. The indexes still managed to creep a little higher, thereby setting yet another all-time record closing high in the S&P 500.
It was a similar story on Wednesday. After a bubbly start, stock prices retreated and spent most of the day hugging the unchanged line. Again, some decent earnings provided some support but the feeling is developing that it’s going to take something shiny and new to trigger the next meaningful leg higher. With GDP and PCE inflation coming out before the end of the week, there was a chance that we might just get that, but no-one seemed particularly willing to bet big-time on it.
Nevertheless, a teeny gain on Wednesday for the S&P 500, helped partly by the European Central Bank (ECB) holding interest rates steady over there, saw yet another new all-time record closing high for that index. The NASDAQ-100 also climbed for the fifth successive day, reflecting renewed optimism in the tech space.
By the time the market opened on Thursday, we had learned that Tesla suffered dismal revenues and profits in Q4 2023 relative to expectations along with a gloomy projection of “notably slower growth” in 2024. Wall Street was distinctly unimpressed and trashed the stock by 12% in a matter of hours.
However on a more general note, we also saw the first of three estimates for Q4 2023 Gross Domestic Product (GDP) come in way higher than expected at a 3.3% growth rate vs. the expectation of 2.0% and a rest-of-2023 total growth rate of 2.5%. This sparked something of a rally in stock prices with an increase in optimism about earnings in a much more-buoyant-than-expected economy. Markets still seem convinced that interest rate cuts are coming sometime this year, regardless of economic data.
On Friday, the pre-market release of the Fed’s preferred method of measuring inflation, the Core Personal Consumption Expenditures (PCE) Price Index for December, showed an increase of 0.2% on the month and fell to 2.9% on a yearly basis, a three year low and less than 1% above the Fed’s target rate, keeping the debate alive over whether officials will soon cut interest rates.
The S&P 500 seemed to not really know how to react and just waffled around most of the day. By the close it had slipped less than 0.1% on the day, finally ending its streak of consecutive record-high closes. Focus continued to be on big company earnings reports. Disappointment from Intel got severely punished but on the other hand, American Express’ stock price soared to a new all-time high after strong 2024 guidance and a dividend increase. Despite Friday's less decisive performances, all the major indexes posted weekly advances.
So, what is currently keeping Wall Street traders up at night?
I know I keep saying it, but .. this market is very vulnerable to a substantial decline should economic data start to point towards any kind of a hard landing (which, to be clear, it is not doing right now). That statement is especially true given i) the nearly universal expectation that there will not be a hard landing and ii) the stock market, especially in Large Caps, is very stretched on a valuation basis at these current prices.
It’s still too early to draw any conclusions about growth from this earnings season, mega-cap tech earnings will still dominate the narrative. So far though, non-tech earnings and guidance are echoing what we’re seeing in the broader data; that economic growth is definitely moderating.
We are starting to witness cracks and some significant divergences within the group of so-called Magnificent Seven stocks that have driven the rally over most of the last year. For example, Nvidia is up over 20% so far in 2024, but with last week’s terrible performance, Tesla is now down 26% over the same period. That’s more than $200 billion of the company’s value wiped out in four weeks.
Also of some concern is the fact that the probability that interest rates will be lower than now after the May Fed meeting last week slipped below a 100% certainty for the first time (see FEDWATCH INTEREST RATE TOOL below). Futures market probability also now favors an end-of-year Fed Funds interest rate of 3.875% which is 1.50% lower than where we are now, but still a quarter of a percent higher than where the expectation was just the previous week. I have now started tracking this important market assumption each week in FEDWATCH INTEREST RATE TOOL below.
The stock market was described by one analyst last week as being like a runaway train. He added that a runaway train usually does go off the rails in the end, but it can travel a long way before that happens.
OTHER NEWS ..
Bounce Back? .. We just ended a two-year barren spell without a new all-time record high in the S&P 500 index. In 13 of the 14 prior instances the index went at least a year between record highs, it has been higher a year later (the exception was 2007, which followed a seven year drought). The average gain over the ensuing twelve months was 14%, which is about three percentage points higher than the average annual return for the S&P 500 over the last hundred years.
India Goes Fourth .. India’s stock market capitalization has overtaken Hong Kong’s for the first time as the former’s growth prospects and policy reforms make it an investor darling just as global capital pours out of China. The combined value of shares listed on Indian exchanges reached $4.33 trillion as of Monday’s close, versus $4.29 trillion for Hong Kong, according to data compiled by Bloomberg. That makes India the fourth-biggest stock market in the world, behind only the U.S., China and Japan.
Toyota’s EV Skepticism .. Toyota Motor Corp. Chairman Akio Toyoda says he believes battery electric vehicles will reach only a 30% market share at most - with the rest taken up by hybrids, hydrogen fuel cell and fuel-burning cars. He pointed out that, with a billion people in the world living without electricity, limiting their choices and ability to travel by making expensive cars simply isn’t the answer. “Customers, not regulations or politics, should make that decision,” he said.
UNDER THE HOOD ..
Both price action and the technical body of evidence now reflect a returning split between the largest stocks and the rest of the pack. In terms of Demand, it will be important to monitor which segment (large or small) reverses direction to meet the other. In relative strength terms to the S&P 500 Large Cap index, the Russell 2K Small Cap index fell to its lowest levels since late November, giving back all of the relative outperformance that it had realized in December.
As is always the case when markets are at all-time highs, there is no overhead technical resistance for the market, so the psychological 4,900 level in the S&P 500 will be key to watch to the upside, as the round number could offer an excuse for some traders to take profits while it is also a high-volume, important options market strike price.
Patience is advisable, with broad-based Demand still more likely than not to ultimately return sometime soon. Heightened Demand selectivity and an uptick in Supply has been evident since the calendar flipped to 2024. Investors will be looking for a return of these trends to the very different trajectories they were on in the last weeks of 2023, when they were reflecting a healthy market condition that was able to generate new all-time highs.
Anglia Advisors clients are welcome to reach out to me to discuss market conditions further.
THIS WEEK’S UPCOMING CALENDAR ..
This week will be jam-packed on both the macro and micro fronts. There's a Fed policy meeting, January jobs data, and earnings reports from about a hundred S&P 500 firms to look forward to, including from some the biggest companies in the world.
The Federal Open Market Committee will announce its interest rate decision on Wednesday afternoon, followed by a press conference with Fed Chairman Jerome Powell. Wall Street is forecasting no change at this meeting, but will be paying close attention to any clues about when the central bank might begin cutting rates later in 2024.
Q4 2023 earnings reports this week include those from Microsoft, Apple, Alphabet/Google, Amazon, Meta/Facebook, Exxon Mobil, Pfizer, General Motors, Chevron, Mastercard, Starbucks, AMD, Qualcomm, Merck, Bristol Meyers Squibb, Nucor and Boeing.
On Tuesday, we get to see the latest Job Openings and Labor Turnover Survey (JOLTS) which is expected to show 8.7 million job openings on the last business day of December.
But the economic-data highlight of the week will be the January Jobs Report on Friday morning. Estimates are for a gain of 175k payrolls and an unemployment rate of 3.8%.
ARTICLE OF THE WEEK ..
How does the historical rate of return on a real estate investment stack up against other assets?
LAST WEEK BY THE NUMBERS ..
Last week’s market color courtesy of finviz.com

Last week’s best performing U.S. sector: Energy (two biggest holdings: Exxon Mobil, Chevron) for the second week in a row - up 5.1% for the week.
Last week’s worst performing U.S. sector: Consumer Cyclical (two biggest holdings: Amazon, Tesla) - down 2.0% for the week.
SPY, the S&P 500 Large Cap ETF, is made up of the stocks of the 500 largest U.S. companies. Its price rose 0.9% last week, is up 2.6% so far this year and is 0.1% below its all-time closing record high (01/25/2024)
IWM, the Russell 2000 Small Cap ETF, is made up of the bottom two-thirds in terms of company size of the group of the 3,000 largest U.S. stocks. Its price rose 1.7% last week, is down 2.4% so far this year and is 19.2% below its all-time closing record high (11/05/2021)
DXY, the U.S. Dollar index, is an index that measures the value of the U.S. Dollar against a weighted basket of six other major currencies (the Euro, the Japanese Yen, the British Pound, the Canadian Dollar, the Swedish Krone and the Swiss Franc). It rose 0.1% last week, is up 2.1% so far this year and is up 14.8% over the last three years.
AVERAGE 30-YEAR FIXED MORTGAGE RATE ..
6.69 %
One week ago: 6.60%, one month ago: 6.61%, one year ago: 6.13%
Data courtesy of: FRED Economic Data, St. Louis Fed as of Thursday of last week.
FEAR & GREED INDEX ..
“Be fearful when others are greedy and be greedy when others are fearful.” Warren Buffet.

The Fear & Greed Index from CNN Business can be used as an attempt to gauge whether or not stocks are fairly priced and to determine the mood of the market. It is a compilation of seven of the most important indicators that measure different aspects of stock market behavior. They are: market momentum, stock price strength, stock price breadth, put and call option ratio, junk bond demand, market volatility and safe haven demand.
Extreme Fear readings can lead to potential opportunities as investors may have driven prices “too low” from a possibly excessive risk-off negative sentiment.
Extreme Greed readings can be associated with possibly too-frothy prices and a sense of “FOMO” with investors chasing rallies in an excessively risk-on environment . This overcrowded positioning leaves the market potentially vulnerable to a sharp downward reversal at some point.
The “sweet spot” is considered to be in the lower-to-mid “Greed” zone.
Data courtesy of CNN Business.
% OF S&P 500 STOCKS TRADING ABOVE THEIR 50-DAY MOVING AVERAGE ..
75% (377 of the 500 largest stocks in the U.S. ended last week above their 50D MA and 123 were below)
One week ago: 74%, one month ago: 88%, one year ago: 74%
% OF S&P 500 STOCKS TRADING ABOVE THEIR 200-DAY MOVING AVERAGE ..
71% (371 of the 500 largest stocks in the U.S. ended last week above their 200D MA and 129 were below)
One week ago: 69%, one month ago: 75%, one year ago: 69%
Closely-watched measures of market breadth and participation, providing a real-time look at how many of the largest 500 publicly-traded stocks in the U.S. are trending higher or lower, as defined by whether the stock price is above or below their more sensitive 50-day (short term) and less sensitive 200-day (long term) moving averages which are among the most widely-followed of all stock market technical indicators.
The higher the reading, the better the deemed health of the overall market trend, with 50% considered to be a key pivot point. Readings above 90% or below 15% are extremely rare.
Crossovers between the 50-day and the 200-day are also considered to be significant: a technical uptrend is considered to be in place when the 50-day percentage is above that of the 200-day and a technical downtrend when it is below.
WEEKLY US INVESTOR SENTIMENT (outlook for the upcoming 6 months) ..
↑Bullish: 39% (40% a week ago)
⬌ Neutral: 35% (33% a week ago)
↓Bearish: 26% (27% a week ago)
Net Bull-Bear spread: ↑Bullish by 13 (Bullish by 13 a week ago)
For context: Long term averages: Bullish: 38% — Neutral: 32% — Bearish: 30% — Net Bull-Bear spread: Bullish by 8
Survey participants are typically polled during the first half of the week.
Data courtesy of: American Association of Individual Investors (AAII).
FEDWATCH INTEREST RATE TOOL ..
Will interest rates be lower than they are now following the Fed’s meeting this week (on January 31st)?
Yes .. 3% probability (3% a week ago)
No .. 97% probability (97% a week ago)
Will interest rates be lower than they are now following the Fed’s meeting on March 20th?
Yes .. 48% probability (49% a week ago)
No .. 52% probability (51% a week ago)
Will interest rates be lower than they are now following the Fed’s meeting on May 1st?
Yes .. 88% probability (100% a week ago)
No .. 12% probability (0% a week ago)
Where is the Fed Funds interest rate most likely to be at the end of 2024?
3.875% (1.50% lower than now)
One week ago: 3.625%, one month ago: 3.625%
Based on the Fed Funds rate (currently 5.375%). Calculated from Federal Funds futures prices as of Friday. Data courtesy of CME FedWatch Tool.
US TREASURY INTEREST RATE YIELD CURVE ..
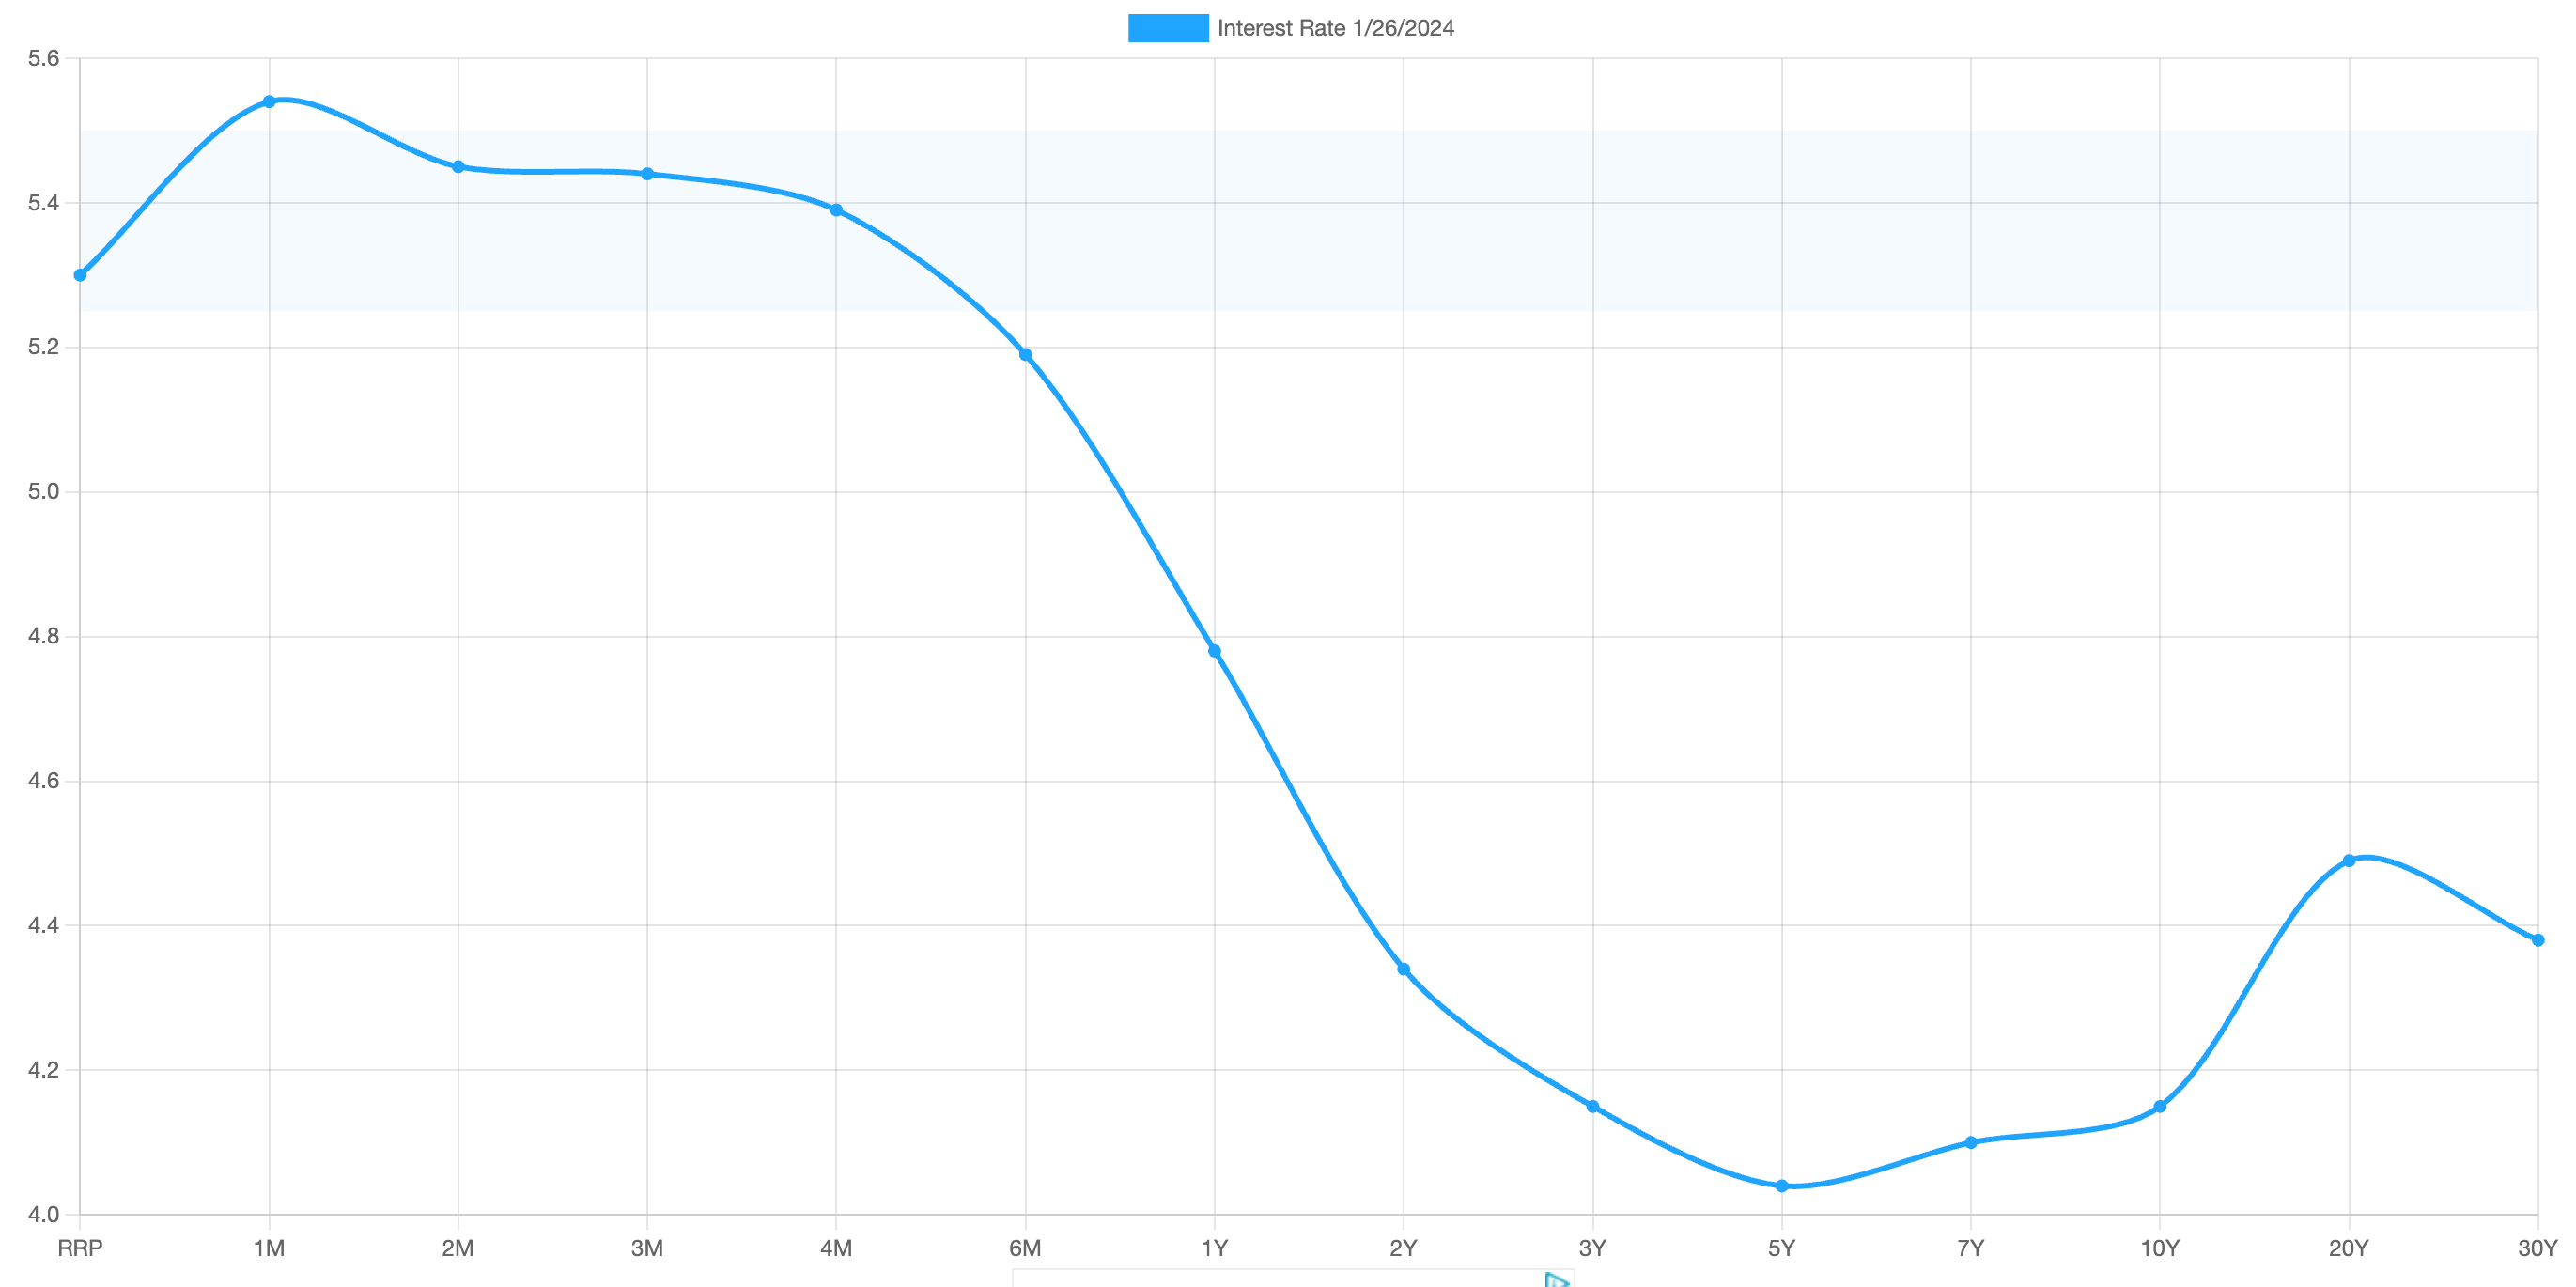
The highest rate on the yield curve (5.54%) is being paid for the 1-month duration and the lowest rate (4.04%) is for the 5-year.
The most closely-watched and commonly-used comparative measure of the spread between the 2-year and the 10-year fell from 0.24% to 0.19%, indicating a flattening in the inversion of the curve.
The interest rate yield curve remains unusually “inverted” (i.e. shorter term interest rates are generally higher than longer term ones). Based on the 2-year vs. 10-year spread, the curve has been inverted since July 2022.
Historically, an inverted yield curve is not the norm and has been regarded by many as a leading indicator of an impending recession, with shorter term risk regarded to be unusually higher than longer term. The steeper the inversion, the greater the deemed risk of recession.
Data courtesy of ustreasuryyieldcurve.com as of Friday. Lightly shaded area on the chart shows the current Federal Funds rate range.
WWW.ANGLIAADVISORS.COM | SIMON@ANGLIAADVISORS.COM | CALL OR TEXT: (929) 677 6774 | FOLLOW ANGLIA ADVISORS ON INSTAGRAM
This material represents a highly opinionated assessment of the financial market environment based on assumptions and prevailing data at a specific point in time and is always subject to change at any time. Although the content is believed to be correct at the time of publication, no warranty of its accuracy or completeness is given. It is never to be interpreted as an attempt to forecast any future events, nor does it offer any kind of guarantee of any future results, circumstances or outcomes.
The material contained herein is not necessarily complete and is wholly insufficient to be exclusively relied upon as research or investment advice or as a sole basis for any investment or other financial decisions. The user assumes the entire risk of any decisions made or actions taken based in whole or in part on any of the information provided in this or any Anglia Advisors communication of any kind. Under no circumstances is any of Anglia Advisors’ content ever intended to constitute tax, legal or medical advice and should never be taken as such. Neither the information contained or any opinion expressed herein constitutes a solicitation for the purchase of any security or asset class.
Posts may contain links or references to third party websites or may post data or graphics from them for the convenience and interest of readers. While Anglia Advisors may have reason to believe in the quality of the content provided on these sites, the firm has no control over, and is not in any way responsible for, the accuracy of such content nor for the security or privacy protocols that external sites may or may not employ. By making use of such links, the user assumes, in its entirety, any kind of risk associated with accessing them or making use of any information provided therein.
Those associated with Anglia Advisors, including clients with managed or advised investments, may maintain positions in securities and/or asset classes mentioned in this post.

If you enjoyed this post, why not share it with someone or encourage them to subscribe themselves?


