


The S&P 500 is at exactly the same level it was at two years ago. That’s a lot of angst and stress expended for no net change in 24 months. As if to emphasize the point, the stock market spent large portions of last week just churning sideways on very low volume as traders monitored the reported progress in debt ceiling negotiations. These dreary spells were occasionally punctuated by bursts of activity as i) carefully-managed clues were tactically released about how the debt ceiling negotiations might be going and ii) Fed officials suddenly got very talkative again.
There are now just ten days left until Treasury Secretary Janet Yellen's June 1st deadline for when the government runs out of cash. Investors are pricing in higher risk to anything maturing within a short time of that projected date, which is why the one-month US T-Bill has become the preferred barometer for sentiment towards the debt negotiations. The higher the yield, the more concern there is (see US TREASURY INTEREST RATE YIELD CURVE below for the latest reading).
Perhaps an anonymous White House staffer put it best when they apparently said that passing the debt ceiling increase is like passing a kidney stone. We all know it will pass, it’s just a question of how difficult it will be.
Investors held their collective breath amid the latest pile of nonsense coming out of Washington DC on Monday, which saw the lowest daily trading volume of the year so far on the New York Stock Exchange. Things ratcheted up a little on Tuesday when McCarthy bizarrely bleated that the two sides were somehow simultaneously miles apart and yet maybe really close to a deal that might be just around the corner. Biden pulled a classic drama-queen PR stunt, saying he will cut short a very important Asian trip to come back early to ride to the rescue. Later in the week, the spin went into overdrive with suddenly optimistic bulletins being pushed out from both sides, each desperately trying to look like the good guy.
But then, on Friday, under increasing pressure from their own “burn-it-all-down” members to break off talks, the Republican delegation surprised precisely nobody by staging a hissy fit, flouncing out of the negotiation meeting and declaring the talks paused. The stock market eye-rolled, sighed and gave back the day’s gains.
Smoke and mirrors. I suggest not believing a single thing you hear from either side until a deal is officially done or once the nation is in a death spiral, whichever option it is these clowns choose for us.
Since 1960, Congress has acted 78 separate times to permanently raise, temporarily extend or revise the definition of the debt limit – 49 times under Republican presidents and 29 times under Democratic presidents. It’s obviously got a load of precedent and it’s not hard to do. Just do it FFS! We need to move on to address other much more important stuff, not get wrapped up in completely unnecessary self-inflicted wounds.
Generally hawkish commentary from multiple Fed officials reminding us that the battle against inflation is still far from won means that it may now be a much closer call than we first thought whether the Fed committee continues raising rates or pauses at the next meeting in June. Markets at one point even indicated a one in three probability of a hike, up from just 12% only a week ago - before falling back again on Friday after the debt talks collapsed.
The price of shares in Home Depot (HD) fell hard on Tuesday after the biggest US home retailer reported a more than 4% drop in year-on-year revenue, missing expectations by the biggest margin in 20 years and gave pretty depressing forward guidance. More generally, however, Retail Sales on a national level (see EXPLAINER: FINANCIAL TERM OF THE WEEK below) increased in April, although the headline number was slightly lower than expected. The core number that excludes auto and gas sales was encouraging, however, with the best showing put in by online stores and restaurants and bars. This all suggests that consumer spending is broadly holding up in the face of continued economic difficulties including inflation and high borrowing costs.
When you aggregate and analyze the appropriate data, you definitely see that the odds of a soft landing (inflation eventually conquered with no recession or, at worst, a mild one) still remain higher than those of a hard landing. To be clear, this analysis does not mean a hard landing won’t happen. But so far, it is not happening. Yes, the economy is clearly slowing, but not at the pace that we’d consider yet puts us in hard landing territory.
I will, of course be keeping an eye on (and sharing with you) how these odds develop over time and there has been a recent spike in weekly jobless claims that bears watching, but at this point it’s the softies who seem in a better position than the hard-men. This is helping support stock prices, indeed the S&P 500 hit new 2023 highs at one point last week and the NASDAQ even reached its highest level in over a year.
Q1 2023 earnings season is almost over. The overwhelming expectation was that S&P 500 company earnings would fall close to 7% last quarter from the previous one. The fact is they have only fallen about 2%. As Bank of America put it last week, “it is dangerous to underestimate Corporate America's margin preservation skills.”
Stock markets are priced for a pause, a quick pivot and then multiple rate cuts by early next year. Anything less could well be a problem. The concentration of this year’s gains in a small number of big tech names (see UNDER THE HOOD below) makes the S&P 500 vulnerable to a selloff if they start to lose value, even if everything else rallies higher.
Indeed the massive irony is that if investors start to put money to work in other sectors, pivoting away from focusing just on those monster names, a buying spree could even be the catalyst for something of a sell-off at the index level.
OTHER NEWS ..
Indebted .. Consumer debt hit a fresh high in Q1 2023, pushing past $17 trillion for the first time ever, according to a report from the New York Federal Reserve.
Households added $148 billion in overall debt in the quarter. Balances are now $2.9 trillion higher than just before the pandemic. Consumers typically build up more credit card debt at the end of the year during the holiday season and then reduce those balances at the start of the year. However, for the first time in 20 years, that wasn’t the case, suggesting some households are under strain from higher prices and may be relying on credit cards to maintain spending.
The overall delinquency rate remained relatively low by historical levels at 2.6%, but the amount of debt that became delinquent is rising in most loan categories, including credit card and auto debt.
Not going back .. When average city office-occupancy rates at the start of the year surpassed 50% again for the first time since the pandemic, many landlords viewed this as a sign that employees were finally resuming their former work habits and would soon be flooding back into offices all over the country.
However, the Wall Street Journal last week reported that those office-usage rates have not budged since then, with most companies now settling into a hybrid work strategy that shows little sign of fading. About 58% of companies allow employees to work a portion of their week from home. In fact, the number of companies that actually require employees to be in the office full-time is now declining again, down to 42% from 49% just three months ago.
With employees at companies with hybrid strategies spending an average of only half the five-day work-week in the office, it isn’t surprising that these office-return rates have stalled out at around half the pre-pandemic levels. The rise in employees working from home has driven some retailers and restaurants out of business and forced owners of office buildings to either reduce rents or to just get out of the commercial real estate business by selling their properties.
US commercial real estate prices fell in Q1 2023 for the first time in more than a decade. While the decline was less than 1%, Moody’s chief economist expects prices to drop about 10% overall, and potentially further in the case of a confirmed US recession.
UNDER THE HOOD ..
Sticking with the theme of smoke and mirrors, on Tuesday of last week Lowry’s Buying Power dipped below the level last seen at the October 2022 stock market low. A commonly-held optimistic narrative is that this was the bottom and a new bull market began at that time, but the level of Demand last week was weaker than it was at the supposed end of the preceding 10-month bear market. This just makes no sense from a technical perspective. Why has Demand now fallen back to new depths a full seven months after a “market bottom” with the indexes now much higher?
The Percent of Stocks Above Their 30 Week Moving Averages held a very robust reading of over 83% on February 2nd. Since then, that reading has been cut in half, while the S&P 500 Index closed last week higher than it was then. This negative divergence clearly shows the poor condition of market breadth.
As mentioned earlier in this report, the NASDAQ index hit a one year high on Thursday - but there were also more one year lows registered last week than one year highs.
The technical evidence is crystal clear .. the heavy lifting is being carried out by fewer and fewer stocks.
Anglia Advisors clients are welcome to reach out to me to discuss market conditions further.
THIS WEEK’S UPCOMING CALENDAR ..
Inflation data, Federal Reserve meeting minutes, and late-in-the-season Q1 earnings from some retailers and chip makers are the highlights on this week's calendar.
Earnings will be released by Zoom Video, Costco, Dollar Tree, Best Buy, Lowe’s, Autozone, Marvell Technology, Analog Devices and Snowflake. JPMorgan Chase and Ford Motor will host investor days.
On Wednesday, the minutes from the Fed’s last rate-setting meeting will be published. They will be combed through for deeper insight as to how committee members are thinking.
The Fed's preferred inflation measure, the latest Core Personal Consumption Expenditures (PCE) price index comes out on Friday. It’s mostly based on this data that committee members make their inflation assumptions which then lead to their interest rate decisions.The forecast is that it will fall to 4.4% year-on-year. That same day, the April Durable Goods number will also come out.
AVERAGE 30-YEAR FIXED RATE MORTGAGE ..
6.39%
(one week ago: 6.35%, one month ago: 6.27%, one year ago: 5.25%)
Data courtesy of: FRED Economic Data, St. Louis Fed as of Thursday of last week.
US INVESTOR SENTIMENT (outlook for the upcoming 6 months) ..
↑Bullish: 23% (29% a week ago)
↔ Neutral: 37% (29% a week ago)
↓Bearish: 40% (42% a week ago)
Net Bull-Bear spread: ↓Bearish by 17 (Bearish by 13 a week ago)
Data courtesy of: American Association of Individual Investors (AAII).
For context: Long term averages: Bullish: 38% — Neutral: 32% — Bearish: 30% — Net Bull-Bear spread: Bullish by 8
Weekly sentiment survey participants are usually polled on Tuesdays and/or Wednesdays.
US TREASURY INTEREST RATE YIELD CURVE ..

The interest rate yield curve remains “inverted” (i.e. most shorter term interest rates are higher than longer term ones) with the highest rate (5.62%) being paid currently for the 1-month duration and the lowest rate (3.70%) for the 10-year.
The closely-watched and most commonly-used comparative measure of the spread between the 2-year and the 10-year last week rose from 0.52% to 0.58%, indicating an overall steepening of the inverted curve over the last five days.
The curve has been inverted since July 2022 based on the 2 year vs. 10 year spread. Historically, an inverted yield curve has been regarded as a leading indicator of an impending recession, with shorter term risk deemed to be unusually higher than longer term.
Data courtesy of ustreasuryyieldcurve.com as of Friday.
FEDWATCH INTEREST RATE PREDICTION TOOL ..
Where will interest rates (Fed Funds rate, currently 5.125%) be at the end of 2023?
↑ Higher than now .. 1% probability
(one week ago: 0%, one month ago: 2%)
↔ Unchanged from now .. 8% probability
(one week ago: 0%, one month ago: 12%)
↓ Lower than now .. 91% probability
(one week ago: 100%, one month ago: 86%)
What are the latest market expectations for what the Fed will announce re: interest rate changes (Fed Funds rate, currently 5.125%) on June 14th after its next meeting?
↑ 0.25% increase .. 17% probability
(one week ago: 12%, one month ago: 30%)
↔ No change .. 83% probability
(one week ago: 88%, one month ago: 59%)
↓ 0.25% cut .. 0% probability
(one week ago: 0%, one month ago: 11%)
Data courtesy of CME FedWatch Tool. Calculated from Federal Funds futures prices as of Friday.
LAST WEEK BY THE NUMBERS ..
Last week’s market color courtesy of finviz.com:
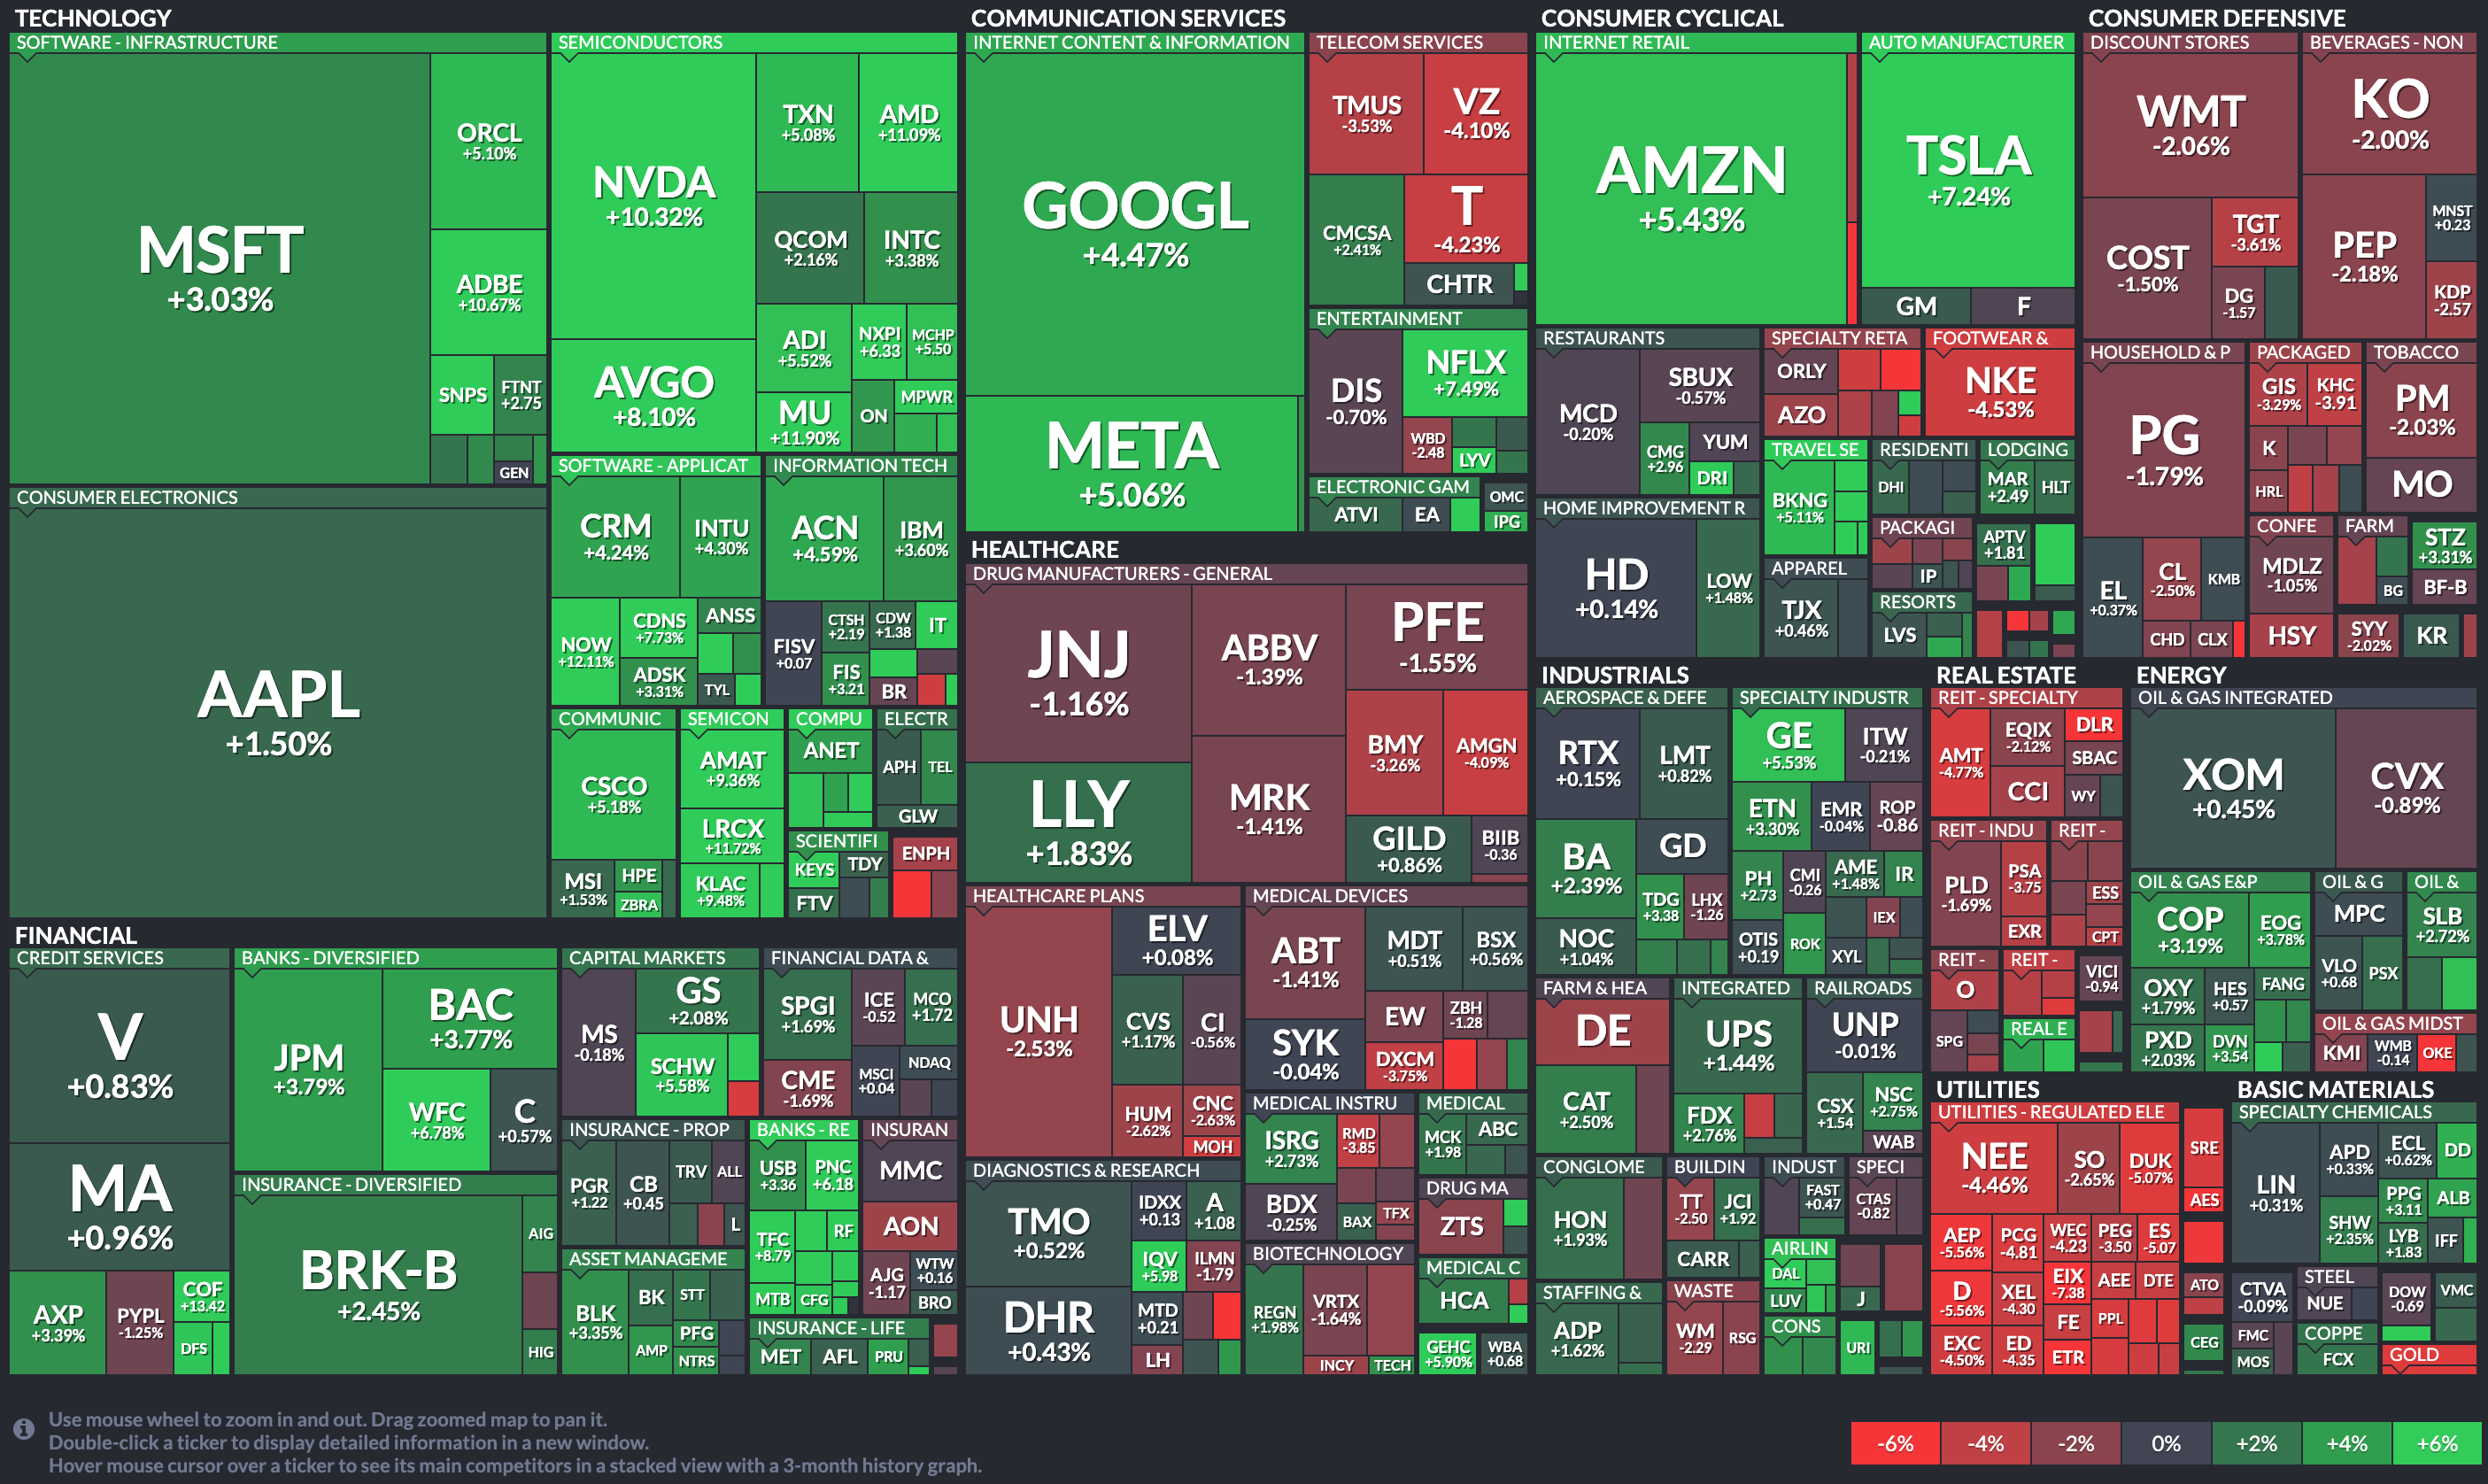
- Last week’s best performing US sector: Technology (two biggest holdings: Apple, Microsoft) - up 4.3% for the week
- Last week’s worst performing US sector: Utilities (two biggest holdings: NextEra Energy, Southern Co.) - down 4.3% for the week
- The proprietary Lowry's measure for US Market Buying Power is currently at 136 and rose by 4 points last week and that of US Market Selling Pressure is now at 161 and fell by 4 points over the course of the week.
- SPY, the S&P 500 ETF, remains above its 50-day and 90-day moving averages and above its long term trend line with a RSI of 61**. SPY ended the week 12.4% below its all-time high (01/03/2022).
- QQQ, the NASDAQ-100 ETF, remains above its 50-day and 90-day moving averages and above its long term trend line with a technically over-bought RSI of 71**. QQQ ended the week 16.7% below its all-time high (11/19/2021).
- VIX, the commonly-accepted measure of expected upcoming stock market risk and volatility (often referred to as the “fear index”), implied by S&P 500 index option trading, ended the week 0.2 points lower at 16.8. It remains below its 50-day and 90-day moving averages and below its long term trend line.
** RSI (Relative Strength Index) above 70: technically over-bought, RSI below 30: technically over-sold
ARTICLE OF THE WEEK ..
Are you a loner, a follower or a zombie?
EXPLAINER: FINANCIAL TERM OF THE WEEK ..
A weekly feature using information found on Investopedia to try to help explain Wall Street gobbledygook (may be edited at times for clarity).
The term "retail sales" refers to an economic metric that tracks consumer demand for finished goods. This figure is a very important data set as it is a key monthly market-moving event. Retail sales are reported each month by the U.S. Census Bureau and indicate the direction of the economy. It acts as a key economic barometer and whether inflationary pressures exist. Retail sales are measured by durable and non-durable goods purchased over a defined period of time. Sales for the report are derived from 13 types of retailers from food service to retail stores.
Retail sales are a good indicator of the pulse of the economy and its projected path toward expansion or contraction. Retail sales figures are reported by all food service and retail stores and compiled by the U.S. Census Bureau. The measurement is typically based on data sampling and is used to model the patterns for the entire country.
As a leading macroeconomic indicator, healthy retail sales figures typically elicit positive movements in equity markets. Higher sales are good news for shareholders of retail companies because it means higher earnings. Bondholders, on the other hand, are quite ambivalent towards this metric. A booming economy is good for all, but lower retail sales figures and a contracting economy would translate to a decrease in inflation. This may cause investors to gravitate toward bonds, eventually leading to higher bond prices.
Retail sales capture in-store sales, as well as catalog and other out-of-store sales of both durable (last for more than three years) and non-durable goods (those with a three-year or shorter life span).
These are broken down into a number of different categories including (but not limited to):
Clothing & clothing accessories stores
Pharmacies & drug stores
Food & beverage stores
Electronics and appliance stores
Furniture stores
Gasoline stations
New car dealers
As a broad economic indicator, the retail sales report is one of the timeliest reports because it provides data that is only a few weeks old. Individual retail companies often provide their own sales figures at the same time every month, and their stocks can experience volatility as investors process the data.
Major changes in price can affect retail sales figures. These fluctuations in prices are seen primarily in two retail sales categories: food retailers and gas stations. Large increases in food and energy prices can cause sales figures to drop in both categories, thus affecting the sales of a particular month.
The retail sales figures are compiled monthly by the Census Bureau, which is part of the U.S. Department of Commerce. They are released in the middle of the month and cover the previous month's sales.
Retail sales is an important indicator that signals either the contraction or expansion of an economy. An increase in retail sales signals a healthy economy that is expanding while a decrease in retail sales signals the opposite. An increase in retail sales usually moves stocks upward and is good for shareholders.
WWW.ANGLIAADVISORS.COM | SIMON@ANGLIAADVISORS.COM | CALL OR TEXT: (929) 677 6774 | FOLLOW ANGLIA ADVISORS ON INSTAGRAM
This material represents a highly opinionated assessment of the financial market environment based on assumptions and prevailing data at a specific point in time and is always subject to change at any time. No warranty of its accuracy or completeness is given. It is never to be interpreted as an attempt to forecast any future events, nor does it offer any kind of guarantee of any future results, circumstances or outcomes.
The material contained herein is not necessarily complete and is wholly insufficient to be exclusively relied upon as research or investment advice or as a sole basis for any kind of investment decision or action. The user assumes the entire risk of any decisions made or actions taken based on the information provided in this or any Anglia Advisors communication of any kind. Under no circumstances is any of Anglia Advisors’ content ever intended to constitute tax, legal or medical advice and should never be taken as such. Neither the information contained or any opinion expressed herein constitutes a solicitation for the purchase of any security or asset class.
Posts may contain links or references to third party websites for the convenience and interest of readers. While Anglia Advisors may have reason to believe in the quality of the content provided on these sites, the firm has no control over, and is not in any way responsible for, the accuracy of such content nor for the security or privacy protocols that external sites may or may not employ. By making use of such links, the user assumes, in its entirety, any kind of risk associated with accessing them or making use of any information provided therein.
Clients of, and those associated with, Anglia Advisors may maintain positions in securities and asset classes mentioned in this post.

If you enjoyed this post, why not share it with someone or encourage them to subscribe themselves?


