


Less than twenty months after it began, the bear market that engulfed the S&P 500 in early 2022 is now just 260 points away from being completely erased.
2023 has barely passed its midpoint and the market has already blown through even the most optimistic estimates for where Wall Street thought the S&P 500 might be by year end. In the process, it has constantly defied all the early-year gloom accompanied by talk of a guaranteed recession, soaring inflation and an aggressive Federal Reserve interest rate policy.
However, while it’s undeniable that the fears of a hard landing***, inflation and catastrophic consequences from a hawkish Fed have not materialized, the reality is that the current level of the S&P 500 now largely factors all of that in, so recent solid inflation, retail sales and jobs data have really only reinforced what was already widely assumed to be the case.
All this good data did create further “chasing” from FOMO-infected under-invested professional investors and fund managers needing to play catch up which pushed stock prices up further, but with sentiment so overwhelmingly positive and the financial media and many economists now pretty much dismissing any chances of a recession, most of the chasing that’s going to take place has likely already happened.
Case in point, Goldman Sachs analysts last week reduced their perception of the probability of a recession of any kind in the US to just 20% and JP Morgan essentially took the same position.
We’ve basically had the best outcome anyone could have dreamed of at the start of the year and while that means that the gains in stocks are absolutely legitimate, it also means that there’s a strong risk of exhaustion in the near term.
Bottom line, the macroeconomic picture is currently as positive as anyone can possibly hope for, but don’t confuse that with a low-risk environment. The S&P 500 is highly vulnerable to even the slightest of disappointments, particularly in the area of company earnings.
Last week’s earnings results were a mixed bag. Goldman Sachs' 2Q earnings came in weaker than expected, and Netflix's revenue fell short of forecasts, despite showing a surprisingly strong jump in subscribers on the back of its password-sharing ban. United Airlines and Tesla both beat earnings estimates, but with vastly different outcomes for the stocks, nicely up and badly down, respectively. .
The still-deeply (and continually deepening) inverted yield curve (see US TREASURY INTEREST RATE YIELD CURVE below) remains the elephant in the room as the US economy has fallen into a recession 100% of the time when this happens, looking back at over seven decades of data. The question facing investors now becomes; is it actually different this time, or are we watching one of the largest “bull traps” (see EXPLAINER: FINANCIAL TERM OF THE WEEK below) in history develop in real time?
There’s no suspense surrounding the Fed’s upcoming interest rate call on Wednesday (traders see the chance of a quarter point hike at 99.3%). The only real intrigue lies more in whether we will see two consecutive quarter-point hikes across the July and September meetings. That probability fell last week and is currently being priced at around 16%.
There’s no doubt that the previously narrow path to to a soft landing*** is widening all the time and that is keeping the stock market buoyant. This is demonstrated by the fact that the rally is continuing to broaden from just being driven by big dog tech, with the Russell 2000 Small Cap index, the S&P 600 Mid Cap index and even your grandad’s favorite olden-timey Dow Jones Industrial Average index once again outperforming 2023’s two shining stars, the NASDAQ and the S&P 500, last week.
As I outline in THIS WEEK’S UPCOMING CALENDAR below, we are going to learn a lot this coming week. That could possibly include some earnings letdowns, surprisingly hawkish words from Jerome Powell at his press conference on Wednesday and a nasty surprise in the inflation data on Friday. Any of these things (or worse, a combination of more than one of them) could qualify as a “disappointment” which - as I mentioned earlier - could undo a decent amount of the recent gains.
But the glass-is-half-full view of things is that all of these could further extend the trajectory of the current positive narrative and push us closer to the eventual obliteration of what history may eventually refer to as the post-pandemic bear market of the early 2020s.
*** Later this week, I will be sending out a post in which I explain in more detail some of the stock market and economic terminology that is being bandied about everywhere right now, including the concepts of “hard” and “soft” landings.
OTHER NEWS ..
US Finally Catching Up .. The US Federal Reserve last week launched"FedNow", a long-anticipated service aimed at finally modernizing this country's antiquated and cumbersome money transfer system. This service will eventually enable ordinary Americans to send and receive funds (including pay checks) in seconds and 24/7, eliminating the delays and high expenses commonly associated with cash transfers.
The move will bring the US in line with many other countries like the European Union, the UK, India and Brazil, which have had similar services for many years. FedNow has been in development since 2019 and is expected to significantly improve the efficiency and accessibility of the payment system in the US. A properly-functioning electronic payment system in the US might lessen the perceived need for a central bank digital currency.
US Dollar Blues .. The currency is teetering at the lowest level in more than a year after signs of cooling inflation and other data bolstered bets that the Federal Reserve will soon stop hiking interest rates. Many strategists and investors saying a turning point is finally at hand for the dollar. If they’re right, there could be far-reaching consequences for global economies and financial markets. A long-term dollar slide would reduce import prices for developing nations, helping them to ease their inflation pressures. It would also help to bolster currencies like the yen, which has been tumbling for months. More broadly, a softer US currency would tend to boost American firms’ exports at the expense of their counterparts in Europe, Asia and elsewhere.
What it will absolutely NOT do, contrary to ridiculous online and social media conspiracy nonsense that has been spiking recently, is to spell the end of the US Dollar as the world’s reserve currency.
Euro-Problems .. An aging population with a preference for recreation, leisure and job security over earnings and personal financial sustainability has created years of lackluster economic and productivity growth to European Union (EU) countries. The eurozone economy grew about 6% over the past 15 years, measured in dollars, compared with 82% for the US, according to data from the International Monetary Fund (IMF).
That has left the average EU country poorer per head than every US state except Idaho and Mississippi, according to a report this month by the European Centre for International Political Economy. European governments are now finding the old recipes for fixing the problem of economic growth and populations financially unprepared for retirement are either becoming unaffordable or have simply stopped working and most of them appear to have no Plan B.
UNDER THE HOOD ..
On the charts, the S&P 500 index (which closed on Friday at 4536), breached a very important upside resistance level of 4529 last week. Next up are 4559 and 4602. Downside support can be found at 4490 and 4439 and then not much after that till 4350 and 4309.
Smaller Cap stocks still hold the key to any technical-analysis-endorsed market turnaround from bear to bull.
The Percent of Small-Cap Stocks 20% or More Below One Year Highs remains elevated at nearly 43% indicating many smaller stocks are still in bear markets. The outlier status of the Small Cap segment is illustrated by the fact that Large and Mid Caps have readings of 15% and 18%, respectively. Moving forward, a sustainable drop in this reading below the previous February 2nd low of 39% would provide evidence of investors taking on more risk.
On the opposite side of the spectrum, the Percent of Small-Cap Stocks Within 2% of One Year Highs is still disappointingly low at around 14% - but is showing signs of heading in the right direction.
The balance of Supply and Demand is definitely on more favorable footing these days, although this is being accomplished more through a decline in Supply than an explosion of Demand, leading to the slight suspicion that there is still something a bit “off” about the current market.
Bottom line: while a significant further broadening of participation of smaller stocks is still needed to improve the overall health of the broad market, there are growing signs that some of the technical divergences between the market’s real health and just the part of the iceberg that shows above the surface are narrowing. The under-the-hood data is slowly changing for the better.
Anglia Advisors clients are welcome to reach out to me to discuss market conditions further.
THIS WEEK’S UPCOMING CALENDAR ..
Strap in. It’s Fed-week again, with an interest rate decision due on Wednesday as well as dozens of Q2 earnings reports scattered throughout the week and the release of a big inflation number. There will also be data on consumer confidence and a new Q2 Gross Domestic Product (GDP) estimate.
The Federal Open Market Committee will convene on Tuesday and Wednesday, with a monetary-policy/interest rate decision and a press conference with Fed chair Jerome Powell due on Wednesday afternoon. Futures markets are pricing in overwhelming odds of another quarter point increase in the federal funds interest rate, to the 5.25%-5.50% range.
More than 150 S&P 500 companies are scheduled to report this week, including Microsoft, Alphabet/Google, Meta/Facebook, Exxon-Mobil, Chevron, Procter & Gamble, Intel, General Motors, Ford Motors, Visa, General Electric, Verizon, T-Mobile US, eBay, Southwest Airlines, Chipotle, Comcast, American Tower, Waste Management and Dominos Pizza.
Economic data out this week will include the Core Personal Consumption Expenditures (Core PCE) price index for June on Friday (too late to affect the Fed’s deliberations on Tuesday and Wednesday). As far as the Fed is concerned, this is the true measure of inflation and will help inform their future interest rate decisions. It is forecast to be up 4.2% from a year earlier, a deceleration of 0.4 points compared with May.
We will also be presented with the latest Consumer Confidence Survey and the second advance estimate for the growth of US GDP for Q2 2023.
LAST WEEK BY THE NUMBERS ..
Last week’s market color courtesy of finviz.com

Last week’s best performing US sector: Healthcare (two biggest holdings: United Healthcare, Johnson & Johnson) - up 3.9% for the week.
Last week’s worst performing US sector: Consumer Cyclical (two biggest holdings: Amazon, Tesla) - down 2.7% for the week.
The proprietary Lowry's measure for US Market Buying Power is currently at 162 and rose by 1 point last week and that of US Market Selling Pressure is now at 120 and fell by 5 points over the course of the week.
SPY, the S&P 500 Large Cap ETF, is made up of the stocks of the 500 largest US companies. It remains above its 50-day and 90-day moving averages and above its long term trend line, with a RSI of 68***. SPY ended the week 5.3% below its all-time high (01/03/2022).
IWM, the Russell 2000 Small Cap ETF, is made up of the bottom two-thirds in terms of company size of the group of the 3,000 largest US stocks. It remains above its 50-day and 90-day moving averages and above its long term trend line, with a RSI of 63***. IWM ended the week 19.8% below its all-time high (11/05/2021).
*** RSI (Relative Strength Index) above 70: technically overbought, RSI below 30: technically oversold
The VIX, the commonly-accepted measure of expected upcoming stock market risk and volatility (often referred to as the “fear index”) implied by S&P 500 index option trading, ended the week 0.3 points higher at 13.6. It remains below its 50-day and 90-day moving averages and below its long term trend line.
AVERAGE 30-YEAR FIXED RATE MORTGAGE ..
6.78%
(one week ago: 6.96%, one month ago: 6.39%, one year ago: 5.54%)
Data courtesy of: FRED Economic Data, St. Louis Fed as of Thursday of last week.
FEAR & GREED INDEX ..
“Be fearful when others are greedy and be greedy when others are fearful.” Warren Buffet.
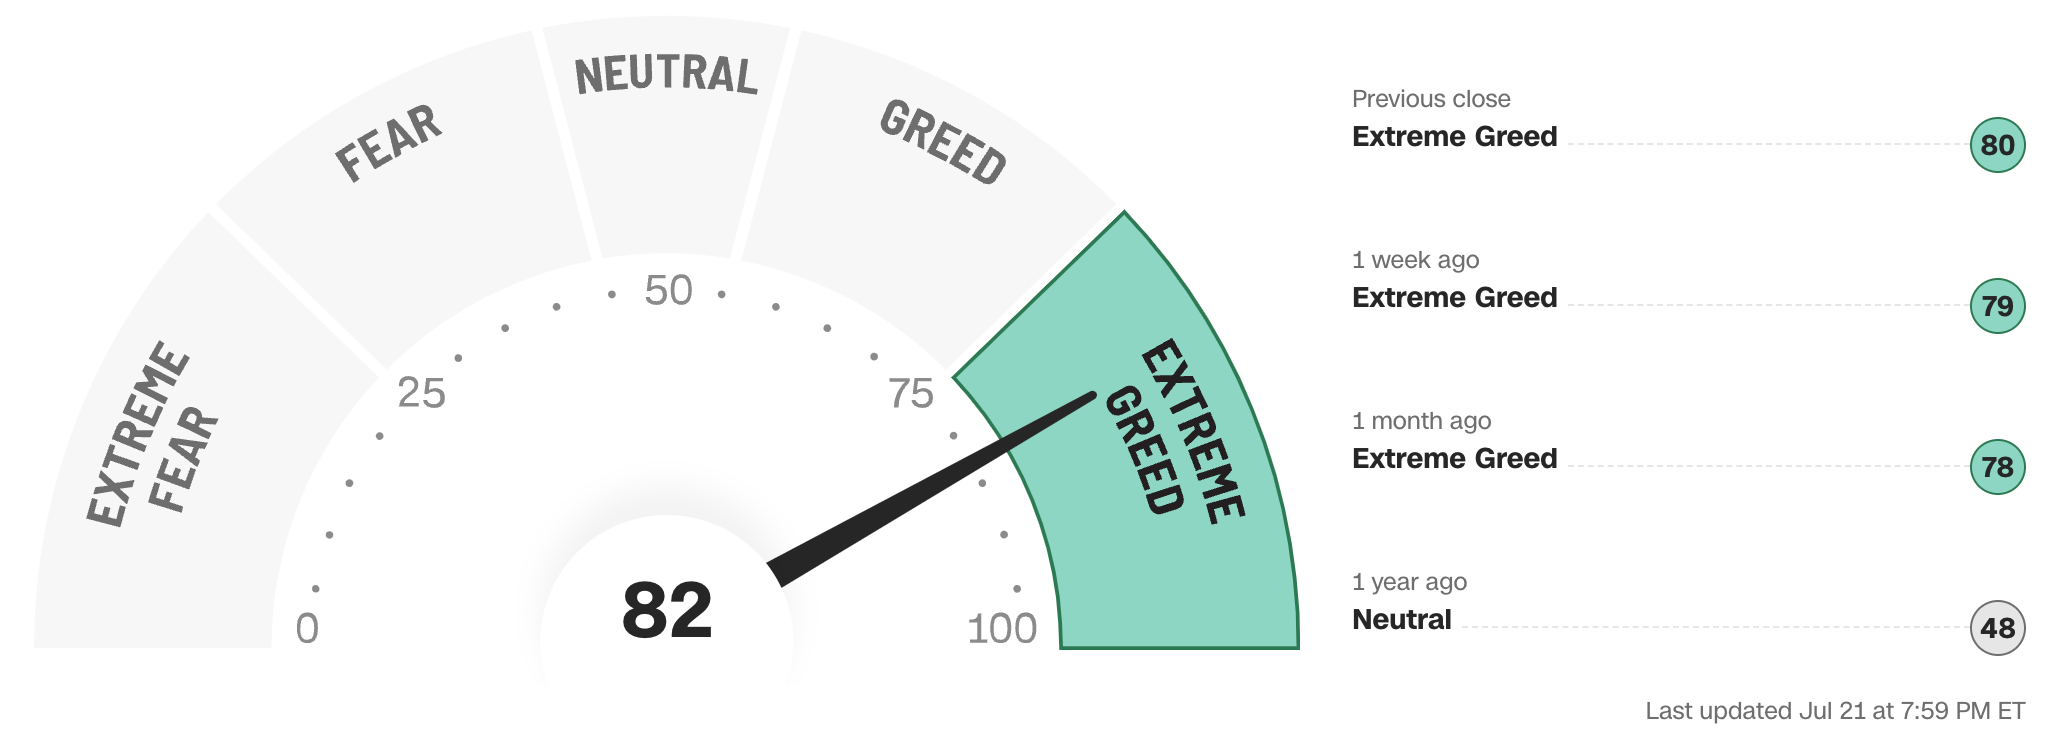
The Fear & Greed Index from CNN Business can be used as an attempt to gauge whether or not stocks are fairly priced and to determine the mood of the market. It is a compilation of seven different indicators that measure some aspect of stock market behavior. They are market momentum, stock price strength, stock price breadth, put and call options, junk bond demand, market volatility and safe haven demand.
Extreme Fear readings can lead to potential opportunities as investors may have driven prices “too low” from a possibly excessive risk-off negative sentiment.
Extreme Greed readings can be associated with a sense of “FOMO” and investors chasing rallies in an excessively risk-on environment, possibly leaving the market vulnerable to a sharp downward correction at some point.
Data courtesy of CNN Business.
US INVESTOR SENTIMENT (outlook for the upcoming 6 months) ..
↑Bullish: 51% (41% a week ago)
⬌ Neutral: 27% (23% a week ago)
↓Bearish: 22% (36% a week ago)
Net Bull-Bear spread: ↑Bullish by 29 (Bullish by 5 a week ago)
For context: Long term averages: Bullish: 38% — Neutral: 32% — Bearish: 30% — Net Bull-Bear spread: Bullish by 8
Weekly sentiment survey participants are usually polled on Tuesdays and/or Wednesdays.
Data courtesy of: American Association of Individual Investors (AAII).
FEDWATCH INTEREST RATE PREDICTION TOOL ..
What are the latest market expectations for what the Fed will announce re: interest rate changes (Fed Funds rate, currently 5.125%) on July 26th after its next meeting?
⬌ No change .. 1% probability
(one week ago: 7%, one month ago: 26%)
↑ 0.25% increase .. 99% probability
(one week ago: 93%, one month ago: 74%)
Where will interest rates (Fed Funds rate, currently 5.125%) be at the end of 2023?
↓ Lower than now .. 0% probability
(one week ago: 2%, one month ago: 6%)
⬌ Unchanged from now .. 9% probability
(one week ago: 28%, one month ago: 34%)
↑ Higher than now .. 91% probability
(one week ago: 70%, one month ago: 60%)
Data courtesy of CME FedWatch Tool. Calculated from Federal Funds futures prices as of Friday.
US TREASURY INTEREST RATE YIELD CURVE ..

The interest rate yield curve remains “inverted” (i.e. shorter term interest rates are generally higher than longer term ones) with the highest rate (5.54%) being paid currently for the 4-month duration and the lowest rate (3.84%) for the 10-year.
The closely-watched and most commonly-used comparative measure of the spread between the 2-year and the 10-year last week rose from 0.91% to 0.98%, indicating a further steepening of the inversion of the curve during the last week.
Historically, an inverted yield curve has been regarded as a leading indicator of an impending recession, with shorter term risk deemed to be unusually higher than longer term. The steeper the inversion, the greater the deemed risk of recession.
The curve has been inverted since July 2022 based on the 2 year vs. 10 year spread.
Data courtesy of ustreasuryyieldcurve.com as of Friday.
ARTICLE OF THE WEEK ..
A possible solution to a rich person’s problem.
EXPLAINER: FINANCIAL TERM OF THE WEEK ..
A weekly feature using information found on Investopedia to try to help explain Wall Street gobbledygook (may be edited at times for clarity).
A bull trap denotes a reversal that forces market participants on the wrong side of price action to exit positions with unexpected losses.
Bull traps occur when buyers fail to support a rally above a breakout level.
Traders and investors can lower the frequency of bull traps by seeking confirmation following a breakout through technical indicators and/or pattern divergences.
A bull trap is a false signal, referring to a declining trend in a stock, index, or other security that reverses after a convincing rally and breaks a prior support level. The move "traps" traders or investors that acted on the buy signal and generates losses on resulting long positions. A bull trap may also refer to a whipsaw pattern.
A bull trap occurs when a trader or investor buys a security that breaks out above a resistance level—a common technical analysis-based strategy. While many breakouts are followed by strong moves higher, the security may quickly reverse direction. These are known as "bull traps" because traders and investors who bought the breakout are "trapped" in the trade.
Traders and investors can avoid bull traps by looking for confirmations following a breakout. For example, a trader may look for higher than average volume following a breakout to confirm that price is likely to move higher. A breakout that generates low volume could be a sign of a bull trap.
From a psychological standpoint, bull traps occur when bulls fail to support a rally above a breakout level, which could be due to a lack of momentum and/or profit-taking. Bears may jump on the opportunity to sell the security if they see divergences, dropping prices below resistance levels, which can then trigger stop-loss orders.
WWW.ANGLIAADVISORS.COM | SIMON@ANGLIAADVISORS.COM | CALL OR TEXT: (929) 677 6774 | FOLLOW ANGLIA ADVISORS ON INSTAGRAM
This material represents a highly opinionated assessment of the financial market environment based on assumptions and prevailing data at a specific point in time and is always subject to change at any time. No warranty of its accuracy or completeness is given. It is never to be interpreted as an attempt to forecast any future events, nor does it offer any kind of guarantee of any future results, circumstances or outcomes.
The material contained herein is not necessarily complete and is wholly insufficient to be exclusively relied upon as research or investment advice or as a sole basis for any investment or other financial decisions. The user assumes the entire risk of any decisions made or actions taken based in whole or in part on any of the information provided in this or any Anglia Advisors communication of any kind. Under no circumstances is any of Anglia Advisors’ content ever intended to constitute tax, legal or medical advice and should never be taken as such. Neither the information contained or any opinion expressed herein constitutes a solicitation for the purchase of any security or asset class.
Posts may contain links or references to third party websites or may post data or graphics from them for the convenience and interest of readers. While Anglia Advisors may have reason to believe in the quality of the content provided on these sites, the firm has no control over, and is not in any way responsible for, the accuracy of such content nor for the security or privacy protocols that external sites may or may not employ. By making use of such links, the user assumes, in its entirety, any kind of risk associated with accessing them or making use of any information provided therein.
Clients of, and those associated with, Anglia Advisors may maintain positions in securities and asset classes mentioned in this post.

If you enjoyed this post, why not share it with someone or encourage them to subscribe themselves?


