


It was a quiet week, so let’s take the opportunity to zoom out a bit, look at the bigger picture and see where we stand in the ongoing saga of this bear market ..
There wasn’t too much to take from a choppy, vacation-shortened week with increasingly thin attendance and extremely low volume (see EXPLAINER: FINANCIAL TERM OF THE WEEK as well as UNDER THE HOOD below) ahead of and right after the Thanksgiving holiday.
We got the minutes from the last Fed meeting earlier this month which raised interest rates by 0.75% and they clearly showed that a substantial majority of those present judged that a slowing in the pace of rate increases “would likely soon be appropriate” and it was noted that some participants expressed concerns about the potential negative impacts on the financial system if the Fed continued to pursue its aggressive rate-hiking policy at the current high-octane pace.
This appeared to confirm the momentum that seems to be building among investors that the Fed will indeed slow the pace of tightening as soon as at its next meeting in early December and is now not far from its terminal rate (the Fed Funds rate on the day that they announce the end to interest rate increases).
We also saw some strong quarterly earnings reports from retailers. Best Buy (BBY) posted solid Q3 results and raised its 2022 final sales projection. Dick’s Sporting Goods (DKS), Abercrombie & Fitch (ANF) and American Eagle Outfitters (AEO) also gave upbeat outlooks.
What the market needs to see is slowing but not collapsing economic growth and a tangible downward shift in inflation and that is a nice segue to a quick review of our ongoing Three Keys To A Market Bottom.
Key #1: Inflation clearly peaks and then declines and the Fed openly pulls back from its current hawkish stance. This is by far the most important key of all when it comes to finding a bottom to this bear market. If inflation can get back down into the 3%-5% area, that will probably make the Fed back off the hawkish rhetoric, likely resulting in a sustainable bottom in stocks. Based on the most recent data, inflation does now appear to have peaked in the US and that obviously needed to happen before we can hope for progress on the remaining two fronts (meaningfully declining inflation and peak Fed hawkishness) although neither of those appear that imminent. Where are we now? A step in the right direction, but a lot further to go.
Key #2: Chinese lockdowns ease and growth resumes. Over the past few weeks Chinese officials have signaled there will be substantive changes to COVID policies, including more targeted lockdowns that don’t paralyze entire cities, shorter quarantine times for international travelers and the importation of proper COVID vaccines, among others. While we are not expecting to hear an explicit declaration that China will abandon its Zero-COVID policy, a process of moving away from that policy has clearly begun. It will, however, take a good amount of time for the Chinese economy to return to a pre-COVID normal. Where are we now? Notwithstanding some reported outbreaks and sporadic lockdowns last week, movement towards this goal is definitely under way.
Key #3: Geopolitical tensions decline. Positively, global commodity prices have fallen - but these declines haven’t been the result of reduced geopolitical tensions. Instead, it’s been the result of the commodities markets pricing in the rising chances of a global recession. Regarding geopolitics, we have seen some progress over the past month, in spite of the Poland rocket story. “Diplomatic chatter” about working to find a ceasefire has definitively increased over the past weeks, with Russian, Ukrainian and US officials all making guardedly positive comments about potential talks, which is noticeable improvement over the situation a while back, when there appeared to be no chance that would materialize. Where are we now? More hopeful than for a very long time, although it should be emphasized that nothing has actually happened yet.
The overall macro takeaway from these Three Keys is net positive in terms of the direction in which things are going but less so, perhaps, when it comes to the pace of progress. There’s still an awful lot of work to do, but the last time we took a hard look at these keys in late summer/early fall, the outlook was far more dismal on all fronts.
There’s still an ongoing drumbeat of other factors in the background, of course. Not least the ongoing and increasingly jaw-dropping story of the collapse of the FTX crypto exchange.
Last week we learned from FTX’s own lawyer that a “substantial amount” of the company’s assets is “missing”, very possibly stolen. He said that FTX had been under the control of “inexperienced and unsophisticated individuals, some or all of whom were compromised individuals” - clearly pointing the finger squarely at Sam Bankman-Fried, the former man-crush of crypto bros everywhere, now cowering in his luxury apartment in the Bahamas awaiting the inevitable and long overdue knock on the door from the authorities. The trademark scruffy t-shirts and ripped jeans could well be replaced soon by an orange jump suit.
Venture capital firm Sequoia Capital came out and apologized to investors for its $150 million loss on FTX and vowed to “improve its due diligence” before making such risky investments in the future. Now there’s a revolutionary idea!
As the terrific Jason Zweig of the Wall Street Journal put it;
“In good times, when markets are booming, taking stupid risks doesn't stop you from getting rich quick; if anything, it can even help. But if you want to get rich slowly and stay rich reliably, you have to learn to avoid taking stupid risks.
That's what down markets are for. They don't just separate people from their money. They also separate people into those who learn from mistakes and those who don't.”
OTHER NEWS
US retirement balances lower .. A study from Fidelity found the average 401(k) balance fell to $97,200 in Q3, down 6% from the prior quarter and 23% lower than a year ago. The average 403b balance was 6% lower than it was at the end of June and 21% lower year-over-year. The average IRA balance was $101,900, an 8% drop from Q2 and a 25% decline from 2021.
Now investors are pulling out of the housing market as well.. Investor buying of homes crashed by 30% in Q3, a sign that the toxic combination of the rise in interest rates and high home prices that pushed traditional buyers to the sidelines are causing these investment firms to pull back, too. Companies bought around 66k homes in 40 tracked markets during Q3, compared with 94k homes during the same quarter a year ago. This is the largest quarterly decline in investor purchases since the sub-prime crisis of 2007/2008, other the freak second quarter of 2020 when the pandemic shut down most home buying.
Just a few months ago, these firms were buying homes in record numbers, helping to supercharge the housing market. Now, investors are reducing their buying activity in line with the decline in overall home sales.
Recession in earnings? Not so much .. Company executives may be talking about recession risks a lot these days. But if you look at what they're actually doing, things look a little different. The nation's biggest firms reported record capital expenditure (investments in buildings, new machinery or technology).
But company borrowing has slowed on the back of higher interest rates, which suggests that while companies continue to invest at a brisk pace, they might not be borrowing as much to do so. Rather, they are relying on booming profits built up in recent years.
So while whether or not the economy will fall into recession at some point may remain up for debate, there is clearly no recession right now in company earnings. Cash flow levels are very healthy.
UNDER THE HOOD:
We are now witnessing a significant divergence between the macro-economic and conventional messaging (see above) and the under the hood market technicals. Usually these may differ in degree, but generally they will point in approximately the same direction. Not so right now since, while the end to the pain at least appears in sight when viewed through the the macro lens as described above, the technicals are rather unambiguous; the downtrend remains very much undisturbed.
The S&P 500 did finally break above near-term resistance at 4,007 on Wednesday leaving the short term path of least resistance higher as we closed out the shortened holiday trading week. However, we are starting to move into short term overbought territory. Additionally, trading volume was minimal, indeed Friday was the lowest trading volume day since December 26th, 2019, so we should probably not really read too much into what happens in this kind of environment.
The current rally is now about four weeks old and responsible for about a 13% rise in the S&P 500. This is similar in both duration and effect to the June/July one. When you side-by-side these these two comparable rallies from a technical standpoint in terms of Buying Power vs Selling Pressure and market breadth and intensity, the current advance is very much only the silver medallist.
It’s probably worth at least bearing in mind that the technically superior rally in the summer fizzled out completely and we were at new lows again within a couple of months.
Anglia Advisors clients are welcome to reach out to me to discuss market conditions further.
THIS WEEK’S UPCOMING CALENDAR ..
Well-rested from a holiday-shortened week filled with turkey and stuffing, investors will get a new portion of earnings reports and economic indicators to digest this week.
Salesforce, Intuit, United Health, Crowdstrike, Hewlett Packard, Intuit, Kroger, Dollar General, Synopsis, Marvell Technology and Ulta Beauty report Q3 results this week.
The National Home Prices Index for September will come out on Tuesday and is expected to show a continued meaningful slowdown in the rate of increase in home prices.
This week, we will also see the latest Consumer Confidence Index and Personal Income and Expenditure data.
The biggest releases, however will be on the jobs front. First of all the Job Openings and Labor Turnover Survey (JOLTS) on Wednesday and then the latest Jobs Report on Friday, which is expected to show another 220k jobs were created in November and an unchanged unemployment rate of 3.7%.
US INVESTOR SENTIMENT LAST WEEK (outlook for the upcoming 6 months):
↑Bullish: 29% (down from 34% the previous week)
→Neutral: 31% (up from 26% the previous week)
↓Bearish: 40% (unchanged from 40% the previous week)
Net Bull-Bear spread .. ↓Bearish by 11 (Bearish by 8 the previous week)
Source: American Association of Individual Investors (AAII).
For context: Long term averages: Bullish: 38% — Neutral: 32% — Bearish: 30% — Net Bull-Bear spread: Bullish by 8
The highest recorded percentage of AAII bearish sentiment was 70% and occurred on March 5th 2009, right near the end of the Great Financial Crisis. The lowest percentage of AAII bears was recorded at 6% on August 21st 1987, not long before the stock market crash of October 1987.
Weekly sentiment survey participants are usually polled on Tuesdays or Wednesdays.
LAST WEEK BY THE NUMBERS:
Last week’s market color from finviz.com:
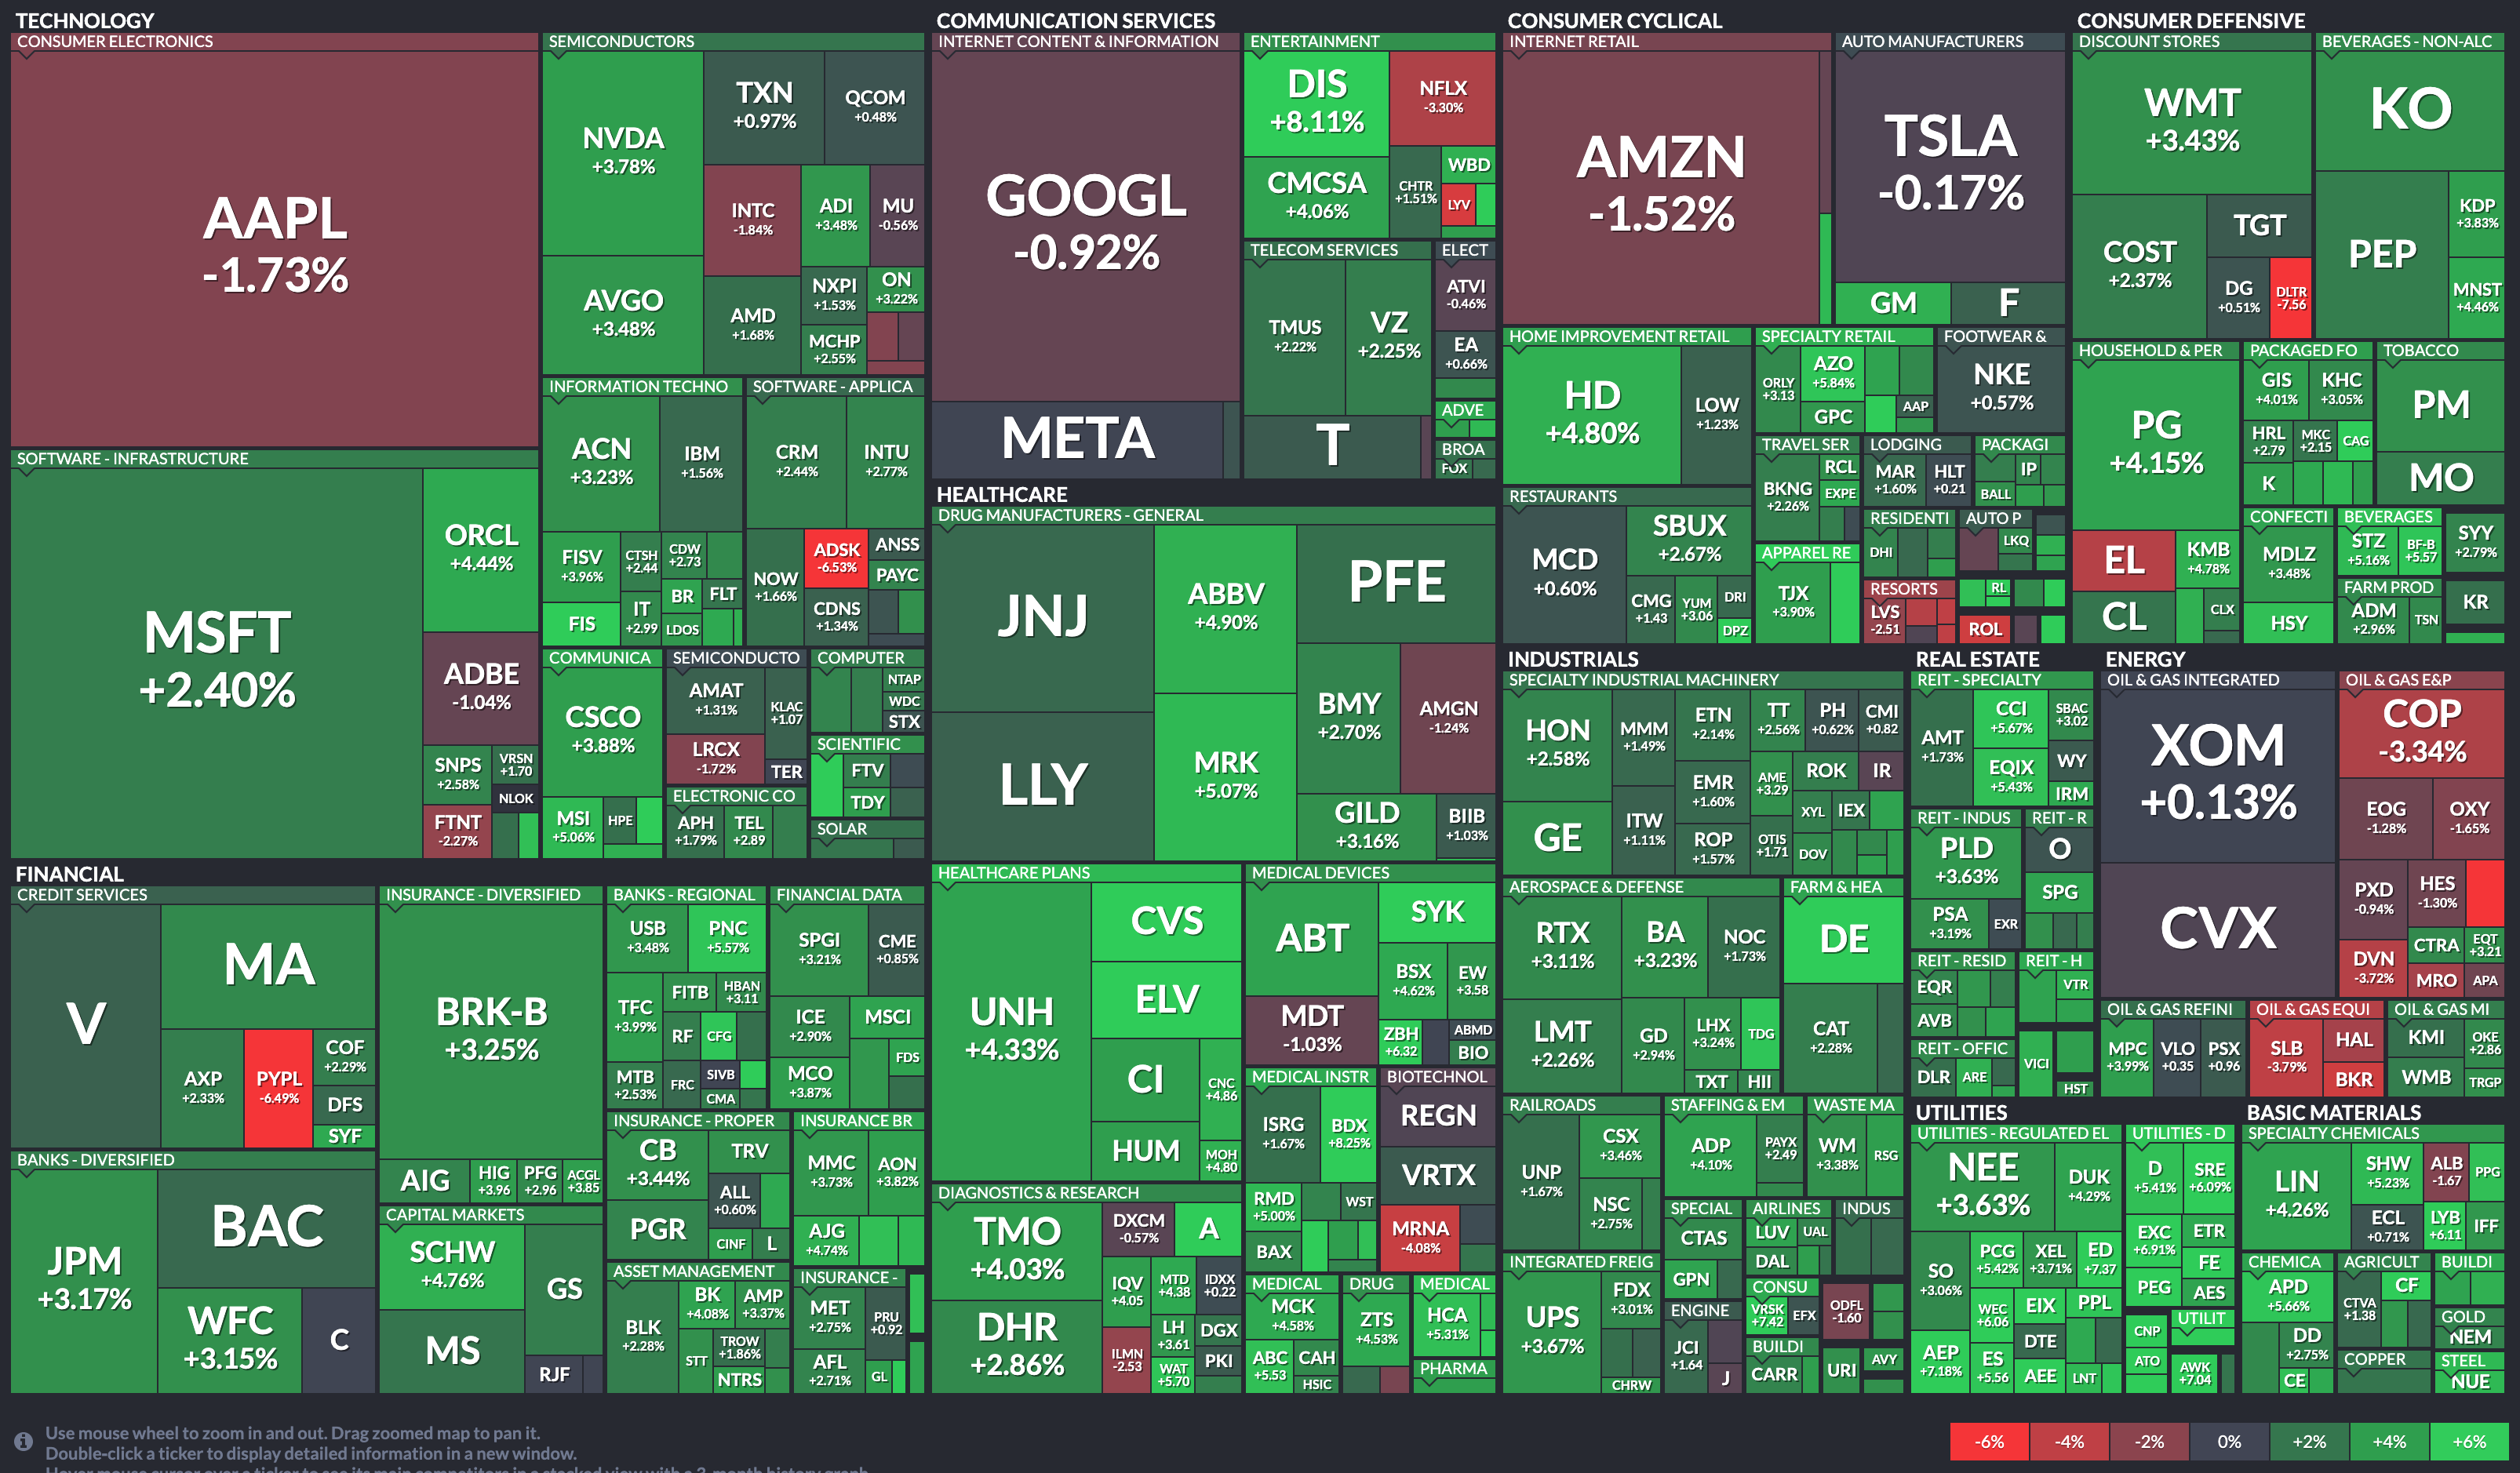
- Last week’s best performing US sector: Utilities (two biggest holdings: NextEra Energy, Duke Energy) - up 3.6%
- Last week’s worst performing US sector: Technology (two biggest holdings: Apple, Microsoft) - up 1.0%
- The S&P 500 again outperformed the NASDAQ-100
- International Developed Markets outperformed US Markets with Emerging Markets bringing up the rear
- Mid Caps were last week’s winners, beating out Large Caps with Small Caps coming in last
- Value stocks beat out Growth stocks
- The proprietary Lowry's measure for US Market Buying Power is currently at 162 and rose by by 2 points last week and that of US Market Selling Pressure is now at 160 and fell by 12 points over the course of the week.
- SPY, the S&P 500 ETF, remains above its 50-day and 90-day moving averages and but still a little below its long term trend line. The 14-day Relative Strength Index (RSI) reading is 62**. SPY ended the week 15.8% below its all-time high (01/03/2022).
- QQQ, the NASDAQ-100 ETF, is now above its 50-day moving average and sitting just a touch above its 90-day. It is still well below its long term trend line. The 14-day Relative Strength Index (RSI) reading is 57**. QQQ ended the week 28.9% below its all-time high (11/19/2021).
** RSI readings range from 0-100. Readings below 30 tend to indicate an over-sold condition, possibly primed for a technical rebound and above 70 are often considered over-bought, possibly primed for a technical decline.
- VIX, the commonly-accepted measure of anticipated upcoming stock market risk and volatility implied by S&P 500 index option trading (often referred to as the“fear index”) ended the week lower at 20.5. It remains well below its 50-day and 90-day moving averages. It also remains well below its long term trend line.
ARTICLE OF THE WEEK: The enormous under-performance (not to mention excessive fees) of actively managed funds that use a human decision-making process (i.e. a fund manager and a bunch of analysts) should hopefully be common knowledge to everyone by now.
But in case there are any olden-timey people out there who still think that hiring a stock-picking human fund manager adds anything but pain to your portfolio over the long term, this underperformance has been irrefutably proven by 20 years of data.
EXPLAINER: FINANCIAL TERM OF THE WEEK:
A weekly feature using information found on Investopedia to try to help explain Wall Street gobbledygook (may be edited at times for clarity) .
Trading volume is the total number of shares of a security that were traded during a given period of time. Trading volume is a technical indicator because it represents the overall activity of a security or a market. Investors often use trading volume to confirm the existence or continuation of a trend, or a trend reversal. Essentially, trading volume can legitimize a security's price action, which can then aid an investor in their decision to either buy or sell that security.
Trading volume can help an investor identify momentum in a security like a market exchange traded fund (ETF) and confirm a trend. If trading volume increases, prices generally move in the same direction. That is, if a security is continuing higher in an uptrend, the volume of the security should also increase and vice versa.
For example, suppose ABC stock/ETF increased in price by 10% over the past month. An investor is interested and wants to purchase 1,000 shares. However, the investor is not confident the price will continue in this uptrend and is worried that the trend may reverse.
In this example, trading volume analysis can be very useful. The investor sees that there was a steady increase in ABC's trading volume over the past month. They also notice that the trading volume was the highest that ABC had experienced over the past two years, and that the price is continuing to trend higher. This signals to the investor that ABC is gaining momentum and gives them more confidence that the trend may continue higher.
Trading volume can also signal when an investor should take profits and sell a security due to low activity. If there is no relationship between the trading volume and the price of a security, this signals weakness in the current trend and a possible reversal.
For example, suppose ABC extended its uptrend for another five months and increased by 70% in six months. The investor sees that share price of ABC is still in an uptrend and continues to hold on to the shares. However, the trading volume is decreasing. This could signal to the investor that the bullish uptrend in ABC is beginning to lose momentum and may soon end.
The following week, the share price of ABC decreases by 10% in one trading session after being in an uptrend for six months. This results in the stock breaking its upward trend. More significantly, the trading volume spikes higher when compared to its average daily trading volume (ADTV). The investor might sell out of all the shares of ABC the next day because the combination of a sharp drop in price and spike in trading volume confirmed that the uptrend might be coming to an end and a reversal might be in the offing.
“Good trading volume” for a security is hard to define because trading volume's value comes into play when looked at in context with other indicators, such as price direction and volatility. Any level of volume that provides investors with specific insight into a security's price action (and a sense of the trading interest in that security) can be thought of as a good trading volume.
“High trading volume” (relative to past measures of that volume) that accompanies rising prices or an upward trend can signal strong interest in a security by buyers. On the other hand, high trading volume that accompanies dropping prices or a downward trend can signal worry on the part of investors. This can result in more selling and even lower prices. High trading volume could also reflect some isolated news or event related to the company associated with the stock.
Low volume, is it a good or bad thing? It depends. Trading volume is defined as the number of shares traded in a particular period of time. So, low trading volume can indicate a lack of interest in either buying or selling. That means it could be bullish if low volume occurs in a downtrend. It could be bearish if it's noted in an uptrend.
WWW.ANGLIAADVISORS.COM | SIMON@ANGLIAADVISORS.COM | CALL OR TEXT: (929) 677 6774 | FOLLOW ANGLIA ADVISORS ON INSTAGRAM
This material represents an opinionated assessment of the financial market environment based on assumptions and prevailing data at a specific point in time and is always subject to change at any time. No warranty of its accuracy is given. It is not intended to act as a forecast of future events, nor does it constitute any kind of a guarantee of any future results, events or outcomes.
The material contained herein is at no time ever intended to constitute tax, legal or medical advice. It is also wholly insufficient to be exclusively relied upon as research or investment advice or as a sole basis for any investment decisions. The user assumes the entire risk of any actions taken based on the information provided in this or any other Anglia Advisors post.
Posts may contain links or references to third party websites for the convenience and interest of readers. While Anglia Advisors may have reason to believe in the quality of the content provided on these sites, the firm has no control over, and is not in any way responsible for, the accuracy of such content nor for the security or privacy protocols the sites may or may not employ. By making use of such links, the user assumes, in its entirety, any kind of risk associated with accessing them and making any use of the information provided therein.
Clients of Anglia Advisors may maintain positions in securities and asset classes mentioned in this post.

If you enjoyed this post, why not share it with someone or encourage them to subscribe themselves?


