


It was another pretty brutal week for stocks. Last week, the S&P 500 and the NASDAQ indexes both dropped by more than 2% and officially joined the Russell 2000 Small Cap Index by falling below their long term moving averages and into correction territory (defined as down 10% or more from a recent high) and a third straight calendar month of stock price declines is on the cards. The solid 4200-4500 range for the S&P 500 that had been in place since early summer has now broken to the downside, the index closed on Friday at 4117.
A perceived lack of political progress over the weekend overseas in the Middle East and domestically in Washington DC saw markets open on Monday in a depressed mood. The 10-year Treasury interest rate retreating a bit from a 16-year high of over 5% and oil prices ticking lower created a few twists and turns along the way but the S&P 500 still finished the day at its lowest level since May.
Tuesday was a much better day as investors began to get enthusiastic about the possibility of imminent blow-out big tech earnings and treasury yields stabilized - all of which helped prices move higher, particularly for the tech-heavy NASDAQ. After hours, Alphabet/Google disappointed but Microsoft beat expectations.
The Alphabet/Google earnings report, particularly the lower-than-expected revenue from its cloud business, continued to trouble markets on Wednesday, meaningfully dragging down all the indexes, but particularly the NASDAQ which had its worst day of 2023 so far and saw the impressive gains of the day before disappear instantly in a puff of smoke.
Wednesday was also the day that House Republicans finally agreed on the choice of a stolen 2020 election conspiracy theorist, January 6th insurrection apologist and a good buddy of “Team Burn It All Down” in Congress, Mike Johnson from Louisiana, as Speaker and second in line to the position of most powerful human being on the planet. The markets’ reaction was; yeah whatever, but now the real work begins - how are you going to avoid the US government being shut down on November 18th? Because right now we seem a million miles away from any resolution.
Before the market opened on Thursday, we learned that U.S. Gross Domestic Product (GDP) growth in Q3 accelerated to an astonishingly-high 4.9% annualized rate, more than double the Q2 pace, according to the latest estimate. More interest rate hikes in December or next year, anyone?
Meta/Facebook reported decent earnings but issued a note of caution on ad spending down the line that sent its shares tumbling and it was another stinker of a day with the nastiest aroma again wafting around tech stocks and the NASDAQ.
Tech rebounded somewhat out of the gate on Friday with positive reports from Amazon and Intel but then, alongside rapidly rising fears of a further expansion of military activity in Gaza along with word that US aircraft are bombing Syria, the latest Core Personal Consumption Expenditures (PCE) inflation reading was released ahead of the Fed interest rate meeting next week. It increased 0.3% in the last month and 3.7% year-over-year and consumer spending increased 0.7%, surpassing estimates of 0.5%. In other words, inflation is not going lower as hoped.
What did we learn last week? Well, the world of geopolitics looks grim, it’s not always entirely sunshine and roses in the Q3 earnings garden, interest rates in general and mortgage rates in particular keep on trucking upwards (see AVERAGE 30-YEAR FIXED RATE MORTGAGE below) and U.S. inflation seems stuck in the mud and is not going anywhere in a hurry.
And while none of these on their own are yet medium/longer term bearish game-changers, the fact that they are all happening at the same time means that no-one wants to seem like the optimist in the room right now. There’s also a nagging feeling that those quite incredible Q3 GDP numbers just can’t be right for some reason and will ultimately be revised down, maybe heavily.
When it comes to earnings, the problem is not that tech earnings have been outright bad. They haven’t been. But it’s an expectation problem. Tech firms are simply not producing the kind of growth that was universally assumed when artificial intelligence mania hit the markets in the spring and so we are seeing those AI-driven gains given back, entirely as you would expect when the strong bounce higher in stocks in May and June was mostly based on such overly optimistic growth assumptions. The relative failure of these assumptions to play out as hyped has become just another obstacle for markets to face going forward, along with the others I just listed.
Remember, though, that bull markets generally die when excitement reaches a fever pitch. When everyone is fully invested in stocks and there's nobody left to buy - that's when things turn properly south. Today, despite this year's double-digit percent rally in stocks, we're not even close to that kind of euphoria. That is the light at the end of the tunnel.
OTHER NEWS ..
Car Trouble .. Americans are falling behind on their car loans at the highest rate on record. The percentage of subprime auto borrowers at least 60 days past due rose to 6.11% in September, the highest level since Elton John asked us all (and a little lion cub) if we could feel the love that night in 1994. This rise in delinquencies is due to higher car prices and borrowing costs stemming from the Federal Reserve's interest-rate hikes. The resumption of student-loan payments and the expectation that higher interest rates will be maintained higher for longer have only exacerbated the worries that delinquencies will persist and grow.
Beware! Private Equity May Be Coming for Your Retirement Money .. It seems private equity firms are coming for your nest egg. Bloomberg reported that, among the roster of banks and brokerages helping private equity investment firm KKR raise money for some of its newest infrastructure investments, there are two names that stand out; Fidelity and Charles Schwab. Both are well-known for serving individuals, not the pension funds and endowments that typically invest in multibillion-dollar private and lightly-regulated investment partnerships such as KKR’s. But those sources of money are drying up.
Individual investors, by contrast, represent a deep reservoir of untapped riches, particularly in IRAs and retirement plans - administered in large part by the Fidelitys and Schwabs of this world.
UNDER THE HOOD ..
Weakness has now spread beyond the level of “a market pullback” that is likely to quickly recover ground. Instead, this level of technical damage apparent in key indicators is usually only resolved through the exhaustion of sellers, evidence of which is scarce right now.
As we can see from the new data point I will now be including in my weekly reports, the rapidly contracting PERCENT OF S&P 500 STOCKS TRADING ABOVE THEIR LONG TERM MOVING AVERAGE (LTMA, see below) and also the rapidly expanding Percent of Stocks Down More Than 20% From Their One Year Highs (whose 50%+ reading reveals that more than half of all U.S. stocks are now in classically-defined bear markets), conditions are becoming materially worse.
As in physics, market trends tend to persist until acted upon by an outside force. That force is Demand, and it has not yet made its return. Therefore, the overall market outlook remains technically troubled, although a possible short term oversold bounce next week cannot be ruled out.
Anglia Advisors clients are welcome to reach out to me to discuss market conditions further.
THIS WEEK’S UPCOMING CALENDAR ..
A big week ahead.
Around 150 S&P 500 companies are scheduled to report earnings, including Apple, McDonalds, Conoco Phillips, Pfizer, Eli Lilly, Moderna, CVS, Caterpillar, AMD, Airbnb, Qualcom, Novo Nordisk, PayPal, Starbucks, Kraft Heinz, Anheuser-Busch, Simon Property Group, Dominion Energy, YUM Brands, DoorDash, Electronic Arts, and CBOE.
But the highlight of the week comes on Wednesday, when the Federal Reserve’s Open Market Committee concludes its latest two-day meeting. An interest rate decision is due at 2pm ET and Fed chairman Jerome Powell will hold a press conference half an hour later. While almost no-one expects a rate increase this time around (see FEDWATCH INTEREST RATE PREDICTION TOOL below), Powell’s words will be carefully scrutinized for clues about any future interest rate plans.
Economists and investors will also be closely watching next week's labor-market numbers. On Wednesday, we get the Job Openings and Labor Turnover Survey (JOLTS) for September. Then on Friday, we get the Jobs Report for October. Forecasts are for no change in the unemployment rate, currently at 3.8%.
ARTICLE OF THE WEEK ..
What does history tell us about investing at times of geopolitical turmoil?
LAST WEEK BY THE NUMBERS ..
Last week’s market color courtesy of finviz.com
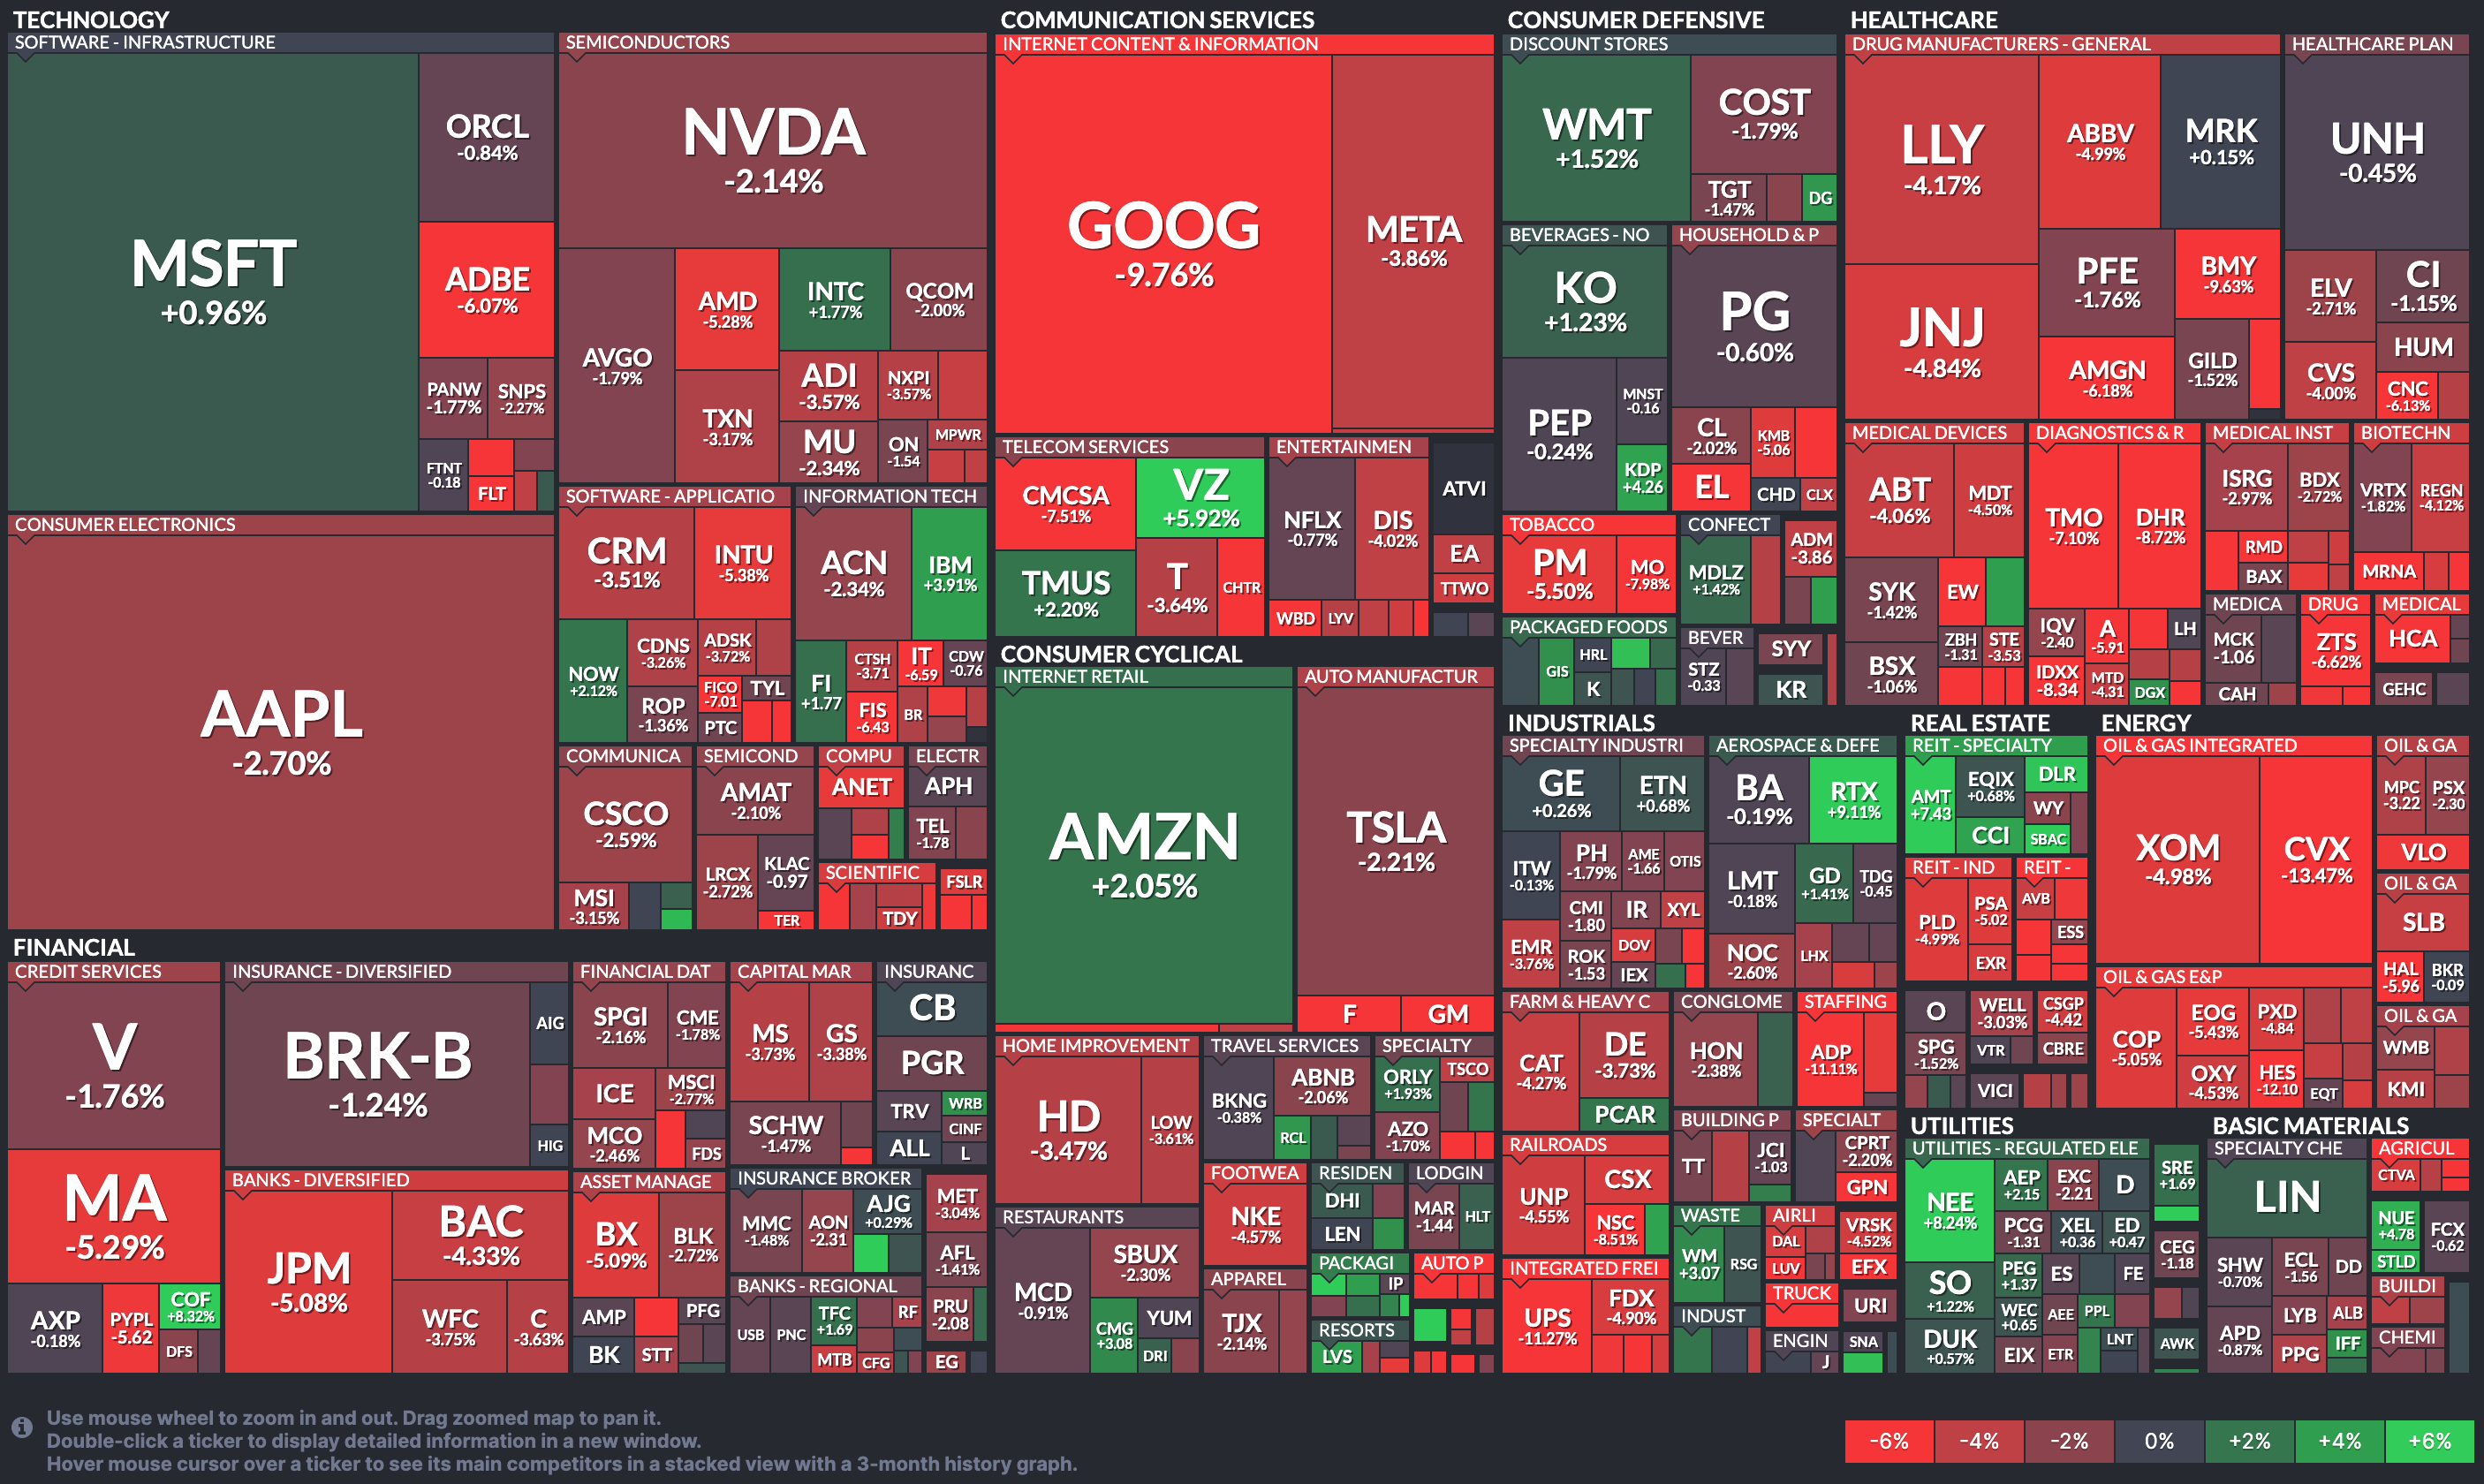
Last week’s best performing US sector: Utilities (two biggest holdings: NextEra Energy, Southern Co.) - up 2.1% for the week.
Last week’s worst performing US sector: Communication Services (two biggest holdings: Alphabet/Google, Meta/Facebook) - down 5.7% for the week.
The proprietary Lowry's measure for US stock market Buying Power was unchanged last week at 109 and that of US stock market Selling Pressure rose by 3 points to 166 over the course of the week.
SPY, the S&P 500 Large Cap ETF, is made up of the stocks of the 500 largest US companies. It is below its 50-day and 90-day moving averages and is also below its long term trend line, with a RSI of 29***. SPY ended the week 14.0% below its all-time high (01/03/2022).
IWM, the Russell 2000 Small Cap ETF, is made up of the bottom two-thirds in terms of company size of the group of the 3,000 largest US stocks. It is below its 50-day and 90-day moving averages and is also below its long term trend line, with a RSI of 30***. IWM ended the week 33.1% below its all-time high (11/05/2021).
*** RSI (Relative Strength Index) above 70: technically overbought, RSI below 30: technically oversold
The VIX, the commonly-accepted measure of expected upcoming stock market risk and volatility (often referred to as the “fear index”) implied by S&P 500 index option trading, ended the week 0.4 points lower at 21.3. It is above its 50-day and 90-day moving averages and is also above its long term trend line.
AVERAGE 30-YEAR FIXED RATE MORTGAGE ..
7.79%
One week ago: 7.63%, one month ago: 7.31%, one year ago: 7.08%
Data courtesy of: FRED Economic Data, St. Louis Fed as of Thursday.
FEAR & GREED INDEX ..
“Be fearful when others are greedy and be greedy when others are fearful.” Warren Buffet.

The Fear & Greed Index from CNN Business can be used as an attempt to gauge whether or not stocks are fairly priced and to determine the mood of the market. It is a compilation of seven different indicators that measure some aspect of stock market behavior. They are: market momentum, stock price strength, stock price breadth, put and call options, junk bond demand, market volatility and safe haven demand.
Extreme Fear readings can lead to potential opportunities as investors may have driven prices “too low” from a possibly excessive risk-off negative sentiment.
Extreme Greed readings can be associated with a sense of FOMO and investors chasing rallies in an excessively risk-on environment, possibly leaving the market vulnerable to a sharp downward correction at some point.
Data courtesy of CNN Business as of Friday.
PERCENT OF S&P 500 STOCKS TRADING ABOVE THEIR LONG TERM MOVING AVERAGE (LTMA) ..
24% (out of 500 stocks, 120 are above their LTMA and 380 are below)
One week ago: 35%, one month ago: 39%
A closely-watched measure of market breadth and participation, providing a real-time look at how many stocks within the S&P 500 index of the largest U.S. stocks are trending higher or lower, as defined by whether the stock price is above or below the 200-day moving average which is among the most widely-followed of all stock market technical indicators.
The more a reading is above 50%, the better the deemed health of the overall market and the reverse when below 50%.
Data as of Friday’s market close.
US INVESTOR SENTIMENT (outlook for the upcoming 6 months) ..
↑Bullish: 29% (34% a week ago)
⬌ Neutral: 28% (31% a week ago)
↓Bearish: 43% (35% a week ago)
Net Bull-Bear spread: ↓Bearish by 14 (Bearish by 1 a week ago)
For context: Long term averages: Bullish: 38% — Neutral: 32% — Bearish: 30% — Net Bull-Bear spread: Bullish by 8
Weekly sentiment survey participants are typically polled on Tuesdays and/or Wednesdays.
Data courtesy of: American Association of Individual Investors (AAII).
FEDWATCH INTEREST RATE PREDICTION TOOL ..
What will the Fed announce re: any interest rate change on November 1st after its next meeting?
⬌ No change .. 97% probability
One week ago: 100%, one month ago: 78%
↑ 0.25% increase .. 3% probability
One week ago: 0%, one month ago: 22%
Where will interest rates be at the end of 2023?
⬌ Unchanged from now .. 79% probability
One week ago: 80%, one month ago: 58%
↑ Higher than now .. 21% probability
One week ago: 20%, one month ago: 42%
Data courtesy of CME FedWatch Tool. Based on the Fed Funds rate (currently 5.375%). Calculated from Federal Funds futures prices as of Friday’s market close.
US TREASURY INTEREST RATE YIELD CURVE ..

The interest rate yield curve remains “inverted” (i.e. shorter term interest rates are generally higher than longer term ones) with the highest rate (5.60%) being paid currently for the 4-month duration and the lowest rate (4.76%) for the 5-year.
The closely-watched and most commonly-used comparative measure of the spread between the 2-year and the 10-year rose from 0.14% to 0.15%, indicating a slight steepening in the inversion of the curve during the last week.
Historically, an inverted yield curve has been regarded as a leading indicator of an impending recession, with shorter term risk deemed to be unusually higher than longer term. The steeper the inversion, the greater the deemed risk of recession.
The curve has been inverted since July 2022 based on the 2 year vs. 10 year spread.
Data courtesy of ustreasuryyieldcurve.com as of Friday’s market close.
WWW.ANGLIAADVISORS.COM | SIMON@ANGLIAADVISORS.COM | CALL OR TEXT: (929) 677 6774 | FOLLOW ANGLIA ADVISORS ON INSTAGRAM
This material represents a highly opinionated assessment of the financial market environment based on assumptions and prevailing data at a specific point in time and is always subject to change at any time. No warranty of its accuracy or completeness is given. It is never to be interpreted as an attempt to forecast any future events, nor does it offer any kind of guarantee of any future results, circumstances or outcomes.
The material contained herein is not necessarily complete and is wholly insufficient to be exclusively relied upon as research or investment advice or as a sole basis for any investment or other financial decisions. The user assumes the entire risk of any decisions made or actions taken based in whole or in part on any of the information provided in this or any Anglia Advisors communication of any kind. Under no circumstances is any of Anglia Advisors’ content ever intended to constitute tax, legal or medical advice and should never be taken as such. Neither the information contained or any opinion expressed herein constitutes a solicitation for the purchase of any security or asset class.
Posts may contain links or references to third party websites or may post data or graphics from them for the convenience and interest of readers. While Anglia Advisors may have reason to believe in the quality of the content provided on these sites, the firm has no control over, and is not in any way responsible for, the accuracy of such content nor for the security or privacy protocols that external sites may or may not employ. By making use of such links, the user assumes, in its entirety, any kind of risk associated with accessing them or making use of any information provided therein.
Those associated with Anglia Advisors, including clients with managed or advised investments, may maintain positions in securities and/or asset classes mentioned in this post.

If you enjoyed this post, why not share it with someone or encourage them to subscribe themselves?


