


Stocks had another terrific week, boosted by the interest rate cut-friendly tone of the Federal Reserve and its Chair Jerome Powell on Wednesday. The S&P 500 moved higher for the seventh consecutive week, something it hasn’t done since 2017. The NASDAQ-100 ended the week at a new all-time record high, something that would have seemed unthinkable just a year ago at the end of a catastrophic 2022. The best performing stocks last week, however, were the Small Caps.
Monday saw stocks move higher to further new 2023 highs, with the generic all-encompassing indexes like the S&P 500 following through strongly on the momentum from the end of the previous week on the back of continued hopes for a “bending-but-not-breaking” economy and optimism about the following day’s inflation report. Some profit-taking following recent surges in tech and Small Cap stocks caused the performances of the NASDAQ-100 and the Russell 2K indexes, respectively, to lag somewhat over the course of the session.
Before the opening bell on Tuesday, we learned that the Consumer Price Index (CPI) measure of retail inflation is starting to show a few signs of stickiness, notably in areas such as rent, medical care and car insurance. Consumer prices rose 3.1% year-on-year, with the all-important Core number (which excludes food and energy prices) rising 0.3% in November for a 4.0% annualized rate, unchanged from the previous month’s reading. While this mixed bag did not seriously damage Wall Street’s expectation for early 2024 interest rate cuts, it didn’t exactly support it, either.
With the Fed interest rate decision, Powell’s press conference and the publication of the Dot Plot looming the following day, the market initially seemed reluctant to take a stand one way or another based on the CPI data during Tuesday’s session - but then investors did what they have consistently been doing lately and defaulted to looking on the bright side of things and stocks eventually moved higher again, deeper into record high territory for 2023.
The big day finally arrived on Wednesday. Obviously, there was no change made to interest rates for the third meeting in a row, no surprise there. But both the language from Powell at his press conference and the publication of the Fed’s quarterly Dot Plot were pleasant surprises to those yearning for a swift end to the Fed’s recent restrictive policies.
Powell finally signaled that the cycle of monetary tightening that has whip-sawed markets and the economy for the last couple of years is, to all intents and purposes, over. He notably did not seem to push back on the idea of the death of the “higher for longer” narrative or the hope of multiple interest rate cuts in 2024, indeed he even kind of embraced it.
Traders also cheered the tweak to the Dot Plot, which showed most Fed officials now anticipating a reduction of 0.75% in the Fed Funds rate next year - a much sharper pace of cuts than indicated back in September.
Stocks immediately screamed higher, turbo-charged by a solid fall in Treasury interest rates. Mortgage rates dipped back below 7% (see below). The S&P 500 broke up through 4700 and the NASDAQ-100 extended its incredible 2023 surge to over 50%. Small Cap stocks had an even better day.
On Thursday, US stock markets initially rocketed higher again on a momentum follow-through from Super Wednesday, as it was already becoming known within 24 hours, with Small Caps once again taking the lead. As the day wore on, though, signs emerged of exhaustion and some profit-taking in what was clearly a short-term overbought market and the indexes finished only modestly higher.
The European Central Bank (ECB) and the Bank of England (BOE) followed the Fed’s lead as expected, both holding the line and leaving their interest rates unchanged. The messaging was very different though. If Powell was the U.S. market’s jolly Santa on Wednesday, happy to entertain the idea of rate cuts, ECB President Christine Lagarde and BOE Governor Andrew Bailey were far more Grinch-y in their statements.
Interviewed on CNBC on Friday morning, New York Fed President John Williams tried to pour a little cold water on the inferno of optimism by calling the idea of a March 2024 interest rate cut “premature” and, bizarrely, even seemed to deny some of what Powell had quite clearly said on Wednesday. Strange as it was, William’s statement did succeed in removing some of the froth and the S&P 500’s six-day winning streak finally came to an end as it eased back a fraction. However, the NASDAQ-100 (the index of the largest one hundred NASDAQ-listed stocks, excluding financials) still managed to advance to finish the week at its new all-time record high.
Stock markets are in full-on party mode, with little appearing able to derail a march higher recently. Earnings are growing again. Formerly lagging sectors like real estate and financials are rallying hard, playing solid catchup. Lagging styles and investing disciplines like Small Cap Value and high dividend stocks are rewarding the poor managers who’ve had to sit and watch the Magnificent Seven stocks soak up all the gains and headlines in the first 10 months of the year. Even international stocks are going higher.
Investors right now very firmly believe that 1) growth won’t slow materially and 2) the Fed will cut rates in March or May. In the short term (meaning before year-end) this strong belief is the stock market’s super power because it allows investors to safely ignore anything that contradicts that narrative, as long it doesn’t contradict it too strongly.
Last week’s CPI report is a perfect example. Headline inflation barely declined and Core CPI literally didn’t decline at all and is still running at double the Fed’s target (4.0% vs. 2.0%). Yet, stocks didn’t mind and took off because the report didn’t provide a negative enough surprise to break the current belief in 1) a soft landing and 2) imminent and meaningful interest rate cuts.
However, as we start 2024 with a clean slate and investors will have to start thinking properly again about economics, earnings and elections, the burden of proof will shift to the bulls and the whole concept of “as long as news is not disastrous, then it’s really good” will not cut it any more once the New Year’s celebrations are done. Pivots like the one we just saw only work once. And the Fed just used it.
OTHER NEWS ..
A Busy Week For Elon .. Elon Musk had an interesting week. He started out deservedly copping tons of crap for reaching the astonishing judgment that somehow it would be a really good idea to let appalling conspiracy theorist Alex Jones back onto X/Twitter so he could resume spewing lies and brain-dead toxic nonsense to all his dopey followers. Musk chose to even celebrate this bonkers decision by joining Jones and self-styled hate influencer Andrew Tate (currently under indictment for multiple rapes, assaults and human sex trafficking and also inexplicably reinstated by Musk), on a cuddly “welcome back” audio chat on the platform.
Musk is still desperately trying to repair the damage caused by his own recent burst of ill-timed anti-semitism (including a desperately awkward PR-advised apology tour to Israel) which - along with the fact that their ads on the platform were appearing next to pro-Nazi and white supremacist content - generated a massive boycott from the platform’s biggest advertisers.
His ridiculous antics seem to have finally come to the attention of Apple and the suggestion is that X/Twitter is teetering on the brink of being kicked out of the App Store for multiple rule violations.
Musk’s other play-thing, Tesla, was forced last week to recall more than 2 million vehicles after the National Highway Traffic Safety Administration determined its driver-assistance system Autopilot doesn’t do enough to keep drivers engaged. We also know that surveys are showing that U.S. consumers are simply not very convinced by the electric vehicle use case, given the associated high prices of vehicles and a still lame national charging network.
Revenge Of The Job Seekers .. After suffering constant “ghosting” from prospective employers lacking the courtesy to respond or provide feedback to candidates, 70% of job seekers say they feel it’s completely fair to ghost employers back, according to a survey of 4500 job hunters around the world and over 60% plan to implement an employer-ghosting strategy in their job search. Over 35% of them report receiving no acknowledgement of an appropriately-submitted job application in 2023 while 40% said they were never contacted again even following a second or third round interview. The ghosting rate of candidates is now 2x what it was pre-pandemic, very possibly as a result of the increased use of artificial intelligence or online algorithms being used by employers.
Job seekers are now saying that two can play at that game. Techniques include refusal to respond to emails or meeting requests from employers deemed to be disrespectful, failing to let them know that the candidate has secured another position and continuing to lead them on for a while or in some cases apparently just logging off mid-meeting with no warning during a Zoom interview - which is a lot easier to do than standing up and walking out of the room during an old-school-type interview!
More Flyers Than Ever .. A record 7.5 million people are expected to fly during the Christmas-New Year holiday period, marking the busiest year-end travel season since tracking of the data began in 2000. Road travel is also set to rise.
UNDER THE HOOD ..
Despite the unbridled enthusiasm we saw last week, we cannot forget that no market moves in straight lines and when Demand drives indexes to new highs, there’s often a huge lump of Supply just waiting to pounce.
Last week saw multi-year highs in the readings of the % of stocks within 2%, 5% and 10% of their one year highs. This is very healthy indeed, especially when coupled with the reading for the % of stocks 20% or more below their one year highs falling to its lowest level for a while, indicating a renewed appetite for the most beaten-down names. As shown below, a very solid 72% of S&P 500 stocks are now trading above their long term averages. This is also an encouraging stat, demonstrating strong broad participation and momentum in the rally.
There is definitely evidence that investors are now fishing in the sectors of the market that have lagged (particular sectors and Mid and Small Caps) as they try to add exposure to any part of the market that can be considered good value.
There is no doubt, however, that conditions are short-term overbought and it could well be that we need some kind of a pullback next week in order to set up a next leg higher.
Anglia Advisors clients are welcome to reach out to me to discuss market conditions further.
THIS WEEK’S UPCOMING CALENDAR ..
The Federal Reserve's preferred inflation measure, the Personal Income and Expenditures (PCE) Price Report comes out on Friday. November’s inflation reading is forecast to be 3.3% higher than a year ago, versus 3.5% annualized in October.
Still a few companies left to report Q3 earnings this week, including FedEx, Nike, General Mills. Carnival, Micron and CarMax.
Other economic data out this week will be focused on the U.S. housing market. Releases include the Housing Market Index, Housing Starts, Existing Home Sales and New Home Sales data.
ARTICLE OF THE WEEK ..
The unwritten rules of tipping have changed. And it’s sending lots of people crazy.
LAST WEEK BY THE NUMBERS ..
Last week’s market color courtesy of finviz.com
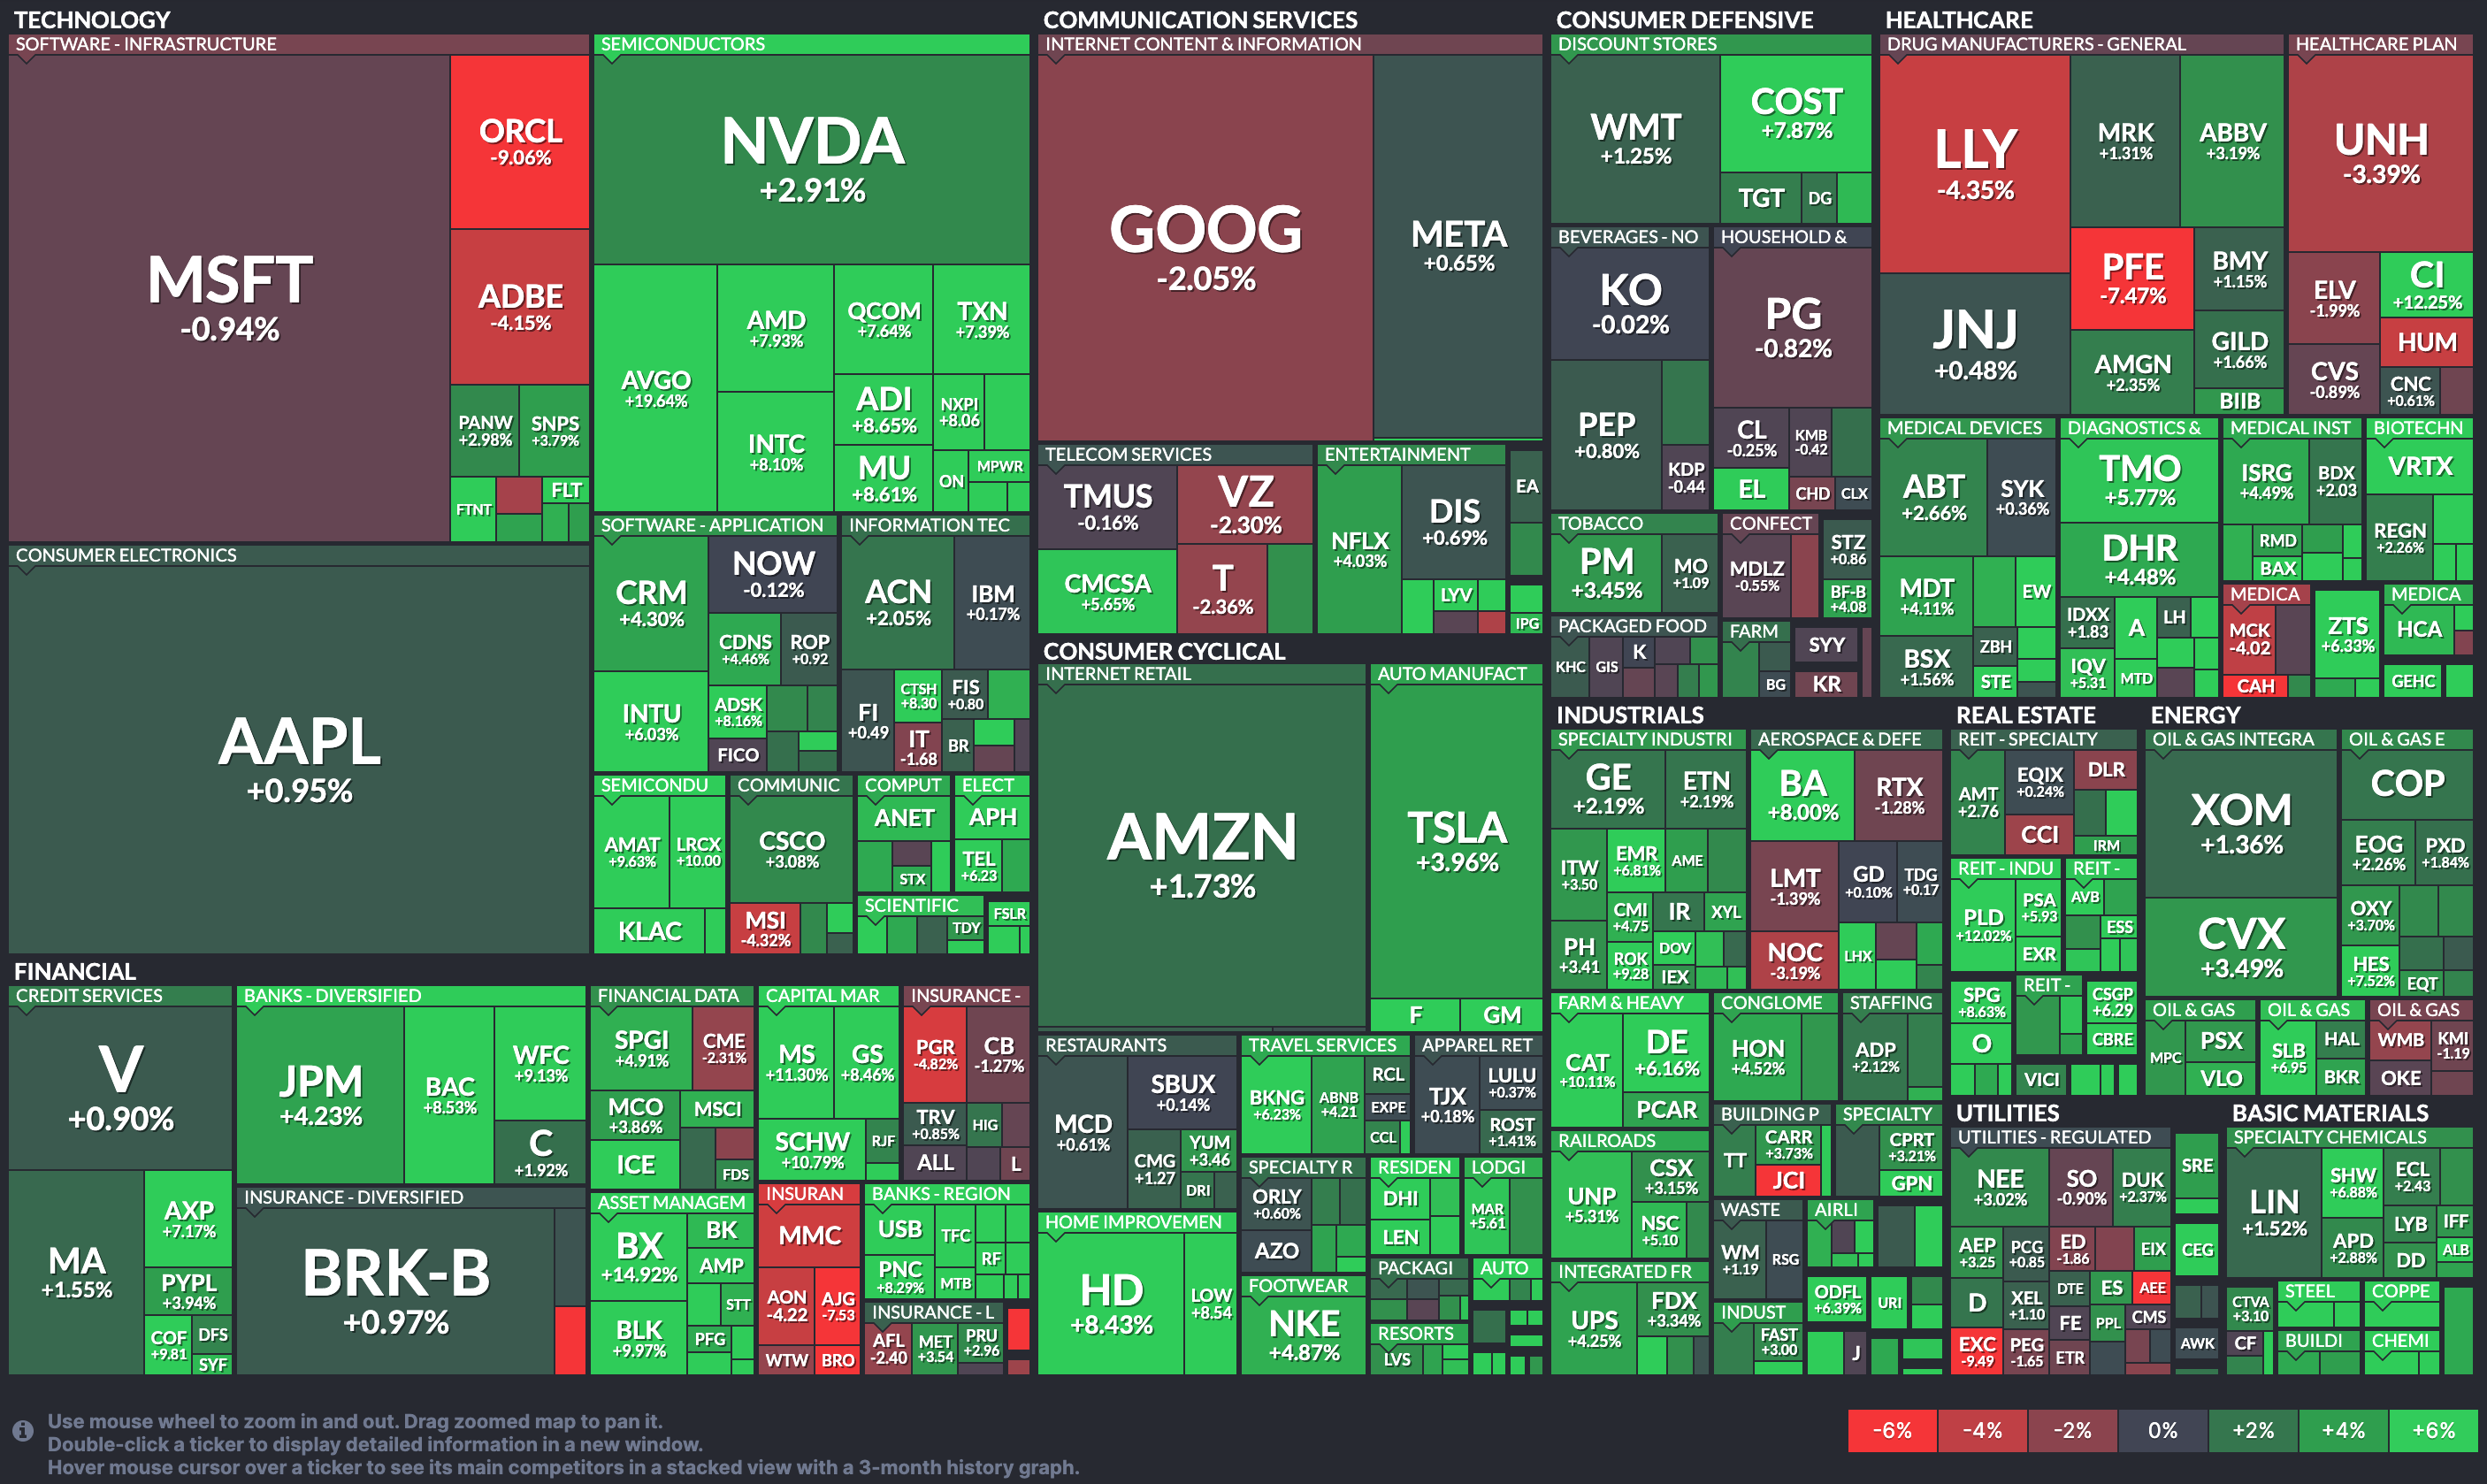
Last week’s best performing U.S. sector: Real Estate (two biggest holdings: Prologis, American Tower) - up 5.6% for the week.
Last week’s worst performing U.S. sector: Communication Services (two biggest holdings: Alphabet/Google, Meta/Facebook) - up 0.7% for the week.
SPY, the S&P 500 Large Cap ETF, is made up of the stocks of the 500 largest U.S. companies. It rose 2.1% last week, is up 24.6% year-to-date (total return) and is now 1.8% below its all-time high (01/03/2022). SPY is above its 50-day and 90-day moving averages and is also above its long term trend line, with a RSI of 73***
IWM, the Russell 2000 Small Cap ETF, is made up of the bottom two-thirds in terms of company size of the group of the 3,000 largest U.S. stocks. It rose 5.9% last week, is up 14.3% year-to-date (total return) and is now 18.8% below its all-time high (11/05/2021). IWM is above its 50-day and 90-day moving averages and is also above its long term trend line, with a RSI of 75***
*** RSI (Relative Strength Index) above 70: strong but technically overbought, RSI below 30: weak but technically oversold
The VIX, the commonly-accepted measure of expected upcoming stock market risk and volatility (often referred to as the “fear index”) implied by S&P 500 index option trading, ended the week 0.1 points (1%) lower at 12.3. It is below its 50-day and 90-day moving averages and is also below its long term trend line.
The proprietary Lowry's measure for US stock market Buying Power rose by 15 points last week to 165 and that of US stock market Selling Pressure fell by 7 points to 121 over the course of the week.
AVERAGE 30-YEAR FIXED MORTGAGE RATE ..
6.95%
One week ago: 7.03%, one month ago: 7.44%, one year ago: 6.31%
Data courtesy of: FRED Economic Data, St. Louis Fed as of Thursday of last week.
FEAR & GREED INDEX ..
“Be fearful when others are greedy and be greedy when others are fearful.” Warren Buffet.

The Fear & Greed Index from CNN Business can be used as an attempt to gauge whether or not stocks are fairly priced and to determine the mood of the market. It is a compilation of seven different indicators that measure some aspect of stock market behavior. They are: market momentum, stock price strength, stock price breadth, put and call options, junk bond demand, market volatility and safe haven demand.
Extreme Fear readings can lead to potential opportunities as investors may have driven prices “too low” from a possibly excessive risk-off negative sentiment.
Extreme Greed readings can be associated with a sense of “FOMO” and investors chasing rallies in an excessively risk-on environment, possibly leaving the market vulnerable to a sharp downward correction at some point.
The “sweet spot” is considered to be in the lower-to-mid “Greed” zone.
Data courtesy of CNN Business.
% OF S&P 500 STOCKS TRADING ABOVE THEIR LONG TERM MOVING AVERAGE (LTMA) ..
72% (360 of the 500 largest stocks in the U.S. ended last week above their LTMA and 140 were below)
One week ago: 62%, one month ago: 49%, one year ago: 51%
A closely-watched measure of market breadth and participation, providing a real-time look at how many of the largest 500 publicly-traded stocks in the U.S. are trending higher or lower, as defined by whether the stock price is above or below the 200-day moving average which is among the most widely-followed of all stock market technical indicators.
The higher the reading, the better the deemed health of the overall market, with 50% considered to be a key pivot point.
WEEKLY US INVESTOR SENTIMENT (outlook for the upcoming 6 months) ..
↑Bullish: 51% (47% a week ago)
⬌ Neutral: 30% (25% a week ago)
↓Bearish: 19% (28% a week ago)
Net Bull-Bear spread: ↑Bullish by 32 (Bullish by 19 a week ago)
For context: Long term averages: Bullish: 38% — Neutral: 32% — Bearish: 30% — Net Bull-Bear spread: Bullish by 8
Survey participants are typically polled during the first half of the week.
Data courtesy of: American Association of Individual Investors (AAII).
FEDWATCH INTEREST RATE PREDICTION TOOL ..
Where will interest rates be after the Fed’s next meeting on January 31st?
↓ Lower than now .. 10% probability
One week ago: 4%, one month ago: 0%
⬌ Unchanged from now .. 90% probability
One week ago: 93%, one month ago: 100%
Data courtesy of CME FedWatch Tool. Based on the Fed Funds rate (currently 5.375%). Calculated from Federal Funds futures prices as of Friday.
US TREASURY INTEREST RATE YIELD CURVE ..

The highest rate on the yield curve (5.54%) is being paid for the 2-month duration and the lowest rate (3.91%) is for the 10-year.
The most closely-watched and commonly-used comparative measure of the spread between the 2-year and the 10-year rose last week from 0.48% to 0.53%, indicating a steepening in the inversion of the curve.
The interest rate yield curve remains unusually “inverted” (i.e. shorter term interest rates are generally higher than longer term ones). Based on the 2-year vs. 10-year spread, the curve has been inverted since July 2022.
Historically, an inverted yield curve is not the norm and has been regarded by many as a leading indicator of an impending recession, with shorter term risk deemed to be unusually higher than longer term. The steeper the inversion, the greater the deemed risk of recession.
Data courtesy of ustreasuryyieldcurve.com as of Friday. Lightly shaded area shows the current Federal Funds rate range.
WWW.ANGLIAADVISORS.COM | SIMON@ANGLIAADVISORS.COM | CALL OR TEXT: (929) 677 6774 | FOLLOW ANGLIA ADVISORS ON INSTAGRAM
This material represents a highly opinionated assessment of the financial market environment based on assumptions and prevailing data at a specific point in time and is always subject to change at any time. No warranty of its accuracy or completeness is given. It is never to be interpreted as an attempt to forecast any future events, nor does it offer any kind of guarantee of any future results, circumstances or outcomes.
The material contained herein is not necessarily complete and is wholly insufficient to be exclusively relied upon as research or investment advice or as a sole basis for any investment or other financial decisions. The user assumes the entire risk of any decisions made or actions taken based in whole or in part on any of the information provided in this or any Anglia Advisors communication of any kind. Under no circumstances is any of Anglia Advisors’ content ever intended to constitute tax, legal or medical advice and should never be taken as such. Neither the information contained or any opinion expressed herein constitutes a solicitation for the purchase of any security or asset class.
Posts may contain links or references to third party websites or may post data or graphics from them for the convenience and interest of readers. While Anglia Advisors may have reason to believe in the quality of the content provided on these sites, the firm has no control over, and is not in any way responsible for, the accuracy of such content nor for the security or privacy protocols that external sites may or may not employ. By making use of such links, the user assumes, in its entirety, any kind of risk associated with accessing them or making use of any information provided therein.
Those associated with Anglia Advisors, including clients with managed or advised investments, may maintain positions in securities and/or asset classes mentioned in this post.

If you enjoyed this post, why not share it with someone or encourage them to subscribe themselves?


