


The final full trading week of 2023 was basically more of the same. With many market participants already in holiday mode, volumes were low but even a rare victory for the bears on Wednesday was swiftly reversed by the bulls. Wall Street seems determined to keep this party going as long as it can.
Last weekend, Fed officials began trying to pour whatever the opposite is of gasoline onto the fire of stock market euphoria. And as the week began, the Fed presidents of Atlanta, San Francisco and Chicago all joined their New York-based colleague in pushing back on the jubilant narrative, emphasizing that it’s a reach to consider interest rate cuts until officials become completely convinced that the economy is firmly on a path back to the 2.0% inflation target. It’s currently close to double that.
But this kind of pushback is just about as meaningful as a Christmas card from your local internet provider if investors keep covering their ears and shouting “We can’t hear you!” and that’s exactly what the stock market did on Monday as indexes like the S&P 500 and especially the NASDAQ-100 continued their relentless climb.
Tuesday was another sea of green across trading screens with Small Cap stocks again stealing the show. All Fed pushback to market giddiness was once again routinely ignored. The stock market seemed absolutely determined to let the good times keep rolling and no chirping Fed presidents saying that perhaps traders may be getting ahead of themselves with interest rate cut expectations were going to stop that from happening.
However, after the closing bell, there was a bit of a gut-punch. FedEx delivered its Q3 results and missed earnings estimates by a mile. It also gave a gloomy forward guidance outlook. This is important as Fedex is sometimes considered to be something of a proxy for business activity in the U.S. economy.
Fedex shares sank as a result on Wednesday. After initially pushing index prices higher yet again, Wall Street finally decided around lunchtime that it was time to take a breather and bank some profits from the recent furious rally. Stocks actually ended up suffering their worst one-day drop in months with all the indexes sinking about 1.5% or more for the session.
In many ways, Thursday started out not dissimilar to Wednesday. A strong morning with prices driving higher on the back of some nice earnings reports was followed by a lunchtime pullback, but this time FOMO-infected buyers and the newly-emboldened BTFD crowd took the opportunity to step back in to the low volume market, partly encouraged by confirmation that Q3 Gross Domestic Product (GDP) increased at a seriously impressive 4.9% rate and growing speculative optimism about the following day’s inflation report. By the time the closing bell sounded, most of Wednesday’s losses had been recovered.
Friday was all about the Core Personal Consumption Expenditures (PCE) Price Index, the Federal Reserve’s very definition of what inflation actually is. We learned that it barely rose at all in November, increasing by just 0.1% from a month earlier after a downwardly revised 0.1% gain in October. From a year ago, it advanced 3.2%. Indeed, if you look at it just over the past six months, this definition of inflation is running at only 1.9% annualized, actually below the Fed’s 2% target.
This was splendid news for the Fed and appeared to justify their decisions not to raise interest rates at any of their last three meetings, but the central bank still remains cautious. Markets, however, are throwing that caution to the wind and seem pretty much ready to declare victory and job done in the war on inflation. The major indexes were pretty flat on the day, but this was not surprising for a low volume final session before a three-day Christmas weekend.
The stock market has been rallying for one primary reason: Falling Treasury yields (and as a result, lower interest rates). The anticipation of future interest rate cuts has become so strong that it has even helped markets disregard several quite concerning corporate earnings reports.
Astonishingly, following its December meeting, the Fed didn’t just confirm market expectations of rate cuts in 2024, it actually increased them. The Fed itself signaled one more cut than what was realistically expected and it formally signaled rate hikes are over. It essentially abandoned, after just a few months, its whole looming threat of “higher for longer” interest rates.
Since its October 27th low, the S&P 500 has surged more than 15%. So, in the end, the market rallied because the Fed essentially wiped away the whole reason for the sharp drop in stock prices that we experienced from August to October.
Can this rally continue? Yes, but it’s not in the Fed’s hands any more. Markets have aggressively priced in definitely no recession and no meaningful slowdown, but that’s premature. The economy could easily slow and indeed there are some signals that this is already happening.
With its recent positive pivot, the Fed has now fired its final bullet. Frankly, it is no longer able to help markets now if worries about a serious economic slowdown emerge. So close attention to upcoming economic data is absolutely essential for gaining a sense of where the stock market is heading.
OTHER NEWS ..
The Best In The World .. The world’s best performing stock this year is a South Korean electric vehicle supplier. Shares of Ecopro comfortably beat the rest of the 2,647 member Bloomberg World Index - delivering returns of 571% this year, despite having actually fallen 50% from its peak in July. Last year’s winner PT Adaro Minerals Indonesia, which had a 1,595% gain in 2022, fell 19% in 2023.
The Best, The Worst And The Busiest In The World .. In a survey of nearly 16k travelers at airports around the world as reported by Bloomberg, Muscat International airport in Oman was named best airport in the world. The highest ranked U.S. airport was Minneapolis-St. Paul International which came in at #13. Fresh from spending $8 billion on renovations, New York LaGuardia only placed 70th but still well ahead of New York JFK which finished in 106th place.
The worst airport in the world according to the survey is Banjarmasin Syamsudin Noor International airport in Indonesia, but also gracing the list of the bottom ten airports on the planet were London Gatwick and Toronto Pearson.
The busiest airport in the world remains Atlanta Hartsfield-Jackson, followed by Dubai International, Tokyo Haneda and London Heathrow. The world’s busiest international route was Kuala Lumpur <> Singapore. The flagship trans-Atlantic route, London Heathrow <> New York JFK, dropped from fourth place to eighth.
UNDER THE HOOD ..
The intensification of Demand in recent weeks has been very promising and is very different from what we saw in 2023’s previous index rallies which generally failed to be accompanied by such a demand expansion. The percent of stocks hitting new one year highs exploded to levels not seen since June 2021, reaching 19% on December 14th.
The greater the number of stocks reaching new highs with the indexes, the more broad-based the Demand intensity is. Contrary to popular belief, markets do not tend to top out when this figure is elevated. Rather, market usually turn down following months of dwindling new highs.
Things having been going berserk in Small Cap world. Just 48 days after hitting 52 week lows, the Russell 2K Small Cap Index hit 52 week highs. That has never happened before in such a short period of time.
Anglia Advisors clients are welcome to reach out to me to discuss market conditions further.
THIS WEEK’S UPCOMING CALENDAR ..
Stock and bond markets will be closed on Monday for Christmas and the calendar will be pretty empty.
There will be Home Price Index numbers to look forward to but the earnings calendar is quiet. Q4 earnings season doesn’t kick off until January 12th with results from JPMorgan Chase, Bank of America, Citigroup, and Wells Fargo.
ARTICLE OF THE WEEK ..
Rich Author, Poor Readers. Try as he might, professional doomer Robert Kiyosaki just can’t seem to get anything right.
LAST WEEK BY THE NUMBERS ..
Last week’s market color courtesy of finviz.com

Last week’s best performing U.S. sector: Communication Services (two biggest holdings: Alphabet/Google, Meta/Facebook) - up 2.2% for the week.
Last week’s worst performing U.S. sector: Utilities (two biggest holdings: NextEra Energy, Southern Co.) - down 2.1% for the week.
SPY, the S&P 500 Large Cap ETF, is made up of the stocks of the 500 largest U.S. companies. It rose 0.4% last week, is up 25.8% year-to-date (total return) and is now just 0.9% below its all-time high (01/03/2022).
IWM, the Russell 2000 Small Cap ETF, is made up of the bottom two-thirds in terms of company size of the group of the 3,000 largest U.S. stocks. It rose 2.6% last week, is up 17.3% year-to-date (total return) and is now 16.9% below its all-time high (11/05/2021).
The proprietary Lowry's measure for US stock market Buying Power rose by 6 points last week to 171 and that of US stock market Selling Pressure fell by 7 points to 114 over the course of the week.
AVERAGE 30-YEAR FIXED MORTGAGE RATE ..
6.67%
One week ago: 6.95%, one month ago: 7.29%, one year ago: 6.27%
Data courtesy of: FRED Economic Data, St. Louis Fed as of Thursday of last week.
FEAR & GREED INDEX ..
“Be fearful when others are greedy and be greedy when others are fearful.” Warren Buffet.
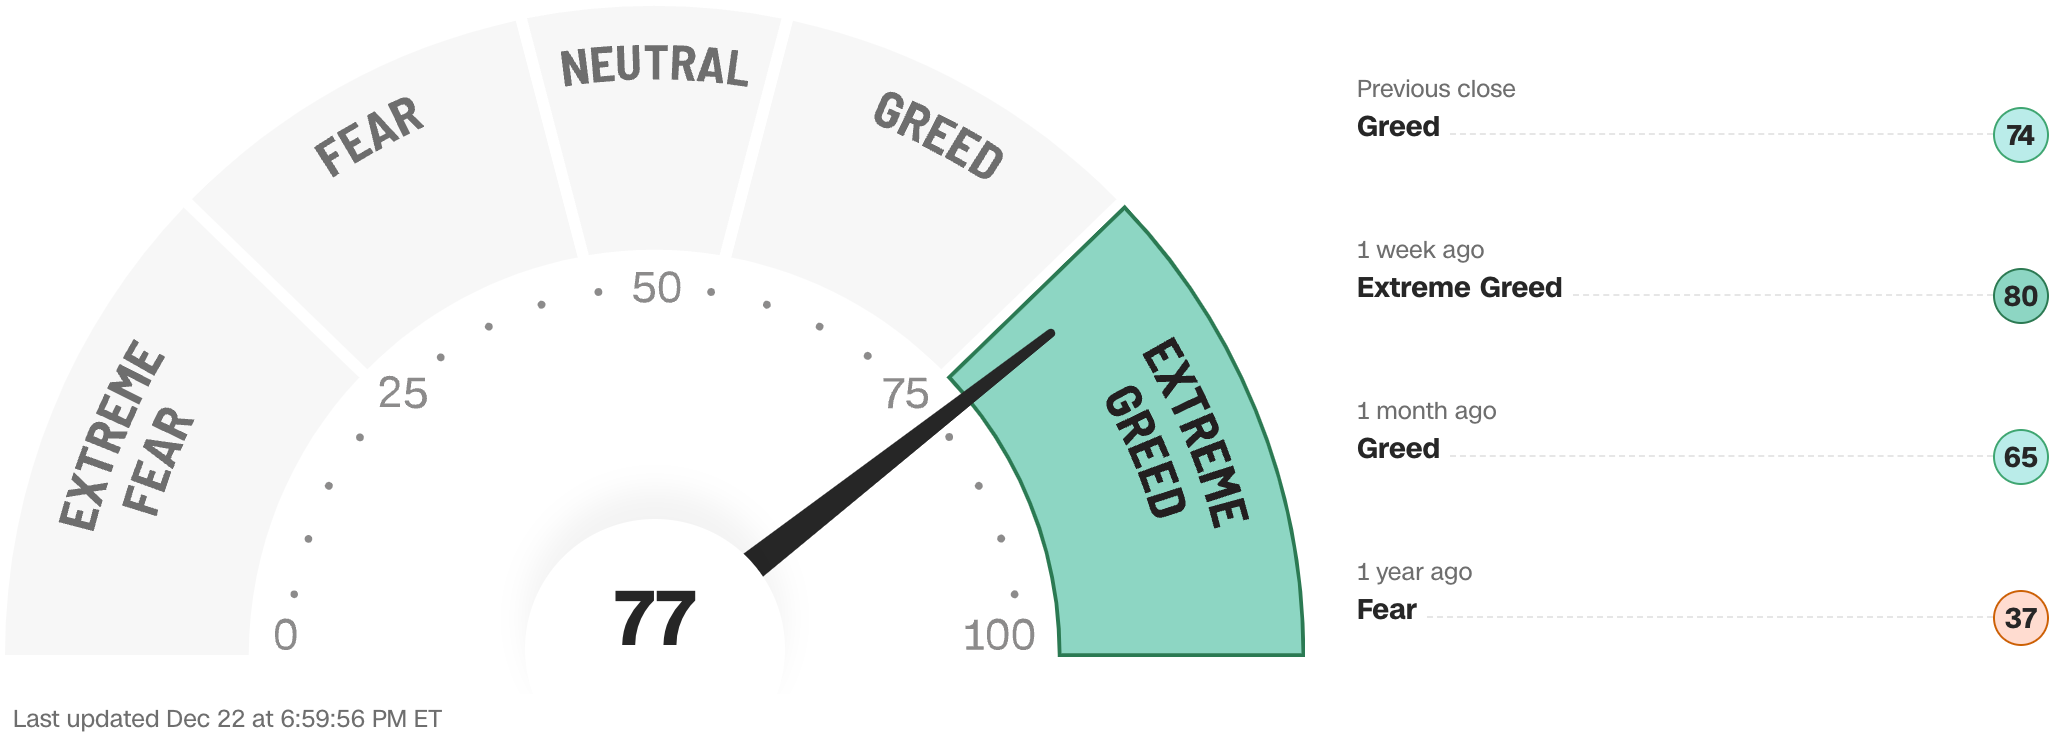
The Fear & Greed Index from CNN Business can be used as an attempt to gauge whether or not stocks are fairly priced and to determine the mood of the market. It is a compilation of seven different indicators that measure some aspect of stock market behavior. They are: market momentum, stock price strength, stock price breadth, put and call options, junk bond demand, market volatility and safe haven demand.
Extreme Fear readings can lead to potential opportunities as investors may have driven prices “too low” from a possibly excessive risk-off negative sentiment.
Extreme Greed readings can be associated with a sense of “FOMO” and investors chasing rallies in an excessively risk-on environment, possibly leaving the market vulnerable to a sharp downward correction at some point.
The “sweet spot” is considered to be in the lower-to-mid “Greed” zone.
Data courtesy of CNN Business.
% OF S&P 500 STOCKS TRADING ABOVE THEIR LONG TERM MOVING AVERAGE (LTMA) ..
74% (369 of the 500 largest stocks in the U.S. ended last week above their LTMA and 131 were below)
One week ago: 72%, one month ago: 55%, one year ago: 48%
A closely-watched measure of market breadth and participation, providing a real-time look at how many of the largest 500 publicly-traded stocks in the U.S. are trending higher or lower, as defined by whether the stock price is above or below the 200-day moving average which is among the most widely-followed of all stock market technical indicators.
The higher the reading, the better the deemed health of the overall market, with 50% considered to be a key pivot point.
WEEKLY US INVESTOR SENTIMENT (outlook for the upcoming 6 months) ..
↑Bullish: 53% (51% a week ago)
⬌ Neutral: 26% (30% a week ago)
↓Bearish: 21% (19% a week ago)
Net Bull-Bear spread: ↑Bullish by 32 (Bullish by 32 a week ago)
For context: Long term averages: Bullish: 38% — Neutral: 32% — Bearish: 30% — Net Bull-Bear spread: Bullish by 8
Survey participants are typically polled during the first half of the week.
Data courtesy of: American Association of Individual Investors (AAII).
FEDWATCH INTEREST RATE PREDICTION TOOL ..
Where will interest rates be after the Fed’s next meeting on January 31st?
↓ Lower than now .. 14% probability
One week ago: 10%, one month ago: 0%
⬌ Unchanged from now .. 86% probability
One week ago: 90%, one month ago: 91%
Data courtesy of CME FedWatch Tool. Based on the Fed Funds rate (currently 5.375%). Calculated from Federal Funds futures prices as of Friday.
US TREASURY INTEREST RATE YIELD CURVE ..
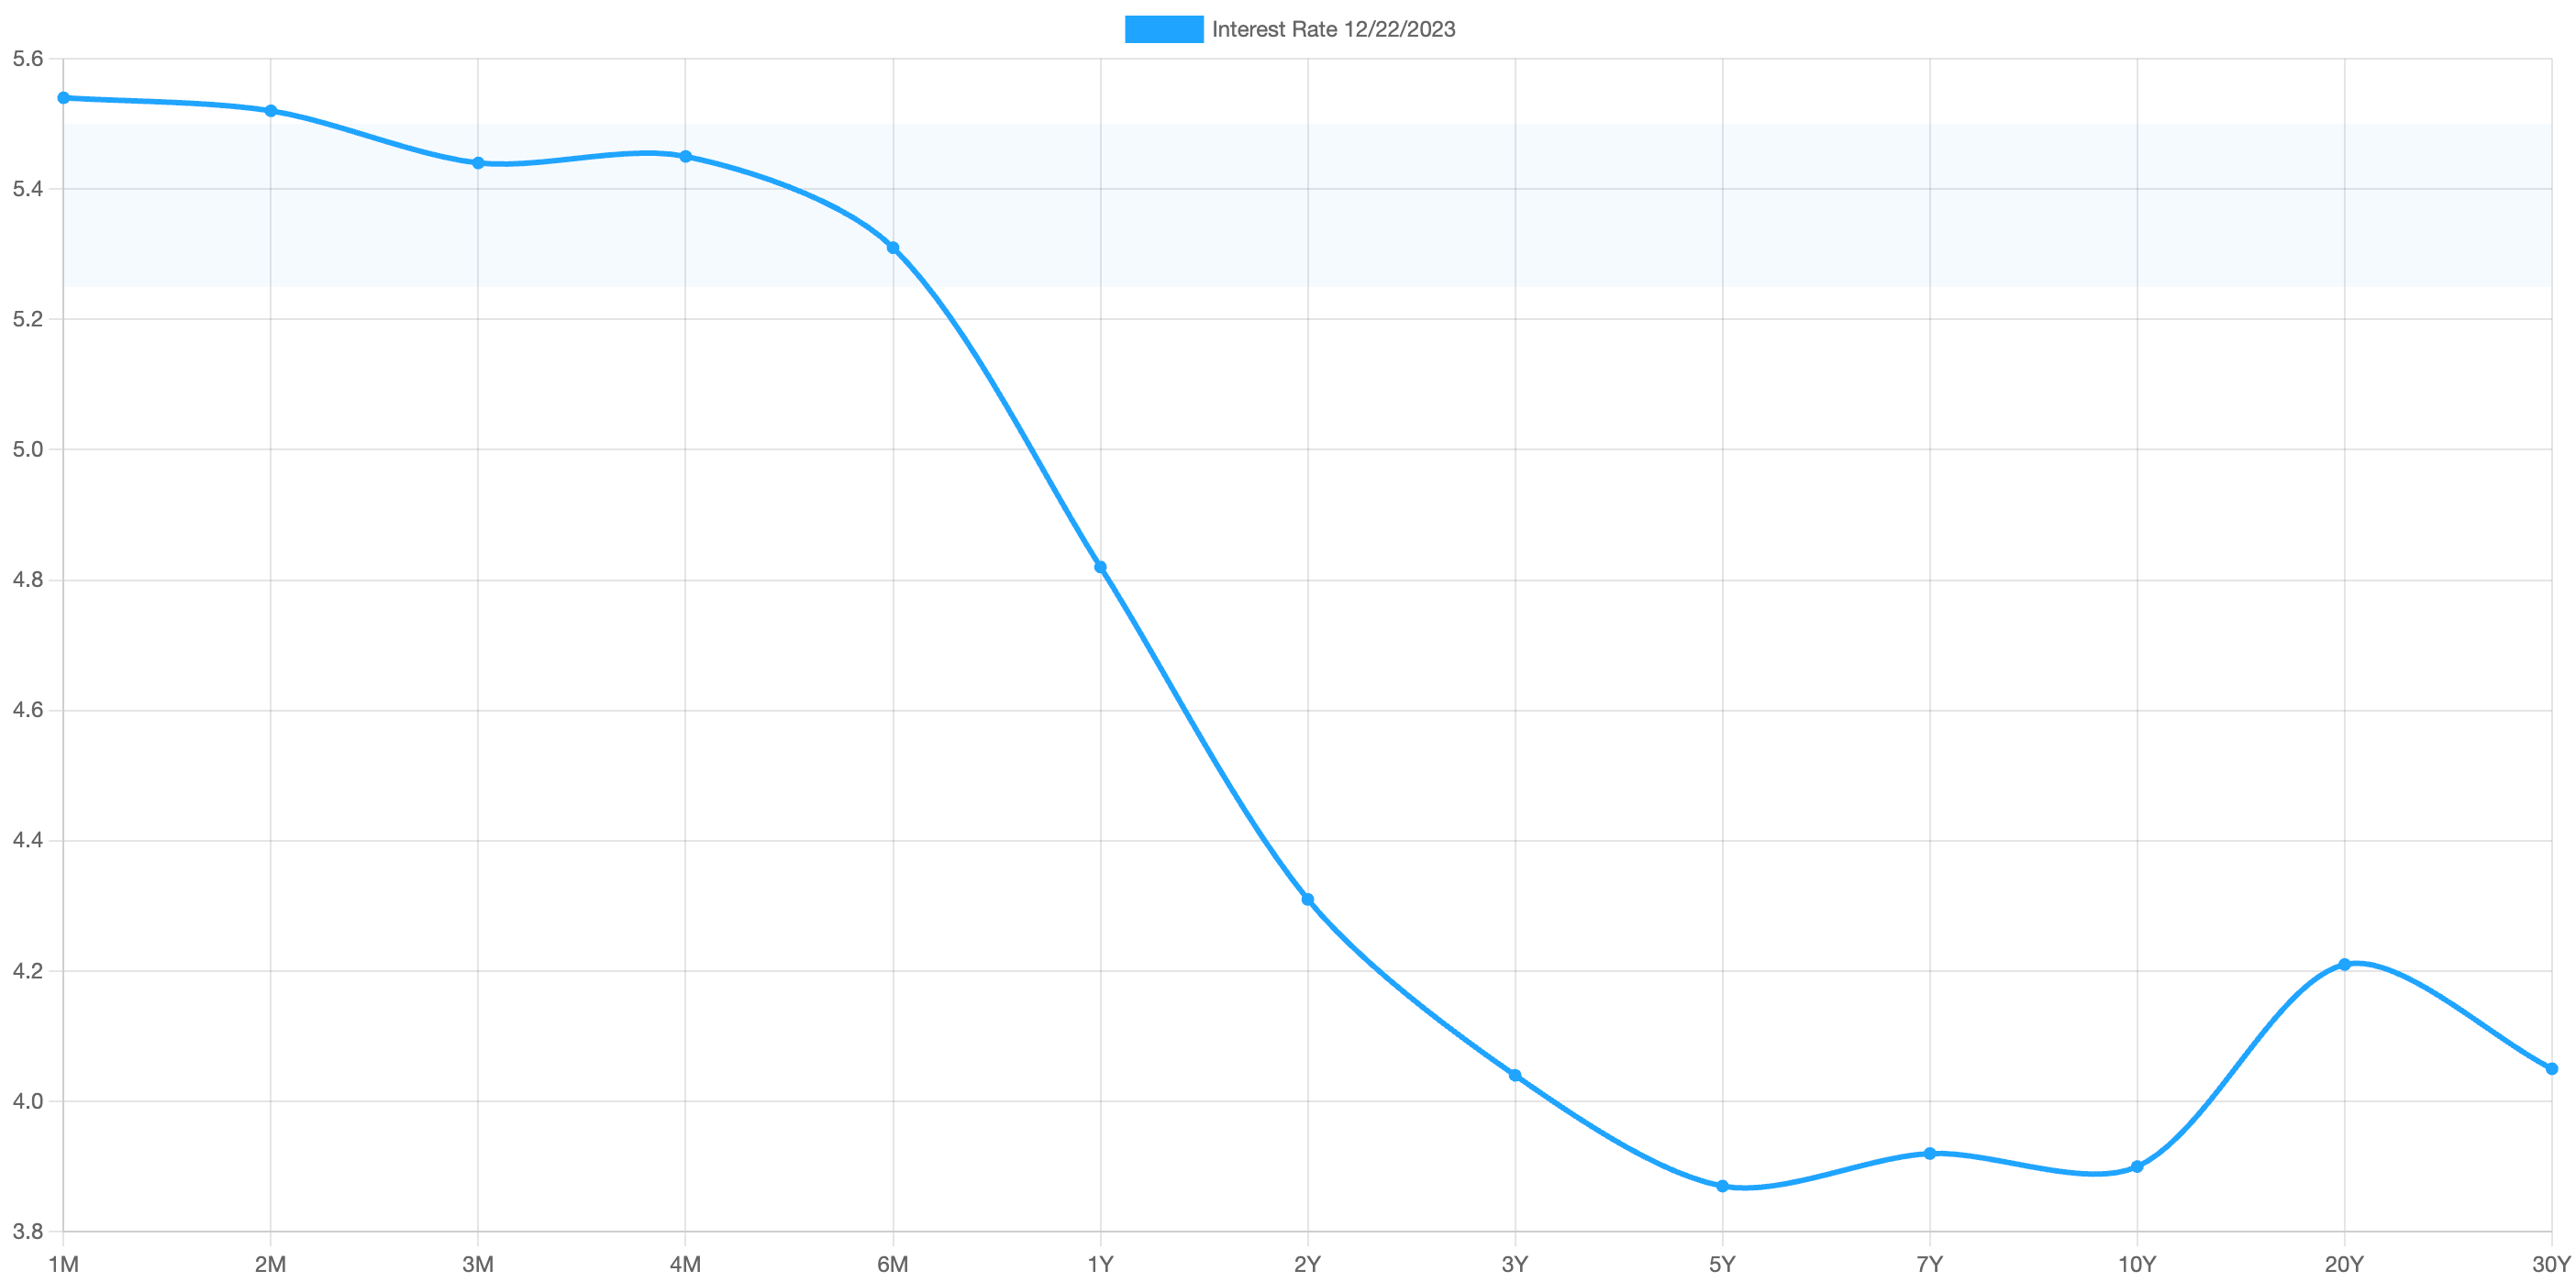
The highest rate on the yield curve (5.54%) is being paid for the 1-month duration and the lowest rate (3.87%) is for the 5-year.
The most closely-watched and commonly-used comparative measure of the spread between the 2-year and the 10-year fell last week from 0.53% to 0.41%, indicating a flattening in the inversion of the curve.
The interest rate yield curve remains unusually “inverted” (i.e. shorter term interest rates are generally higher than longer term ones). Based on the 2-year vs. 10-year spread, the curve has been inverted since July 2022.
Historically, an inverted yield curve is not the norm and has been regarded by many as a leading indicator of an impending recession, with shorter term risk deemed to be unusually higher than longer term. The steeper the inversion, the greater the deemed risk of recession.
Data courtesy of ustreasuryyieldcurve.com as of Friday. Lightly shaded area shows the current Federal Funds rate range.
WWW.ANGLIAADVISORS.COM | SIMON@ANGLIAADVISORS.COM | CALL OR TEXT: (929) 677 6774 | FOLLOW ANGLIA ADVISORS ON INSTAGRAM
This material represents a highly opinionated assessment of the financial market environment based on assumptions and prevailing data at a specific point in time and is always subject to change at any time. No warranty of its accuracy or completeness is given. It is never to be interpreted as an attempt to forecast any future events, nor does it offer any kind of guarantee of any future results, circumstances or outcomes.
The material contained herein is not necessarily complete and is wholly insufficient to be exclusively relied upon as research or investment advice or as a sole basis for any investment or other financial decisions. The user assumes the entire risk of any decisions made or actions taken based in whole or in part on any of the information provided in this or any Anglia Advisors communication of any kind. Under no circumstances is any of Anglia Advisors’ content ever intended to constitute tax, legal or medical advice and should never be taken as such. Neither the information contained or any opinion expressed herein constitutes a solicitation for the purchase of any security or asset class.
Posts may contain links or references to third party websites or may post data or graphics from them for the convenience and interest of readers. While Anglia Advisors may have reason to believe in the quality of the content provided on these sites, the firm has no control over, and is not in any way responsible for, the accuracy of such content nor for the security or privacy protocols that external sites may or may not employ. By making use of such links, the user assumes, in its entirety, any kind of risk associated with accessing them or making use of any information provided therein.
Those associated with Anglia Advisors, including clients with managed or advised investments, may maintain positions in securities and/or asset classes mentioned in this post.

If you enjoyed this post, why not share it with someone or encourage them to subscribe themselves?


